

DAILY MORNING NOTE | 15 February 2023
Trade of the Day
Analyst: Zane Aw
(Current Price: US$171.08) – TECHNICAL BUY
Buy price: US$171.08 Stop loss: US$165.00 Take profit 1: US$178.80Take profit 2: US$189.20
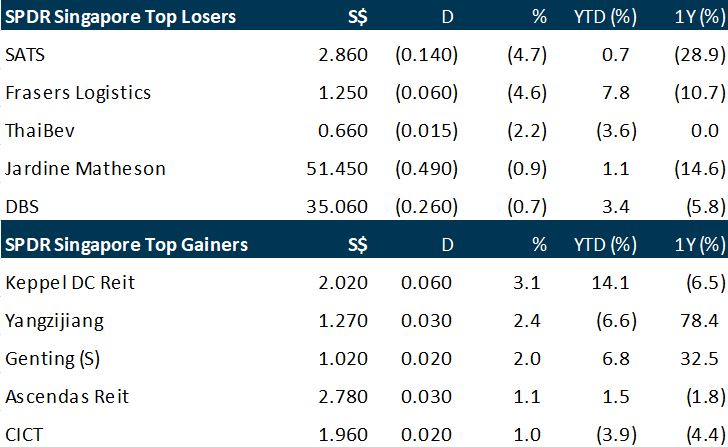
Singapore shares fell marginally on Tuesday (Feb 14) as traders stayed on the sidelines, anxiously awaiting key US inflation data for more clues on rate movements in the world’s largest economy. Measures announced in the Singapore Budget 2023 also gave investors plenty to digest. The Straits Times Index (STI) slipped 6.5 points or 0.2 per cent to 3,318.20. On the wider bourse, losers outnumbered gainers 252 to 248 after 1.2 billion securities worth S$880.4 million changed hands. Sats came up among the STI’s top decliners on Tuesday, slipping S$0.14 or 4.7 per cent to S$2.86. It was also the day’s eighth-most actively traded counter, with 20.2 million shares transacted. Fibre network infrastructure provider NetLink NBN Trust bucked losses on the Singapore Exchange on Tuesday, rising S$0.02 or 2.3 per cent to S$0.875.
The Dow declined and the Nasdaq rose on Tuesday as markets digested US inflation data that contained a mixture of reassuring and problematic signs. The consumer price index reading rose 6.4 per cent in January from a year ago, according to Labor Department data. Although this marks the smallest annual increase since October 2021, the level is well above policymakers’ two percent target. The Dow Jones Industrial Average finished down 0.5 per cent at 34,089.27. The broad-based S&P 500 edged down less than 0.1 per cent to 4,136.13, while the tech-rich Nasdaq Composite Index gained 0.6 per cent to 11,960.15. Among individual companies, Marriott International jumped 4.0 per cent after reporting higher profits on a 33 per cent surge in revenues. Boeing climbed 1.3 per cent after it sealed a deal to sell Air India 220 planes, as part of an expansion by the Indian carrier. Palantir shot up 21.2 per cent after the data analytics company announced its first profitable quarter since it was founded nearly 20 years ago.
SG
To reposition Singapore for a “new era” of global development, the Government will spend around S$104.2 billion to grow the economy, equip workers and build up the country’s collective resilience, while making immediate moves to help families and vulnerable Singaporeans cope with high inflation. Delivering the Budget 2023 speech in Parliament on Tuesday (Feb 14), Deputy Prime Minister and Finance Minister Lawrence Wong said that the world’s economy is expected to enter a stage of greater contestation and fragmentation, with nations thinking less about mutual benefit and interdependence and more about national gain and security. For Budget 2023, Mr Wong said that an overall deficit of S$0.4 billion, or 0.1 per cent of the economy, is expected. There is no need for any draw on past reserves in this year’s Budget. The Contingencies Fund, which was raised in 2020 from S$3 billion to S$16 billion to help Singapore respond quickly to urgent and unforeseen cashflow needs during the COVID-19 pandemic, will now be reduced to S$6 billion. Total government expenditure for the year is estimated to hit S$104.15 billion, a slight decrease from the S$106.95 billion Budget in 2022.
Silverlake Axis has reported a slight earnings improvement for its 1HFY2023. For the six months to Dec 31 2022, earnings increased by 5% y-o-y to RM99.7 million. Revenue in the same period increased by 9% y-o-y to RM392.3 million. The company’s total recurring revenue, which gives better earnings visibility, increased 3% y-o-y to RM278.1 million, which accounts for more than 70% of the total. Separately, the company announced it has won contracts worth a total of RM145 million from customers in 2QFY2023.
Weighed down by negative market environment and a $5.2 million impairment from its exit from India, iFast Corporation’s net profit decreased 79.0% y-o-y to $6.42 million for FY2022 ended December. The Group’s total revenue dropped 11.3% y-o-y to $48.53 million in 4QFY2022 and decreased 3.7% YoY to $208.87 million in FY2022. For 4QFY2022, iFast posted a 82% y-o-y drop in net profit to $1.3 million, while revenue fell 13% y-o-y to $47.4 million. As at Dec 31, 2022, the Group’s assets under administration (AUA) declined 8.3% YoY to $17.42 billion. iFast maintains that net inflows of client assets have remained “healthy” in 4Q2022 and FY2022, reaching $263 million in 4QFY2022 and $2,125 million in FY2022.
Far East Hospitality Trust (FEHT) has reported a distribution per share (DPS) of 1.73 cents for the 2HFY2022 ended Dec 31, 2022, 13.1% higher than the DPS of 1.53 cents in the same period the year before. For the FY2022, DPS grew by 24.3% to 3.27 cents, up from the DPS of 2.63 cents in the FY2021. 2HFY2022 gross revenue grew by 2.2% y-o-y to $42.6 million thanks to growth from both the trust’s hotel and serviced residences (SR) portfolio and offset by the decrease in revenue contribution from Village Residences Clarke Quay (VRCQ) following its divestment on March 24, 2022. On a like-for-like basis, with FEHT’s 12 properties excluding Central Square which was divested in March 2022, gross revenue would have grown by 10.7% y-o-y. During the six-month period, FEHT’s average daily rate (ADR) of hotels grew by 98.6% y-o-y to $147 thanks to the higher number of travellers for leisure and business, as well as the return of high-profile events. Average occupancy, however, fell by 2.0 percentage points y-o-y to 79.1% as a few hotels exited the government contracts at the end of 2021. The Elizabeth Hotel was also closed for renovation for part of the second half of 2022. Revenue per available room (RevPAR) grew by 93.3% y-o-y to $116. 2HFY2022 net property income increased by 2.3% y-o-y to $39.9 million but would have increased by 10.5% y-o-y on a same-store basis. 2HFY2022 income available for distribution fell by 8.5% y-o-y to $30.2 million as the amount in the 2HFY2021 included the release of $3.5 million of taxable income available for distribution. Excluding the release of the sum, income available for distribution would have increased by 2.3% y-o-y.
Elite Commercial REIT has reported a distribution per unit (DPU) of 2.25 pence (4.02 cents) for the 2HFY2022 ended Dec 31, 2022, 19.6% lower than the DPU of 2.80 pence in the same period the year before. DPU for the FY2022 fell by 11.4% to 4.81 pence, down from FY2021’s 5.43 pence. During the 2HFY2022, revenue fell by 2.5% y-o-y to GBP18.4 million as a result of two vacant properties during the period. 2HFY2022 net property income (NPI) fell by 3.82% y-o-y to GBP17.6 million on the back of the lower revenue and higher property operating expenses. Distributable income fell by 18.8% y-o-y to GBP10.9 million. As at Dec 31, 2022, the REIT’s investment properties fell by 8.2% y-o-y to GBP460.0 million due to the lower market valuation on investment properties, aligned with the worsened general economic environment in the UK. The REIT’s net asset value (NAV) per unit came at 52 pence as at Dec 31, 2022, down from the 61 pence in the year before. Its gearing ratio stood at 45.8%. As at Dec 31, 2022, the REIT’s portfolio occupancy stood at 97.9% with a weighted average lease expiry (WALE) of 4.8 years.
Glove maker UG Healthcare has reported a loss of $4.78 million for 1HFY2023, a sharp swing from earnings of $21.2 million recorded in the year earlier. Revenue for the six months ended Dec 31 2022 was $55.9 million, down 52.3% y-o-y from $117.3 million. The company attributes the losses to a “rapid decline” in the average selling prices across all product segments. The company plans to further postpone the addition of production capacity of some 1.2 billion pieces per year. This addition was originally planned for October 2022.
Creative Technology has reported a loss of US$10.6 million for 1HFY2023, reversing from earnings of US$1.24 million recorded in the year earlier. Revenue in the same period was US$28.2 million, down 17% y-o-y from US$34.2 million. Besides lower sales, the company incurred higher R&D costs. Creative says that under former chairman and CEO Sim Wong Hoo, a restructuring exercise has resulted in a leaner organisation with a lower cost structure. Creative is “cautiously optimistic” on its outlook for the second half year of FY2023 with market sentiment and the supply chain environment improving. With the restructuring, Creative expects revenue to be maintained at current levels but margins to improve and therefore, losses to be reduced.
Avi-Tech Holdings has maintained earnings of $2 million for 1HFY2023, versus 1HFY2022. Revenue, for the same six months ended Dec 31 2022, was up 14.6% y-o-y to $17.8 million, with higher contributions across its various business segments. The company explains that higher costs, specifically in power, put pressure on its margins. It suffered from unfavourable forex movements too. The company cautions that the macro-economic environment continues to face uncertainty.
Heavy lift provider Tiong Woon Corporation Holding has reported revenue of $65.9 million for 1HFY2023, up 8% y-o-y on better demand with a pick-up in construction activities across the region. However, earnings for the same half year ended Dec 31 2022 dipped to $7.2 million from $7.8 million. The company explains the drop was because of an operational exchange loss of $3 million arising mainly from the revaluation of intercompany balances following the appreciation of the Singdollar during the period. Tiong Woon says that the business environment remains challenging and uncertain amid the ongoing Russia-Ukraine conflict, geopolitical tensions, elevated interest rates and inflationary pressures, as well as concerns over an economic slowdown in the global economy in 2023.
Newly-listed NoonTalk Media has posted a net loss of $2.1 million for 1HFY2023 ended December, with revenue down 10.9% y-o-y to $2.0 million following a decrease in revenue contribution from its management and events segment. Excluding the one-off listing and associated costs of $1.5 million, however, the company’s adjusted net loss would have been $624,086 for 1HFY2023, compared to a net loss of some $711,970 in 1HFY2022. Gross profit contracted 47.4% y-o-y to $0.2 million due to an increased use of external vendors as projects moved to physical live events, says the company. Cost of sales eased 4% y-o-y to $1.77 million in 1HFY2023, mainly due to lower artistes’ engagement fees. This was offset by higher production cost due to projects requiring the engagement of a higher proportion of external vendors as projects move from virtual to physical live events. Loss per share deepened to 1.26 cents in 1HFY2023 from 0.46 cents a year ago.
CFM Holdings has reported earnings of $9.4 million for the 1HFY2023 ended Dec 31, 2022, 31.7 times higher than the earnings of $296,000 in the same period the year before. The growth was due to the surge in other income, which stood at $8.4 million, up from the $320,000 in the same period the year before. Other income surged mainly due to the disposal of non-current asset held for sale of $8.13 million. This was offset by a drop in rental income of $33,000 and a miscellaneous income of $40,000. Revenue for the period grew by 14.6% y-o-y to $14.1 million due to a ramp up in orders from the group’s metal stamping segment. Earnings per share (EPS) stood at 4.66 cents on a diluted basis.
US
U.S. inflation moderated in January from historic highs but the pace of easing showed signs of leveling off. The consumer-price index, a closely watched measure of inflation, climbed 6.4% in January from a year earlier, down from 6.5% in December, the Labor Department said Tuesday. Core inflation, which strips out volatile food and energy prices, rose 5.6% in January from a year earlier, more than economists expected. Economists had expected overall consumer prices to increase 6.2% in January from a year earlier, and the core index to rise 5.5%. Rising shelter costs accounted for about half the monthly increase, the Bureau of Labor Statistics said in the report. The component accounts for more than one-third of the index and rose 0.7% on the month and was up 7.9% from a year ago. Energy also was a significant contributor, up 2% and 8.7%, respectively, while food costs rose 0.5% and 10.1%, respectively.
Coca-Cola on Tuesday reported quarterly revenue that beat analysts’ expectations, driven by higher prices on its drinks. But those higher prices have hurt demand for Coke products like Simply Orange Juice and Fairlife Milk. Coke said its unit case volume, which strips out the impact of currency and price changes, fell 1% in its fourth quarter. The beverage giant reported fourth-quarter net income attributable to the company of $2.03 billion, or 47 cents per share, down from $2.41 billion, or 56 cents per share, a year earlier. Excluding an impairment charge tied to its Russian business and other items, Coke earned 45 cents per share. Net sales rose 7% to $10.13 billion, driven by 12% growth in pricing and a more expensive mix of drinks sold. For 2023, Coke projects comparable revenue growth of 3% to 5% and comparable earnings per share growth of 4% to 5%.
Airbnb released fourth-quarter earnings that beat analysts’ estimates on top and bottom lines. Revenue for the fourth quarter was up 24% year over year. The company reported $319 million in net income for the quarter, up from $55 million a year earlier, and adjusted EBITDA of $506 million, surpassing the $432 million expected by analysts. In its shareholder letter, Airbnb said it’s seeing continued strong demand at the start of 2023. The company said revenue in the first quarter will be between $1.75 billion and $1.82 billion, above the $1.69 billion expected by analysts. Airbnb said it made difficult choices to cut spending during the pandemic but has modestly increased its head count over the past two years. The company said it expects to “continue hiring at a judicious pace in 2023” and that compared with 2019 its head count is down 5% while revenue is up 75%. Airbnb said guest demand and supply growth remained strong throughout 2022.
Marriott International Inc. said travel demand is holding up so far this year despite higher room rates, as tourists, business travelers and groups continue to flock to its hotels. The hotel operator on Tuesday said fourth-quarter revenue rose by a third, and it issued upbeat guidance for this year as the recovery of cross-border travel, the reopening of China and recovery of business trips are expected to sustain demand. CEO Tony Capuano said that demand for leisure travel in the U.S. and Canada—the company’s biggest market—held strong, and group travel topped prepandemic levels. Demand for business travel, which has been slower to return, was nearly 90% recovered to prepandemic levels in the U.S. and Canada as companies sent their employees on the road once again. Chief Financial Officer Leeny Oberg said that overall demand for business travel is trending positively this year, even amid layoffs and belt-tightening in some sectors such as technology. For the recently ended quarter, the company said average room rates were 13% higher than prepandemic levels. Revenue at the company came to $5.92 billion for the quarter ended Dec. 31, topping the $5.37 billion expected by Wall Street. Net income rose to $673 million, or $2.12 a share, from $468 million, or $1.42 a share, in the same period a year earlier. Adjusted earnings came to $1.96 a share, ahead of analyst expectations for $1.83 a share. The company also said it expects full-year adjusted earnings of $7.23 a share to $7.91 a share. Wall Street was expecting adjusted earnings of $7.44 a share.
Boeing said on Tuesday (Feb 14) it had delivered 38 airplanes in January, a modest improvement from a year earlier, including 35 of its bestselling 737 MAX single-aisle jets and three wide body 787 Dreamliners. The US plane-maker outperformed European rival Airbus, which delivered only 20 aircraft last month – a one third drop from January 2022. Boeing executives, however, have stressed that the pace of deliveries will vary from month to month, dampening expectations that it would stay on the same trajectory in February. Boeing logged 55 gross orders in January, netting orders for 16 new planes after 39 cancellations. The company’s backlog increased from 4,578 to 4,585 orders.
Automaker Ford on Tuesday said it intends to cut 3,800 jobs in Europe over the next three years to adopt a “leaner” structure as it focuses on electric vehicle production. The company plans to slash 2,300 jobs in production development and administration in Germany, 1,300 in the U.K. and 200 posts elsewhere in Europe. It said it will retain roughly 3,400 engineering roles in Europe, focused on vehicle design and development, alongside the creation of linked services. The automaker said it employs approximately 34,000 people in Europe. The overhaul will not affect Ford’s aim to offer an all-electric fleet by 2035. The company expects production of its first European-built electric passenger vehicle to start later this year.
Source: SGX Masnet, Bloomberg, Channel NewsAsia, Reuters, CNBC, WSJ, The Business Times, PSR
RESEARCH REPORTS
Singapore Strategy Budget 2023 – Moving forward socially and competitively
Analyst: Paul Chew
– FY2022 overall fiscal deficit was S$2bn (0.3% of GDP), below the estimated S$5bn (or 0.9% of GDP). FY2023 is more balanced with a modest deficit of S$0.4bn (or 0.1% of GDP).
– Huge support for households to cope with inflation via a S$3bn increase in Assurance Package (AP) to S$9.6bn and an additional $300mn in the GST Voucher scheme. Another major area of support for households was an increase in grants for first-time families purchasing resale HDB flat by S$10k and S$30k.
– The support for households to cope with the rise in inflation is a positive fiscal boost for the economy. Another benefit to the economy will be the additional funds to promote investments and competitiveness via the National Productivity Fund. This will be the 3rd consecutive overall fiscal budget deficit totalling S$7.34bn. There may be less opportunity for deficit as a balanced budget must be maintained over each term of Government.
DBS Group Holdings Ltd – Surge in net interest and other non-interest income
Recommendation: Buy (Maintained), Last done: S$35.13
TP: S$41.60, Analyst: Glenn Thum
– 4Q22 earnings of S$2.34bn were above our estimates due to higher net interest income (NII) slightly offset by lower fee income. FY22 PATMI is 104% of our FY22e forecast. 4Q22 DPS was up 17% YoY to 42 cents with an additional special dividend of 50 cents; full-year FY22 dividend rose 67% YoY to 200 cents.
– NII surged 53% YoY to S$3.28bn on NIM expansion of 62bps to 2.05% despite flat loan growth of 1% YoY. Fee income fell 19% YoY due to weaker market sentiment, while other non-interest income surged 119% YoY. 4Q22 ROE increased 7.3% points YoY to 17.2%.
– Maintain BUY with an unchanged target price of S$41.60. We lower FY23e earnings by 3% as we lower NII estimates for FY23e due to lower loans growth, offset slightly by higher fee and other non-interest income. We assume 1.88x FY23e P/BV and ROE estimate of 16.5% in our GGM valuation. Expect another two quarters of strong NII growth. 1H22 NIM was only 1.52% compared to 4Q22’s 2.05%.
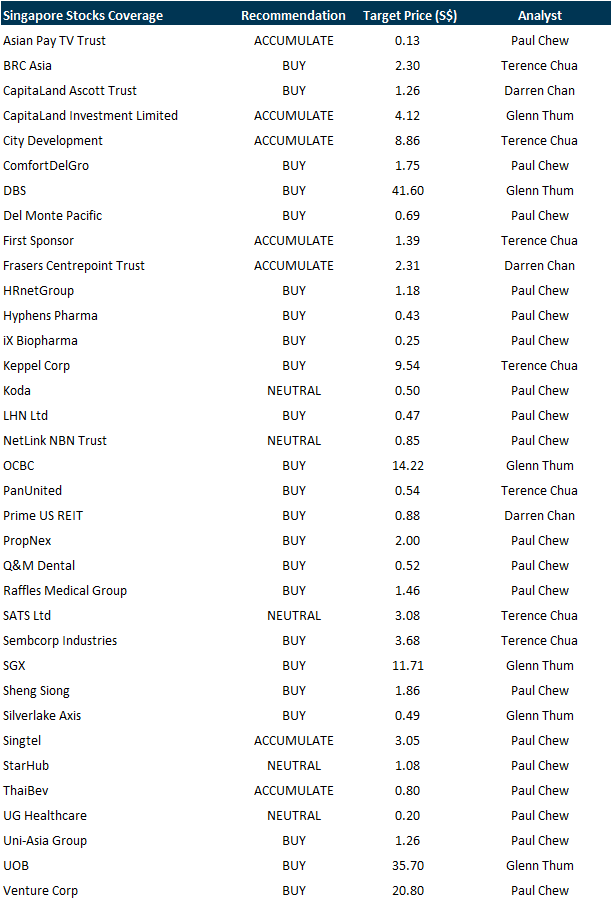
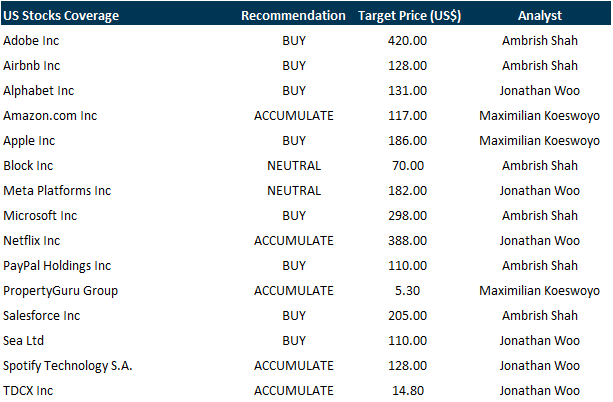
PSR Stocks Coverage
For more information, please visit:
Upcoming Webinars
Guest Presentation by Paragon REIT [NEW]
Date: 17 February 2023
Time: 12pm – 1pm
Register: https://bit.ly/3ZNn4W0
Guest Presentation by Keppel DC REIT [NEW]
Date: 17 February 2023
Time: 3pm – 4pm
Register: https://bit.ly/3CYgrGr
Guest Presentation by First REIT Management Limited [NEW]
Date: 23 February 2023
Time: 12pm – 1pm
Register: https://bit.ly/3GY2tp8
POEMS Podcast:


Research Videos
Weekly Market Outlook: Alphabet Inc, Amazon Inc, SGX, Starhub Ltd, Tech Analysis & More
Date: 13 February 2023
Click here for more on Market Outlook.
Sign up for our webinars here, and be among the first to receive economy and market updates.
PHILLIP RESEARCH IN 3 MINS
Phillip Research in 3 minutes: #29 Keppel Corporation; Initiation
Click here for more on Phillip in 3 mins.
Join our Singapore Equity Research Community on POEMS Mobile 3 App for the latest research reports, market updates, insights and more

Disclaimer
The information contained in this email and/or its attachment(s) is provided to you for information only and is not intended to or nor will it create/induce the creation of any binding legal relations. The information or opinions provided in this email do not constitute an investment advice, an offer or solicitation to subscribe for, purchase or sell the e investment product(s) mentioned herein. It does not have any regard to your specific investment objectives, financial situation and any of your particular needs. Accordingly, no warranty whatsoever is given and no liability whatsoever is accepted for any loss arising whether directly or indirectly as a result of this information. Investments are subject to investment risks including possible loss of the principal amount invested. The value of the product and the income from them may fall as well as rise. You may wish to seek advice from an independent financial adviser before making a commitment to purchase or investing in the investment product(s) mentioned herein. In the event that you choose not to do so, you should consider whether the investment product(s) mentioned herein is suitable for you. PhillipCapital and any of its members will not, in any event, be liable to you for any direct/indirect or any other damages of any kind arising from or in connection with your reliance on any information in and/or materials attached to this email. The information and/or materials provided 揳s is?without warranty of any kind, either express or implied. In particular, no warranty regarding accuracy or fitness for a purpose is given in connection with such information and materials.
Confidentiality Note
This e-mail and its attachment(s) may contain privileged or confidential information, which is intended only for the use of the recipient(s) named above. If you have received this message in error, please notify the sender immediately and delete all copies of it. If you are not the intended recipient, you must not read, use, copy, store, disseminate and/or disclose to any person this email and any of its attachment(s). PhillipCapital and its members will not accept legal responsibility for the contents of this message. Thank you for your cooperation.

Follow our Socials