
Airbnb Inc - Rising above pre-pandemic levels
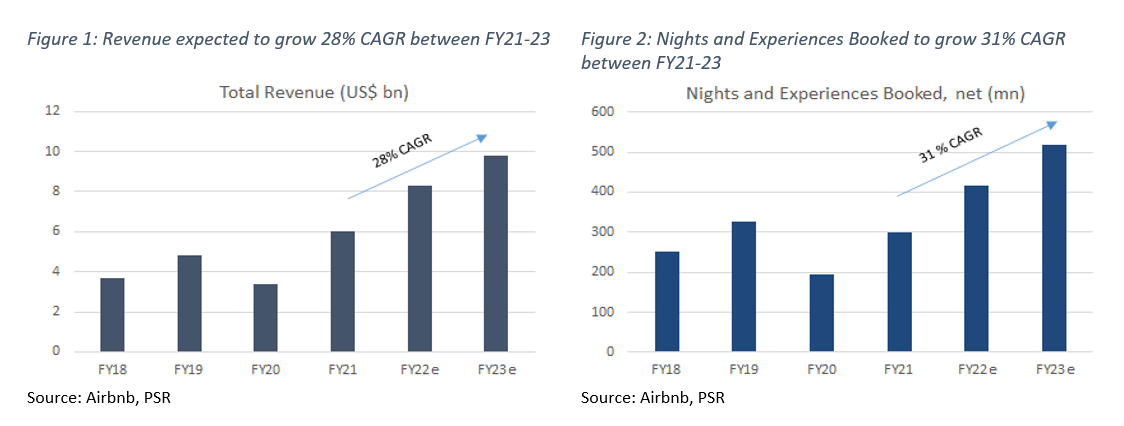
13 Jul 2022- Airbnb’s revenue is expected to grow 38% YoY to US$8.3bn in FY22e from pent-up demand for travel and the acceleration of the shift to remote work. We expect the company to report a maiden net profit of US$1.4bn.
- We are modelling a 39% YoY rebound in Airbnb’s bookings volume to 417mn in FY22e, which is 28% ahead of FY19 levels. 1Q22 bookings spiked 59% YoY. Online travel peers Booking and Expedia are still working their way back to pre-pandemic levels. Airbnb’s outperformance is due to its status as the leading player in the short-term rental market, attracting and retaining a unique base of supply, and continued adoption of alternative accommodations.
- We initiate coverage with a BUY recommendation and DCF-based target price (WACC 6.8%) of US$119.
Company Background
Airbnb (ABNB) is the leading marketplace for people to list, discover and book private or shared alternative accommodation. Its platform connects guests and hosts online to book unique places to stay and for experiences. Airbnb offers 6mn active listings from over 4mn hosts across 220 countries.
Investment Merits
- Surging volume of room nights and experiences. Airbnb is recovering faster from the pandemic-driven drop as travel restrictions continue to ease. In FY21, the company reported 301mn room nights and experiences booked, just 8% below the FY19 levels. Online peers Booking and Expedia are still 30% and 40% below pre-COVID levels in FY21. We expect the number of nights booked to accelerate in FY22e with Airbnb reaching an all-time high of 417mn nights and experiences booked, which is 28% ahead of pre-pandemic levels. Airbnb’s outperformance is mainly due to its status as the leading player in the short-term rental market, attracting and retaining a unique base of supply, and increased consumer spending on alternative accommodation.
- Pent-up demand for travel is leading to rising prices or daily rates. In FY21, gross bookings value jumped 96% YoY to US$46.9bn, surpassing FY19 levels by 23%. This is driven by robust improvement in booking volume and higher average daily rates (ADR). Airbnb’s ADR grew 26% YoY to US$156 in FY21 due to price appreciation and business mix shift towards bookings in North America. We expect Airbnb’s revenue to increase 38% YoY to US$8.3bn in FY22e. The growth will be driven by urban and cross border travel, growth in longer-term stays, and broadening of desirable travel destinations.
- Airbnb continues to innovate the platform. Airbnb has differentiated itself from the competition by continuously releasing product upgrades on the platform. In FY21, the company released more than 150 upgrades to its platform, including streamlined onboarding, flexible-date search tools for guests, AirCover, and dedicated SuperHost support for hosts (Ask a Superhost). We believe product innovation improves the overall user experience and higher retention of Airbnb guests and hosts. In FY21, Airbnb spend 24% of revenue on product development, largely outperforming its peers. Booking and Expedia’s spend on product development ranges from 4% to 12%.
We initiate coverage with a BUY rating. Our target price is US$119 based on a DCF valuation with a WACC of 6.8% and terminal growth of 4.0%.
REVENUE
Airbnb’s revenue mainly comes from nights and experiences booked on its platform. For stays, customers (hosts and guests) are charged service fees as a percentage of the booking value, excluding taxes. Service fees vary depending on factors such as booking value, duration of stay, host type, and geography. For experiences, service fees are levied on hosts only. Total revenue expanded at 24% CAGR in the past four years (Figure 1) to US$6.0bn in FY21. Over FY18-21, Airbnb’s nights and experiences booked rose at a CAGR of 13% to 300.6mn in FY21 (Figure 2). The growth was mainly driven by travel demand recovery and alternative accommodation market share gains.
GEOGRAPHIC MIX
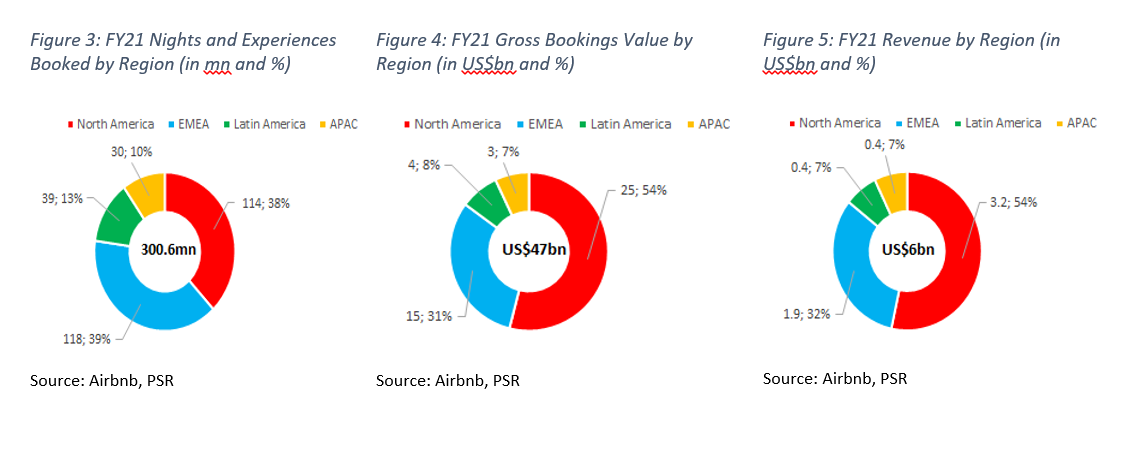
Airbnb’s business is geographically diversified with nearly half of its revenue from outside the US. In FY21, North America accounted for 38% of nights and experiences booked (Figure 3), and 54% of gross bookings value (Figure 4) and total revenue (Figure 5). North America held up the best through the COVID-19 pandemic, with nights and experiences booked only falling 21% YoY in 2020 compared with EMEA and Latin America which fell above 50%.
EXPENSES
Cost of sales expanded at a 16% CAGR in the past four years, compared with operating expenses growth of 22%. Operating expenses include operations and support (14% of FY21 revenue); product development (24%); sales and marketing (20%); and general and administrative (14%) costs. Total operating expenses as a percentage of revenue have reduced modestly from 78% in FY17 to 74% in FY21. We expect operating expenses as a percentage of revenue to be 62% in FY22e due to increased efficiency and lower product development costs.
MARGINS
Gross margins hit an all-time high of 81% in FY21, up by over 600 basis points (bps) from FY20. This was mainly driven by Airbnb’s top-line recovery due to a surge in nights and experiences booked and a higher average daily rate (ADRs). In FY21, Airbnb’s ADR grew 26% YoY to US$156 due to price appreciation and a business mix shift towards bookings in North America.
Net margins remained negative for FY21 at -6% compared with -136% in FY20. This has been largely due to revenue recovery and a significantly improved cost structure. Product development expenses decreased by 48% YoY in FY21 to US$1.4bn. This was mainly due to a US$1.3bn decline in payroll-related expenses. We expect Airbnb to report a maiden net profit of US$1.4bn in FY22e. This translates to a 17% net profit margin.
BALANCE SHEET
Assets: In FY21, cash and cash equivalents increased by 11% YoY to US$6.1bn. Marketable securities also increased by US$1.3bn. Airbnb is an asset light business and doesn’t need to make heavy investments in fixed assets. In FY21, the company reported fixed assets of US$0.4bn. Airbnb’s current ratio for FY21 is 1.9x.
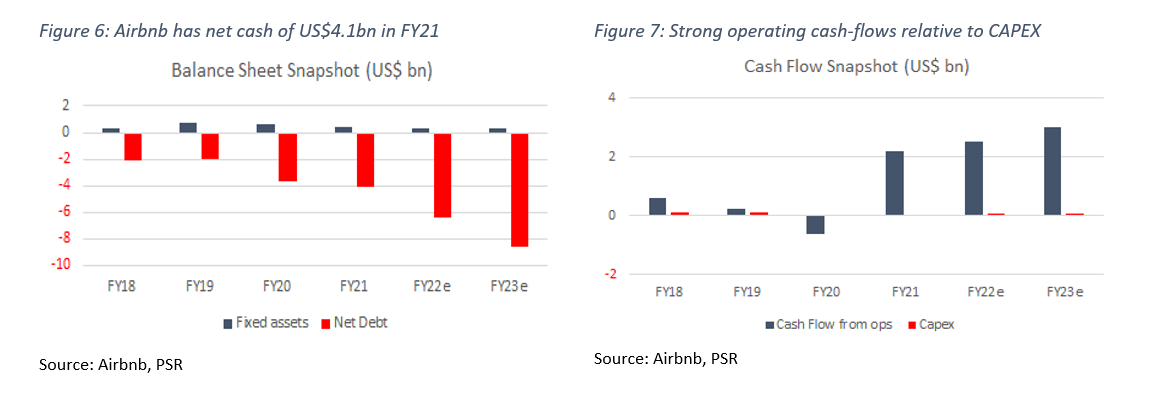
Liabilities: Current liabilities for FY21 were US$6.4bn, almost US$1.2bn more than FY20. This increase was mainly due to a rise in funds payable to customers. Non-current liabilities saw a jump of US$124mn in FY21. Airbnb had a net cash position of US$4.1bn in FY21 (Figure 6). Airbnb’s debt-to-equity ratio remains low at only 0.4x.
CASH-FLOW
Cash-flow from operations has steadily risen at 54% CAGR to US$2.2bn (Figure 7) from FY19 to FY21. Airbnb has almost insignificant CAPEX spending as the company doesn’t have to build or lease properties. In FY21, CAPEX stood at US$25mn. The company generated US$2.2bn in free cash flow in FY21. This translates to a 36% free cash flow margin.
BUSINESS MODEL
Airbnb generates revenue through service fees charged to guests and hosts. Airbnb service fees are applied to the booking subtotal (the rate per night plus cleaning fee and extra guest fee, if applicable, but excluding local occupancy taxes and Airbnb service fees). Host service fees are automatically deducted from the host payout. Airbnb offers two monetization models for accomodations and one for experiences (Figure 8).
- Split-fee on accomodations: Airbnb has a split-fee model for most accommodations hosts, in which hosts pay about 3% and guests pay less than 14.2%. This totals under 17.2% in take rate. These fees may vary depending on the duration of the stay, geography, and host type. Airbnb Plus hosts and those hosts with Super Strict cancellation policies may pay more.
- Host-only fee on accomodations: The host-only fee structure ranges from 14% to 16% and is mandatory for traditional hospitality listings like hotels and serviced apartments. It’s also mandatory for software-connected hosts (those who use a channel manager or property management system to connect their calendars to Airbnb), unless those hosts own the majority of their property listings in the US, Canada, Mexico, Bahamas, Taiwan, or Argentina.
- Experience fees: Airbnb Experiences are in-person or online activities led by local experts. An experience may be a local art lesson or an outdoor tour. Airbnb charges hosts a service fee of 20% for experiences. No fees are charged to guests for
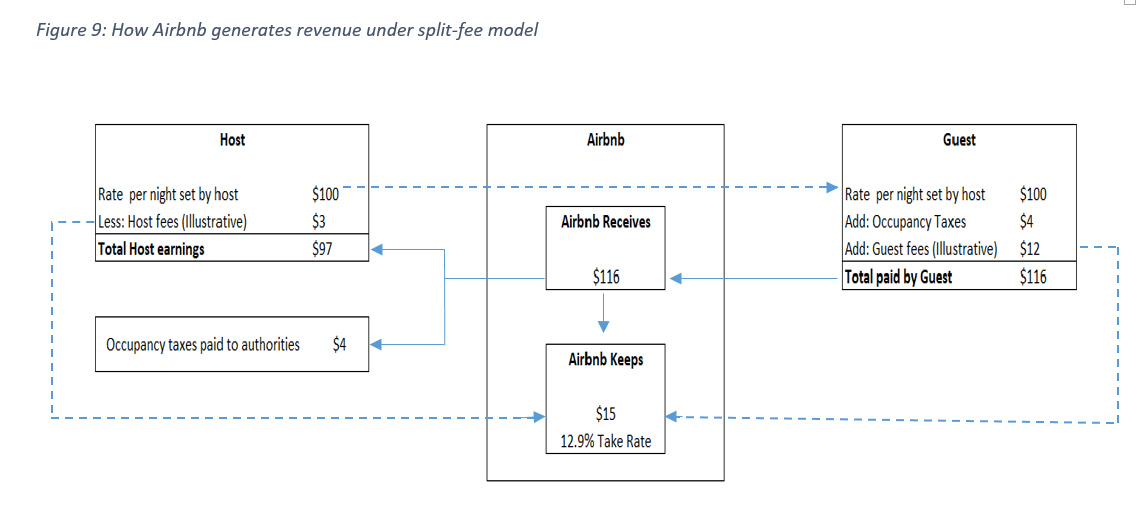
As shown in Figure 9 above, on a rental of US$100 per night set by the host, the guest pays US$116, which includes US$12 as guest fees and US$4 for taxes. Meanwhile, the host will make US$97 compared with the rate per night set at US$100 as Airbnb might collect US$3 hosting fee. Airbnb might make as much as US$15 (take rate of 13%), split between guest and host fees.
INDUSTRY
In 2020, the global tourism industry witnessed an unparalleled demand contraction, with March and April 2020 down 80% to 90% across all the travel industry segments and regions. This is mainly because countries worldwide implemented travel restrictions and other mandatory shutdowns to prevent the spread of the coronavirus. Since then, the travel demand recovery has been rocky and uneven due to fluctuations in COVID-19 case counts, lockdowns, and vaccination rates.
According to Statista, the global vacation rental industry’s total revenue is estimated to reach US$83bn in FY22, including US$18.6bn from the US. This hospitality segment is expected to rise at a CAGR of 6.3% between 2022 and 2026 to reach US$105.7bn, with 74% of that revenue generated through online sales. Additionally, the user penetration is expected to reach 11% by 2026 compared with 9% in 2022. The growth is mainly driven by significant pent-up demand to travel again.
Airbnb estimates its serviceable addressable market (SAM) to be US$1.5tn as of Dec. 2020, including US$1.2tn in short-term stays and US$239bn in experiences. Airbnb makes the following assumptions to determine the US$1.2tn for short-term stays (Figure 10):
- Euromonitor’s estimated 14.3bn overnight trips globally in 2019
- Airbnb estimates that 45% of the total trips are paid, resulting in 6.5bn paid overnight trips globally
- Airbnb further estimates that 6.5bn paid trips generate 11.8bn paid room nights
- The average daily rate (ADR) of US$105
11.8bn paid room nights at ADR of US$105 equals to US$1.2tn short-term rental SAM


 Apr 19th - Things to Know Before the Opening Bell
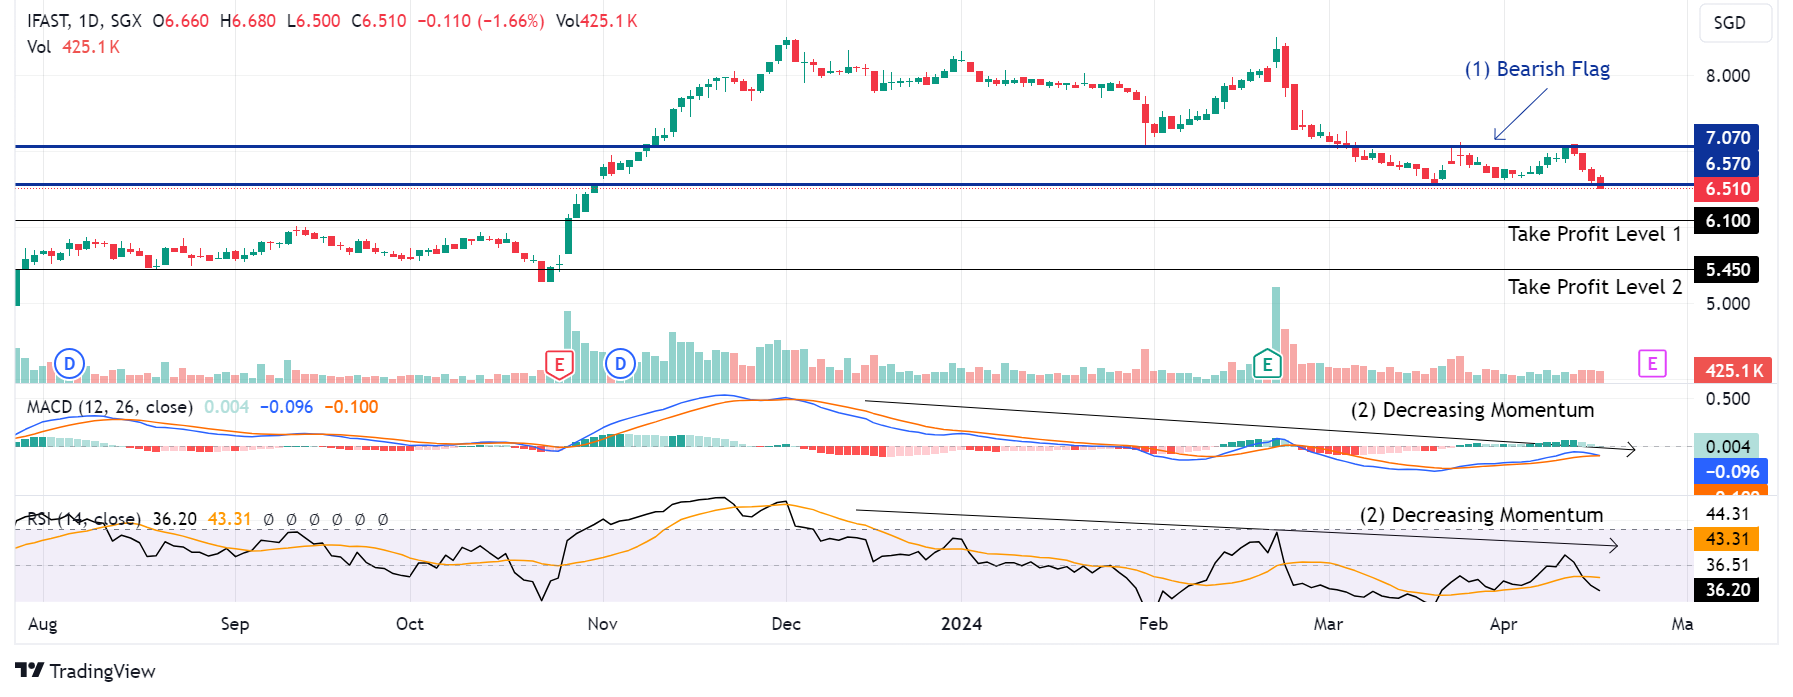 Trade of the Day - iFAST Corporation Ltd (SGX: AIY)
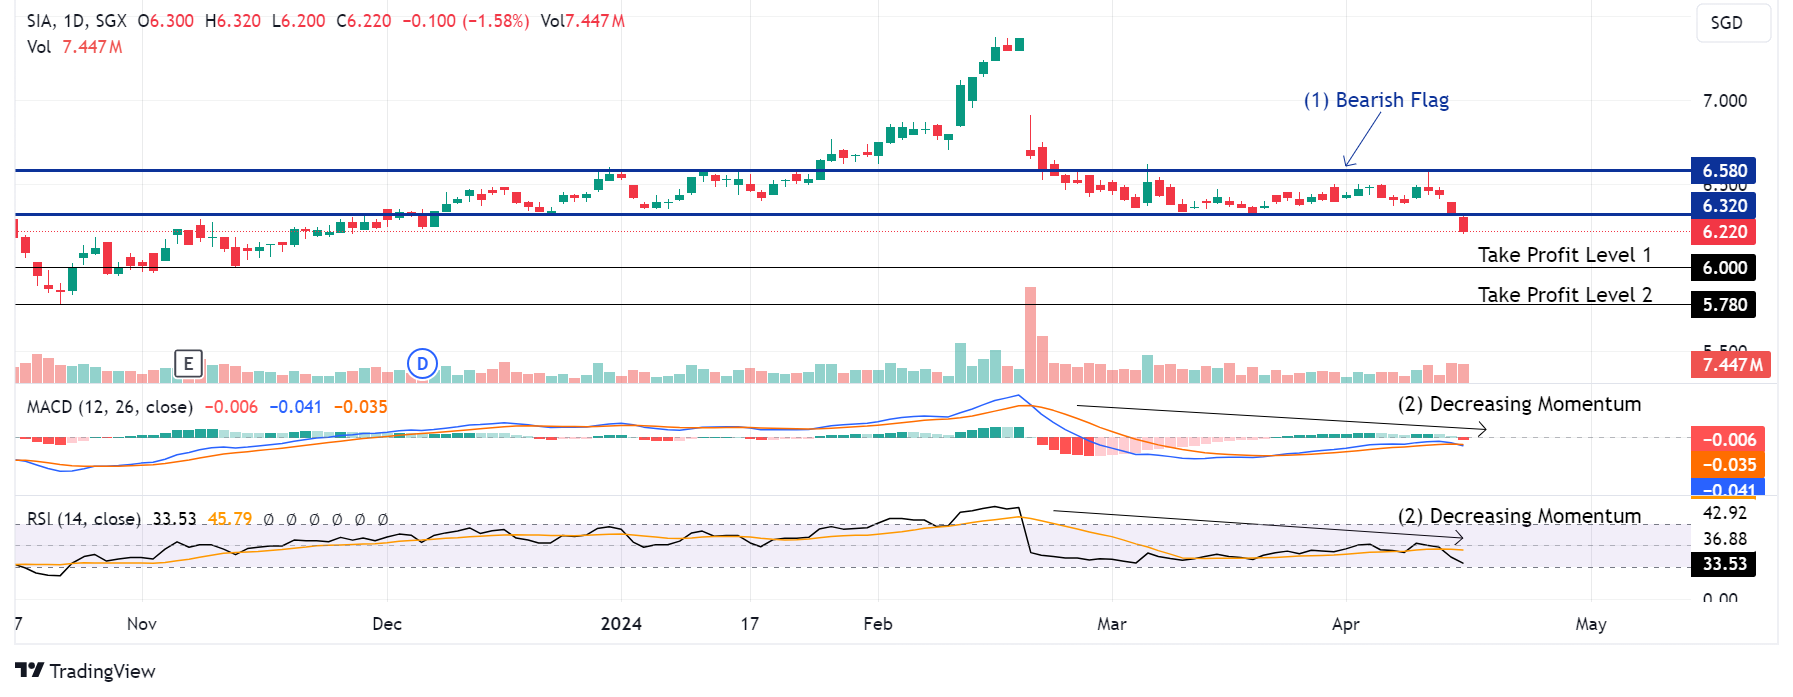 Trade of the Day - Singapore Airlines (SGX: C6L)
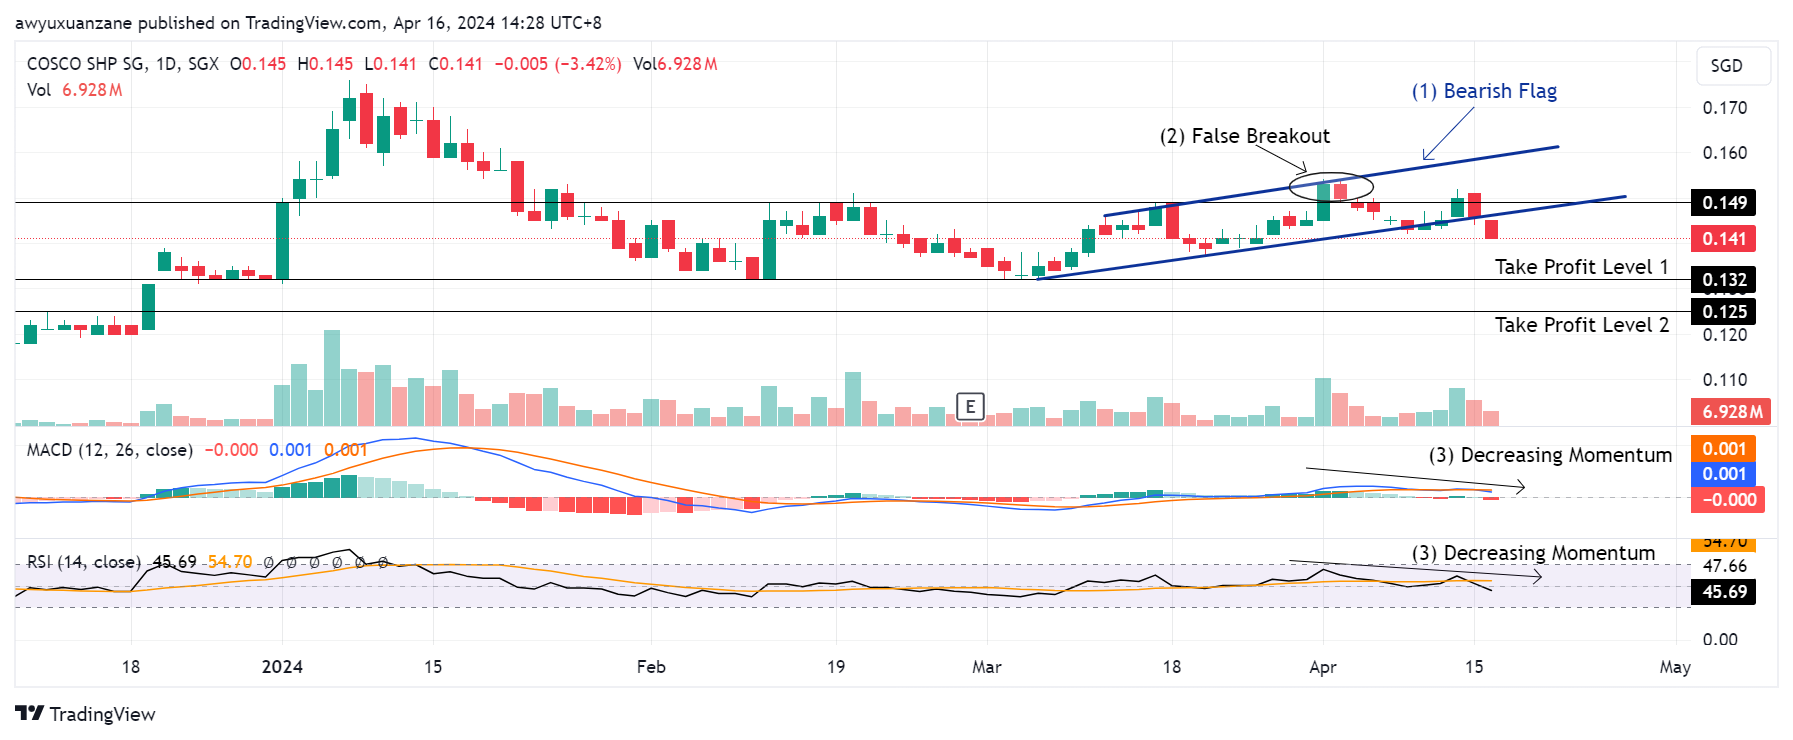 Trade of the Day - COSCO Shipping International (Singapore) Co Ltd (SGX: F83)