
Amazon.com Inc – Much more growth ahead
1 Oct 2021- Cloud services and advertising to spearhead secular tailwinds with expected revenue growth of 33% and 54% respectively in FY21e.
- Core e-commerce business rapidly scaling up fulfilment and logistics capabilities to further widen its moat. Fulfilment centre square footage is expected to jump 44%.
- Initiate coverage with a BUY recommendation and DCF target price (WACC 6.2%) of US$4,329.
Company Background
Amazon owns the leading e-commerce platform in the US, and the world’s largest cloud computing business – Amazon Web Services (AWS). Amazon’s online stores generated 51% of FY20 revenue, retail third-party seller services 21%, AWS 12%, retail subscription services 7%, advertising 6%, and physical stores 4%. The US (68% revenue) is Amazon’s biggest market, followed by Germany 8%, UK 7%, Japan 5%, and the rest of the world 12%.
Investment Merits
- More upside for Amazon Web Services (AWS). Public cloud penetration of IT budgets remains low at 4%. As more companies switch to cloud services to meet their IT needs, we expect Amazon’s cloud business to capture much of the growth. We believe AWS’ strength is its ability to execute, security and reliability while offering similar pricing compared to no. 2 Microsoft Azure (20% market share). As the largest player (32% market share), AWS has a greater ability to secure larger scale contracts, such as the multibillion-dollar Department of Defense contract awarded by April 2022. AWS is also scaling faster than competitors with the highest hyperscale data centre capex in the last four quarters. We expect AWS revenue growth of 33% in FY21e and margins of 32% to lift the bottom line significantly.
- Amazon advertising continues to take market share. Amazon’s first-party user data (data collected directly from Amazon.com) is unaffected by Apple’s new iOS 14 privacy update, which may adversely hurt Facebook ad effectiveness in targeting customers. In addition, Google intends to phase out third-party cookies on Chrome browsers by 2022, forcing marketers to instead rely on first-party data providers such as Amazon ads. Amazon is also expanding their ad capacity and services, recently doubling sponsored ads on web pages and adding video ads and sponsored brand posts. Advertising is Amazon’s fastest growing business with margins estimated to be above 50%. We expect Amazon’s ad revenue to grow 54% in FY21e as higher demand drive up prices, which rose 30% to over US$1.20 per-click since the beginning of 2021.
- Core e-commerce business expanding its moat. Fulfilment centre square footage is expected to jump 44% in the next few years to 578mn square feet as Amazon boosts capex. Stickiness with buyers and sellers keeps rising. Fulfilment by Amazon, Amazon’s logistics service, is a key reason why sellers choose to sell on Amazon. It fulfils orders for sellers, allowing them to scale quickly, save time, and enjoy a wide regional reach with ease of use compared to using multiple delivery carriers. For buyers, Amazon Prime members, a gauge of recurring Amazon shoppers, is expected to top 153mn this year (about 63% of total US households) as more regions offer free 1 to 2-day shipping for Amazon Prime. We expect Amazon’s gross merchandise value growth to continue to outpace US retail market growth, with Amazon’s e-commerce market share increasing.
We initiate coverage with a BUY rating. Our target price is US$4,329 based on DCF valuation with a WACC of 6.2% and terminal growth of 5%.
REVENUE
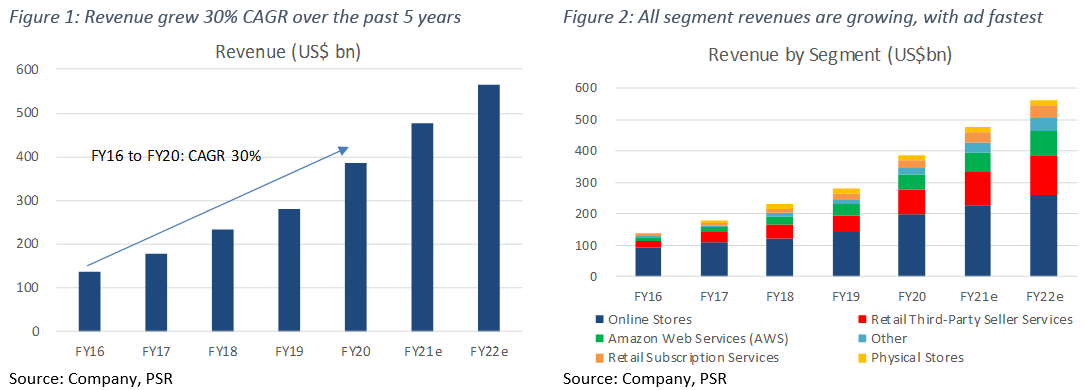
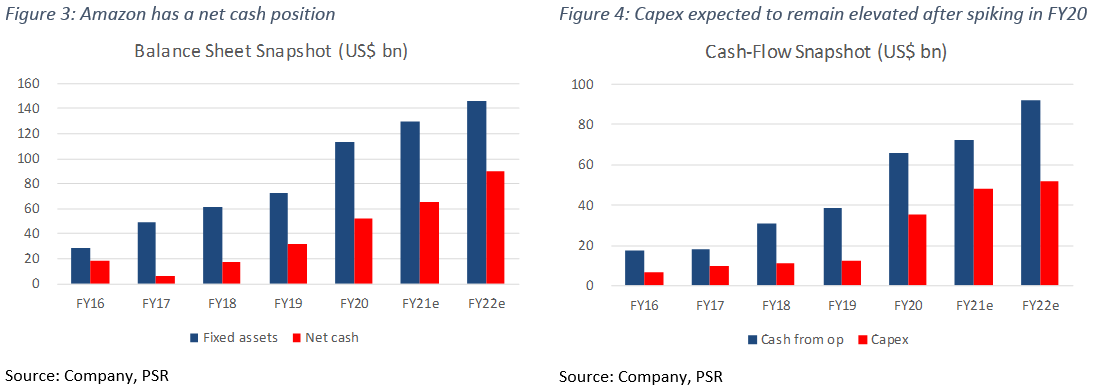
Amazon has six sources of revenue: online stores (51% of FY20 revenue), retail third-party seller services (21%), Amazon Web Services (12%), retail subscription services (7%), other – ads (6%), and physical stores (4%). The US (68% of FY20 revenue) is Amazon’s biggest market, followed by Germany (8%), the UK (7%), Japan (5%), and the rest of the world (12%). Total revenue has expanded at 30% CAGR over the past 5 years, riding on the growth of e-commerce, cloud, and digital ad markets, where Amazon holds leadership ranks.
Advertising is Amazon’s fastest growing segment, which makes up 90% of ‘other’ revenue. It grew 66% CAGR from FY15 to FY20 and is expected to grow 53% in FY21. We expect AWS to emerge as the second fastest grower at 33% in FY21 as revenue from online stores and retail third-party seller services normalise after spiking from the onset of COVID-19.
EXPENSES
Cost of sales grew at 20% CAGR in the past five years, compared to revenue growth of 30%. Operating expenses grew more in line at 28% CAGR. Operating expenses include fulfilment (15% of FY20 revenue), technology & content (11%), marketing (6%) and general & administrative (2%) costs. Technology & content, marketing, and general & administrative costs have remained in stable ranges of 11.1% to 12.8%, 5.3% to 6.7%, and 1.7% to 2.1% of revenue respectively. However, fulfilment costs have risen from 13.0% to 15.2% due to fulfilment network expansion, higher staff costs and COVID-19 productivity reduction.
MARGINS
Operating margins have gradually risen from 3% to 6% from FY16 to FY20. AWS and advertising are Amazon’s main sources of operating income and margins. AWS operating margins are at 30%, up from 25%, while advertising margins are estimated to be higher than 50%, in line with other large pure-play digital ad companies. We estimate the retail business (merchandise sales) to operate at a negative 0.4% operating margin.
BALANCE SHEET
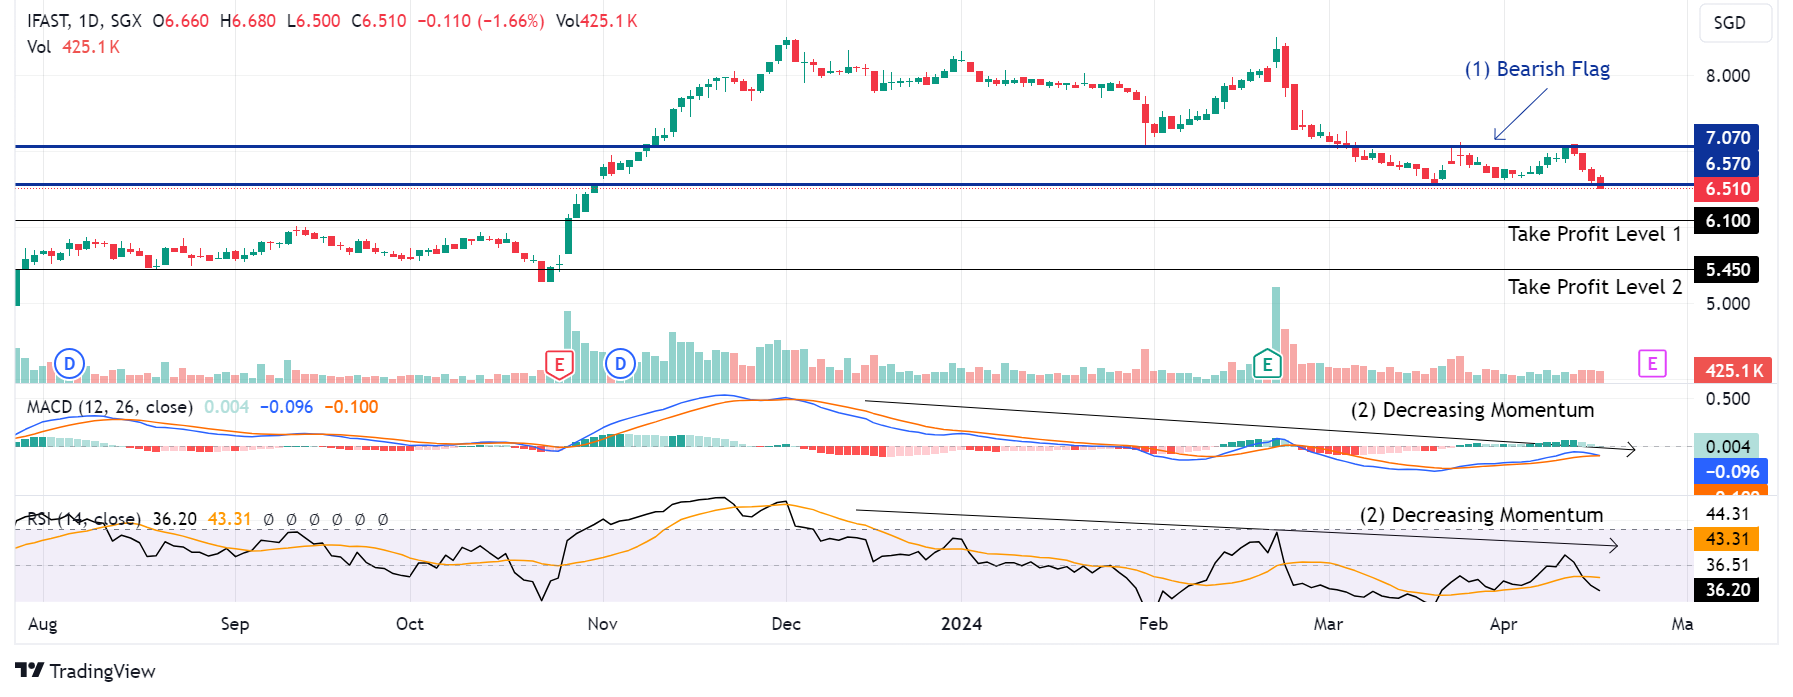
Assets: Fixed assets have grown by four times to US$113bn in the last five years as Amazon expanded its network of fulfilment warehouses and data centres. It spiked 56% in 2020 as Amazon accelerated fulfilment capacity to meet pandemic demand for online sales. Fixed assets made up 35% of total assets, and is expected to grow an additional 15% in 2021.
Liabilities: Amazon has a net cash position of US$53bn, which grew at 30% CAGR from US$18bn in the past five years (Figure 3).
CASH-FLOW
Cash-flow from operations spiked 72% YoY to US$66bn in FY20 from increased profitability during the pandemic, while capex almost tripled YoY to US$35bn from aggressive expansion (Figure 4). Capex as a % of operating cash-flow is expected to remain above 50% compared to the pre-pandemic average of 41% as Amazon continues to expand fulfilment and AWS capacity


 Trade of the Day - iFAST Corporation Ltd (SGX: AIY)
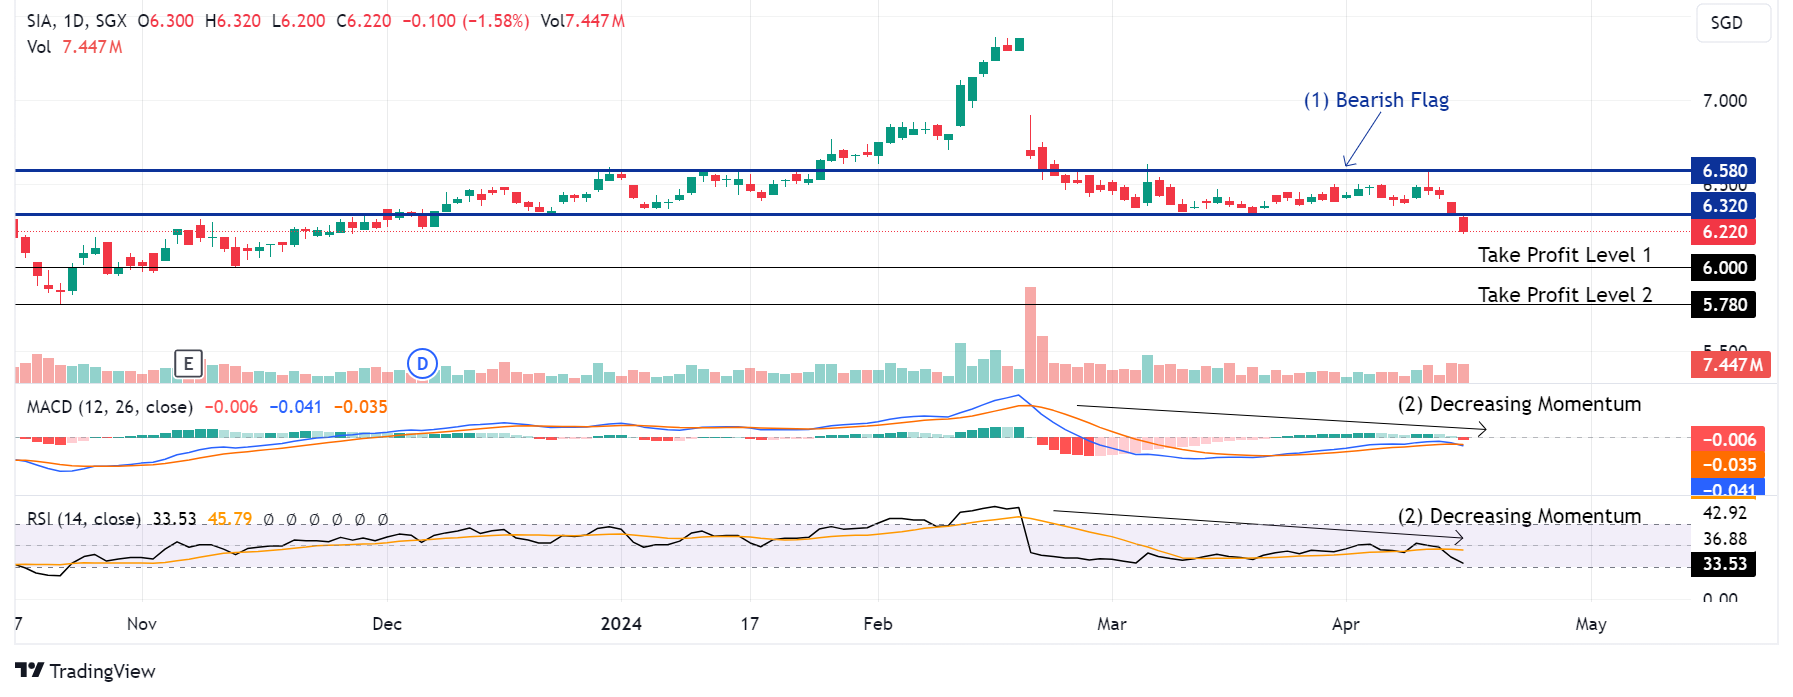 Trade of the Day - Singapore Airlines (SGX: C6L)
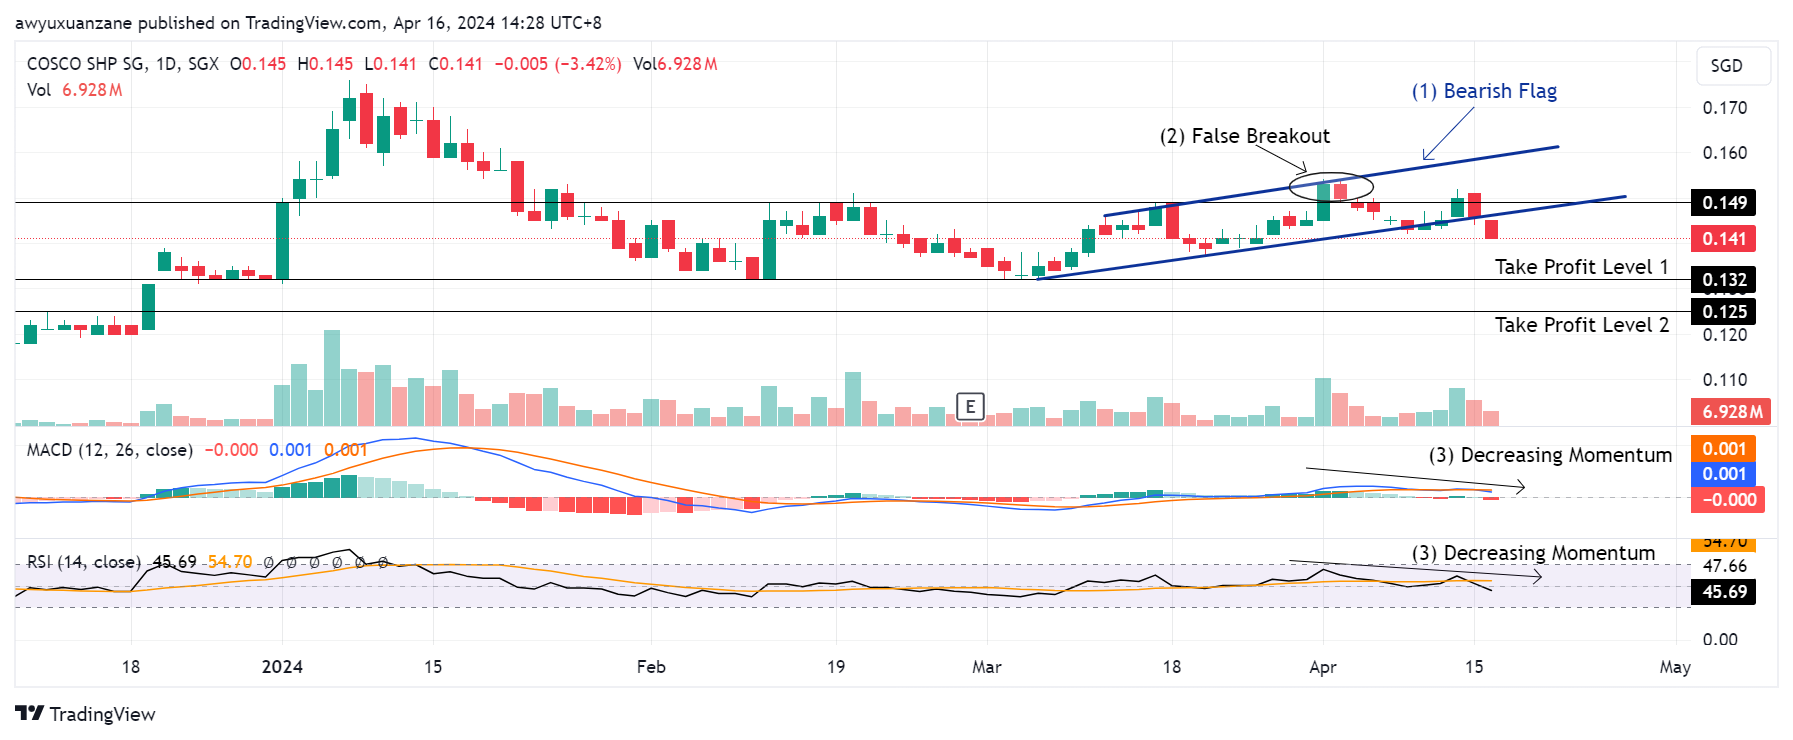 Trade of the Day - COSCO Shipping International (Singapore) Co Ltd (SGX: F83)
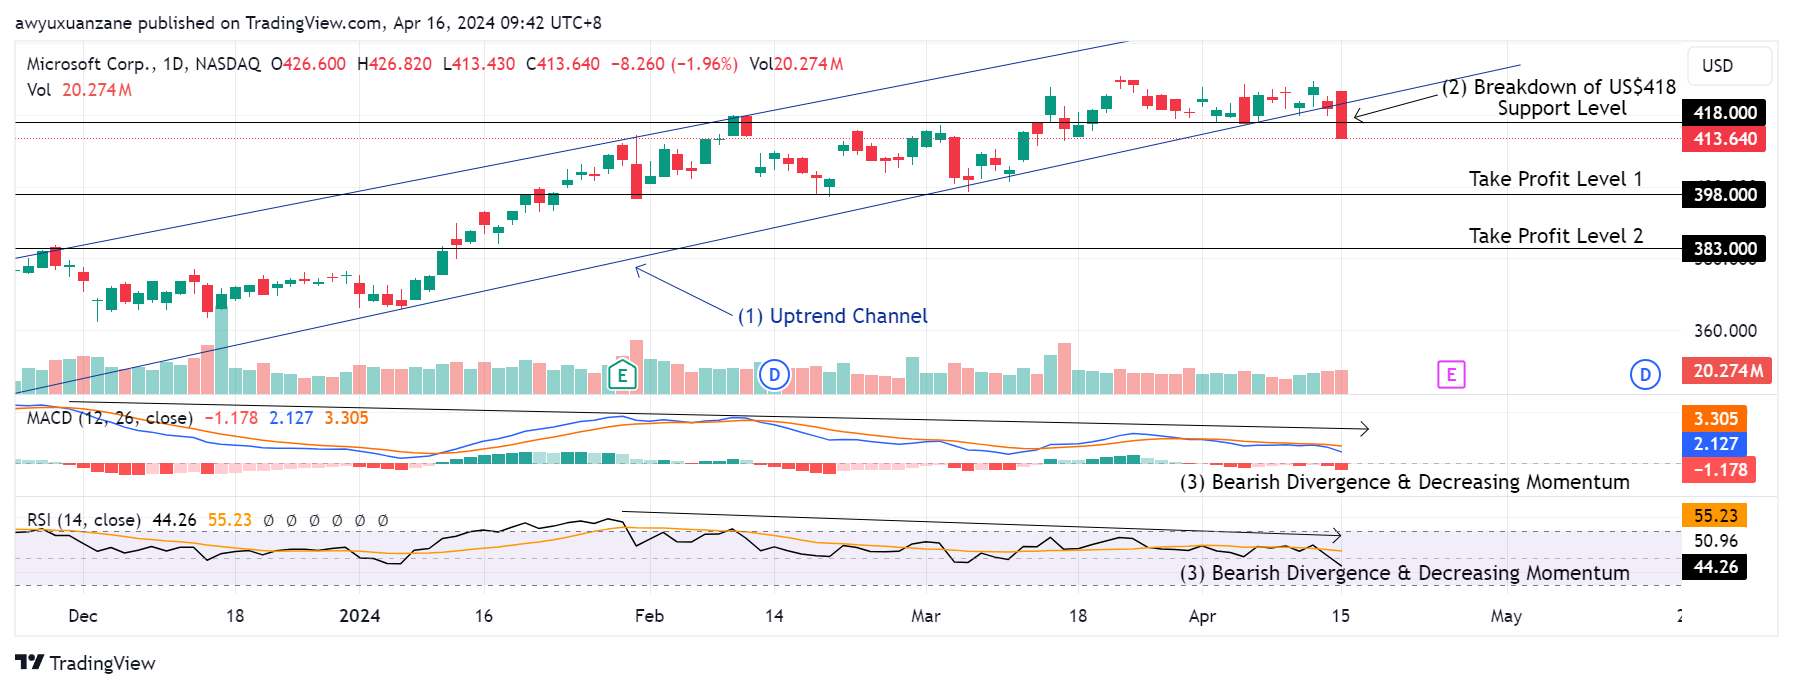 Trade of the Day - Microsoft Corp (NASDAQ: MSFT)