
Sea Ltd – Expanding global e-commerce footprint
22 Mar 2022- Shopee to drive revenue growth with CAGR of 62% expected over the next two years. Foothold in Southeast Asia to strengthen together with penetration into Brazilian market.
- Rapid expansion of SeaMoney as an additional growth driver, drawing on synergies with Shopee for frictionless transactions; segment revenue expected to grow 5x by FY23e.
- Profitability of SE’s digital entertainment business concentrated on a single product, heavy reliance on equity markets for funding through convertible notes.
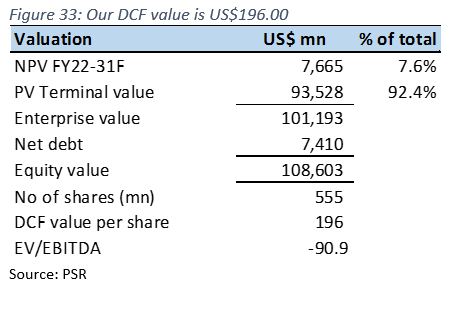
- Initiate coverage with a BUY recommendation and DCF-based target price (WACC 6.9%, g 4.0%) of US$196.00.
Company Background
Sea Ltd. operates as a holding company with subsidiaries operating in digital entertainment (Garena, 43% revenue), e-commerce (Shopee, 52%), digital financial services (SeaMoney).
Investment Highlights
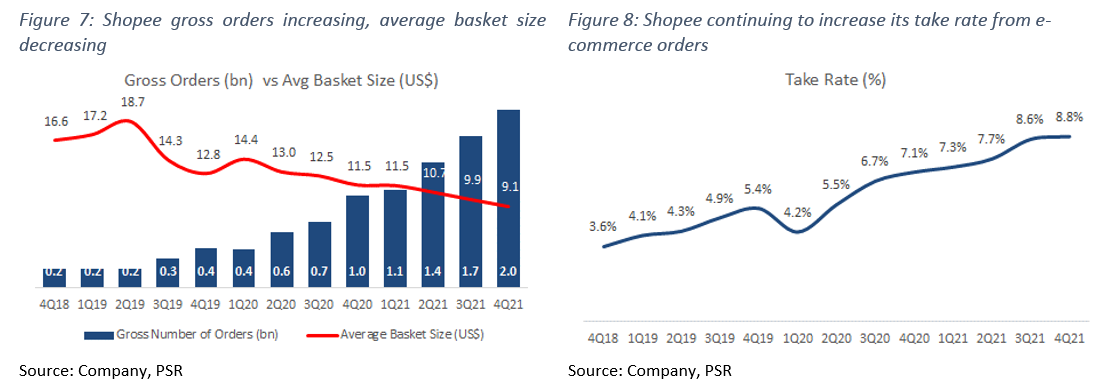
- Shopee’s high growth rate supported by uptick in both Gross Merchandise Value (GMV) and Gross Orders. E-commerce revenue from Shopee grew 130% YoY in FY21, supported by 118%/77% YoY increases in Gross Orders/GMV respectively – outpacing its main competitor Lazada (40% YoY). Shopee, which contributes almost 52% of SE’s total revenue, has consistently been top of its shopping category in Southeast Asia and Taiwan – monthly active users, and total time spent on the platform. We expect revenue from Shopee to more than double by the end of FY23e, as it expands its global footprint, and continues riding on a fast growing Southeast Asian e-commerce industry.
- Shopee’s expansion into Brazil showing great potential. Shopee’s strategic expansion into the world’s 6th most populated market has seen tremendous uptick, with 400% YoY revenue growth in 4Q21. Shopee Brazil also continues to be ranked at or near the top of its shopping category. With a profitability model that is well proven in the LATAM region – take rates of existing profitable players at ~18% vs ~8% in Southeast Asia, we think this expansion should contribute significantly to the overall profitability of SE’s e-commerce segment sooner rather than later.
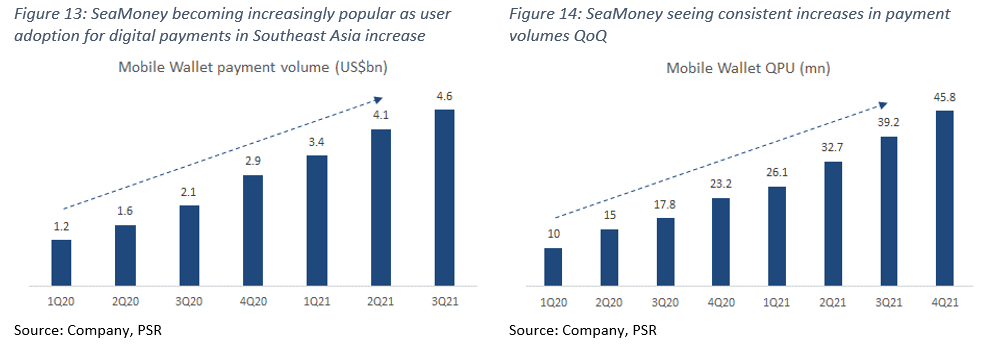
- Rapid expansion of SE’s Digital Financial Services (SeaMoney). SeaMoney saw rapid YoY revenue growth of 673% in FY21, supported by expanding product offerings, and increasing user base and payment volumes. It contributed almost 5% of SE’s total revenue in FY21, compared with only 1% in FY20, with this number expected to increase. We view SeaMoney as a natural extension of SE’s e-commerce business and expect synergies between both business segments as they grow in tandem, and forecast revenue to grow 5x by the end of FY23e.
Risks
- Profitability concentrated in Free Fire. The majority of SE’s digital entertainment revenue comes from its most popular in-house developed game, “Free Fire”, which we view to be somewhat concerning as Garena’s revenue could be significantly impacted if the growth and popularity of Free Fire were to decline moving forward. We expect Garena’s revenue to contract by about 12% YoY in FY22e due to a recent ban on Free Fire downloads in India and a moderation in online activity globally.
- Reliance on equity markets for funding. SEA has been very reliant on raising funds via convertible notes and common stock, with almost US$10bn raised so far. Poor conditions in equity markets may result in difficulty raising more funds through these methods in the future, which could affect SE’s growth plans moving forward.
We Initiate coverage with a BUY rating and a target price of US$196.00 based on DCF valuation, with a WACC of 6.9% and terminal growth of 4%.
REVENUE
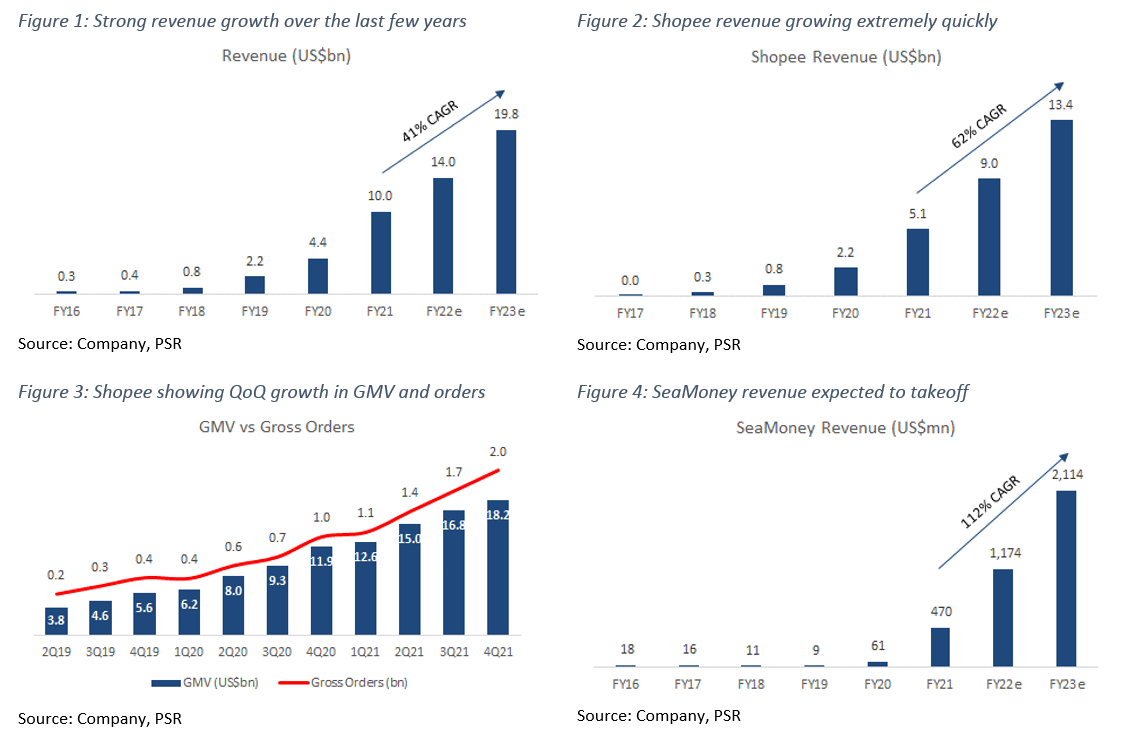
SE posted US$10bn in revenue for FY21 – increasing 128% YoY, with 51.5% of its total revenue coming from its e-commerce business (Shopee); 43.4% from its Digital Entertainment segment (Garena); 4.7% from its Digital Financial Services segment (SeaMoney), and the remaining 0.4% from other services (Figure 5).
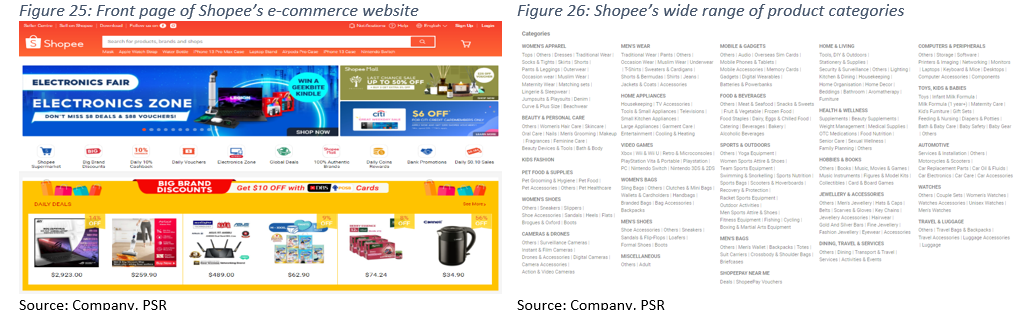
E-commerce (Shopee): Shopee is a mobile-centric, highly scalable, social-focused marketplace platform that connects both buyers, as well as sellers. The platform also provides its own integrated payment and logistics infrastructure, as well as comprehensive services aimed at empowering sellers with the appropriate tools to better engage with buyers. Shopee generates revenue by: 1) selling paid advertising services; 2) charging transaction-based fees; 3) charging sellers for certain value-added services; and 4) direct sales of certain products to consumers. It is also the largest e-commerce platform in the Southeast Asian region by Gross Merchandise Value (GMV), and total orders.
According to data.ai, in 4Q21 and FY21, Shopee continued to top its shopping category in Southeast Asia and Taiwan by average monthly active users and total time spent in the app. Shopee also topped its shopping category in Brazil for most downloads and total time spent in the app, while ranking second for average monthly active users. Globally, Shopee was the top ranked app in the shopping category by downloads.
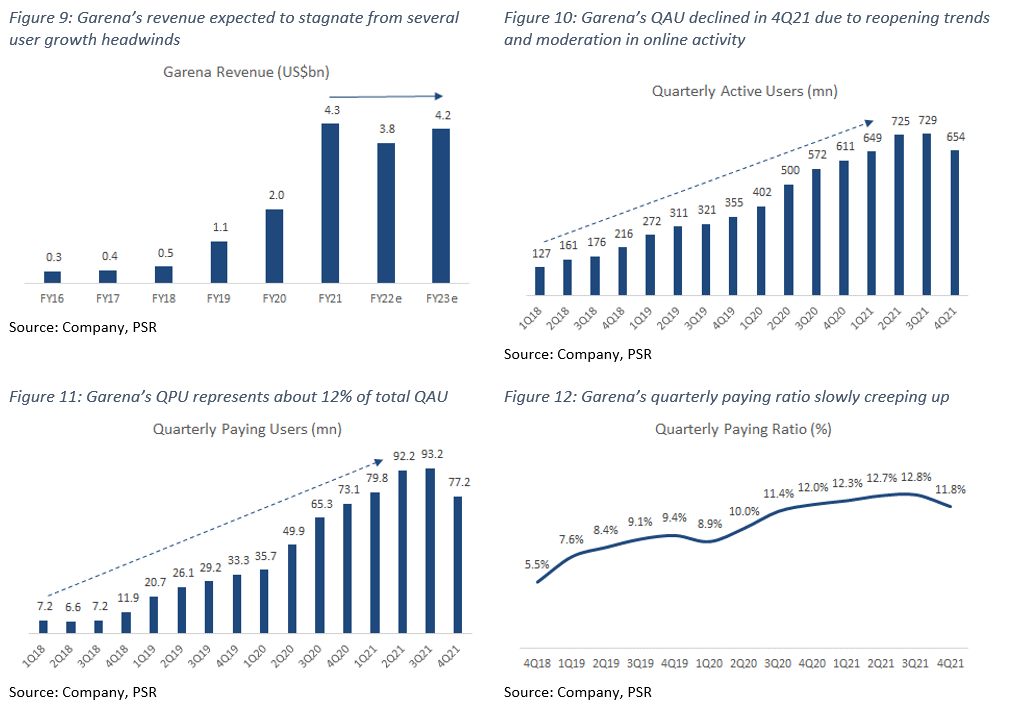
The main metrics used to track performance in this segment are GMV, Gross Orders, Take Rate, and Average Basket Size (Figures 7 and 8). Revenue from this segment was US$5.1bn for FY21, increasing 130% YoY. GMV increased 77% YoY to US$63bn, with gross orders increasing 118% YoY, and an average take rate of about 8% for FY21. We are quite positive on Shopee’s expansion into other highly populated markets like Brazil, where gross orders are growing around 400% YoY. Gross orders in Indonesia – where it’s the largest e-commerce platform, grew 88% YoY in 4Q21. However, we expect overall growth to slow down slightly in FY22e to about 75%, or US$9bn. This is mainly due to increased competition from other big players in the region like Lazada, a maturation of Shopee in several markets, and a reduction in platform incentives for users.
Digital Entertainment (Garena): Garena is a global developer and publisher of video games, mainly focusing on Mobile, as well as PC games. Besides developing its own games, Garena also exclusively licenses and publishes games developed by third parties, focusing on several game genres: battle royale, multiplayer online battle arenas (MOBA), action role-playing games (RPG) and massively multiplayer online role-playing games (MMORPG). Garena also provides access to other entertainment content, such as live streaming online gameplay, and social features such as user chat and online forums.
The majority of revenue generated from this segment can be attributed to its most popular in-house developed mobile game “Free Fire”, which has consistently been ranked amongst the top few mobile games on Google Play by Monthly Active Users (MAU). For 4Q21 and FY21, “Free Fire” remained the most downloaded mobile game globally, and ranked second globally by MAU for all mobile games on Google Play. It also continued to be the highest grossing mobile game in Southeast Asia and Latin America. SE monetizes this by adopting a “freemium” model, allowing users to download and play the game for free, while generating revenue from the sale of in-game virtual items.
Revenue from this segment came in at US$4.3bn for FY21 (Figure 9), representing a 114% YoY growth, and a 5-Yr CAGR of 67%. Quarterly Active Users (QAU) and Quarterly Paying Users (QPU) are the main metrics used in this segment, with both metrics seeing considerable QoQ growth since 4Q18, but this has started to plateau and decrease moderately over the last 3 quarters as a result of headwinds from reopening trends globally (Figures 10 and 11). Garena has also seen its Quarterly Paying Ratio creep up from 5.5% in 4Q18 to 11.8% in 3Q21 (Figure 12).
Revenue growth for this segment is expected to be negative for FY22e, as restrictions on downloads of Free Fire in India present significant headwinds in one of SE’s most heavily populated markets. We forecast revenue to decrease by 12% YoY to about US$3.8bn because of this, coupled with a moderation in online activity as reopening trends continue globally.
Digital Financial Services (SeaMoney): This segment contributes the smallest portion to total revenue, at only 4.7%, and can be broken up into two key areas – payments, and financing. The payments portion includes SeaMoney’s mobile wallet services, which are branded as ShopeePay and AirPay in different countries, as well as other payment processing services. The other portion – financing, includes SeaMoney’s consumer financing products, as well as their “Buy-now-pay-later” (BNPL) products.
SeaMoney generates revenues primarily from commissions earned from third-party merchants via mobile wallet services, as well as interest earned from borrowers in SeaMoney’s consumer financing business. In FY21, SeaMoney started offering services in digital banking and insurtech in Indonesia, and also obtained a bank license in the Philippines. QPU and total payment volume are metrics used to track the performance of SeaMoney, with both these metrics increasing QoQ since 1Q20 (Figures 13 and 14).
This segment generated revenue of US$470mn in FY21, representing a 673% YoY increase, and is expected to grow about 150% YoY in FY22e to about US$1.2bn due to the rapid expansion of use-cases within this segment, increases in user adoption of digital financial services, and synergies drawn with Shopee to provide frictionless transactions.
RULE OF 40
The “Rule of 40” was first introduced as a benchmark to measure the balance between growth and profitability of SaaS companies, taking into account both revenue growth, as well as profitability (Revenue Growth + EBITDA Margins), with the addition of both metrics needing to exceed the 40% threshold. We have modified this slightly by averaging revenue growth over a 3-year period compared with just a single period growth rate. Adding together SE’s 3-year average revenue growth of 129.2% and its EBITDA margin of -13.4%, the total of 115.8% is more than our required threshold of 40% (Figure 15).
EXPENSES
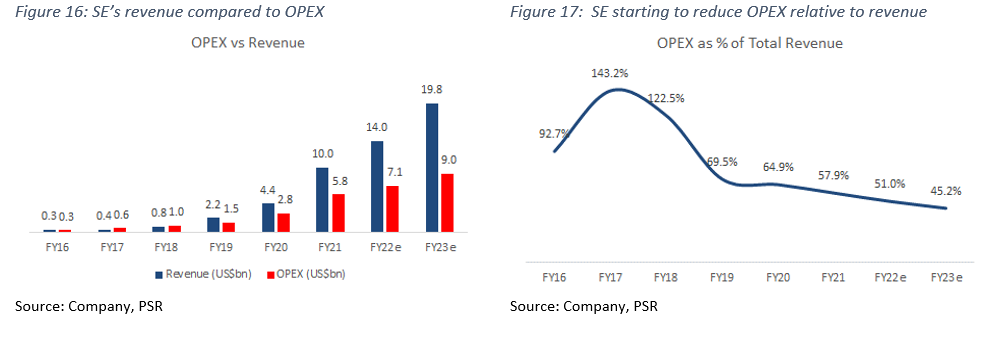
The cost of sales grew 100% in FY21 to US$6.1bn, slightly below total revenue growth of 128%. Operating expenses include research and development (8% of revenue); sales and marketing (39%), and general and administrative (11%). R&D expense grew 135% YoY, and was primarily due to an increase in staff cost as the company continues to expand its tech capabilities. Sales and marketing expense grew 109% YoY, primarily due to higher online content costs, and marketing incentives as the company continues its expansion across different markets. General and administrative expenses grew only 68% YoY.
Total Operating Expense as a percentage of revenue has been reducing over the last 3 years, from 143% in FY17 to 58% in FY21, and we expect this trend to continue as the company begins tapering its sales and marketing expenditure (Figures 16 and 17).
Capital expenditure for FY21 was US$923mn (9% of revenue), a significant increase from US$336mn the previous year. We expect CAPEX to increase moving forward, in line with the company’s expansion plans into other geographical markets.
MARGINS
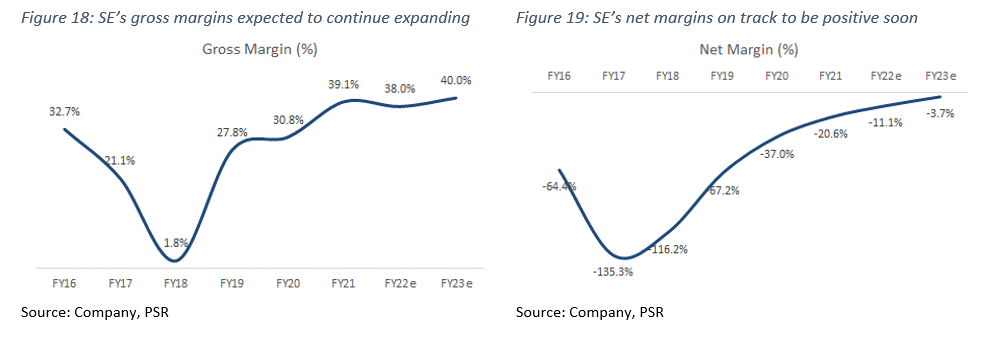
Besides FY17 and FY18, SE’s gross margins have generally been on an upward trend over the last few years, with gross margins at 39% for FY21 (Figure 18). The 1.8% gross margins in FY18 were a result of rapid expansion of the company’s e-commerce business, which significantly increased cost of revenue associated with elevated staff compensation and benefits, as well as higher bank transaction fees driven by exponential GMV growth. We expect gross margins to reduce slightly in FY22e, on the back of a expected reduction in revenue of SE’s high margin digital entertainment business.
Net margins remained negative for FY21 at -21%, although we have seen continued improvements in net margins over the years – from -135% in FY17 to what it is currently. We forecast net margins to continue improving to about -3.7% by FY23e, as the company reduces cash burn and improves profitability of its business segments (Figure 19).
BALANCE SHEET
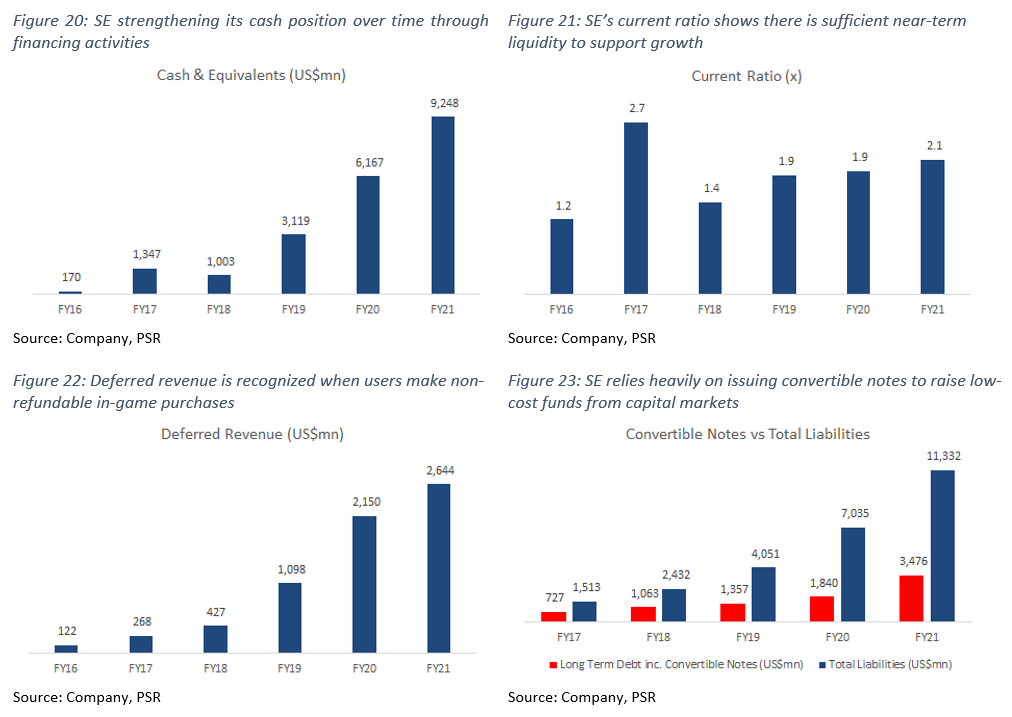
Assets: Cash and cash equivalents increased by about US$3bn YoY in FY21 to US$9.2bn, largely due to significant cash flow from financing activities such as issuances of convertible notes and ordinary shares (Figure 20). Prepaid expenses accounted for slightly over US$1.4bn of assets in FY21, and are attributed to receivables due from logistics providers and payment collection channels in SE’s e-commerce business. SE’s current ratio for FY21 was 2.1x (Figure 21).
Liabilities: The majority of SE’s liabilities come from 3 items: Accrued Expenses, Deferred Revenue, and Convertible Notes. Accrued expenses increased about 74% YoY to US$3.5bn in FY21, and was a result of an increase in accrued cost of revenue and sales and marketing expenses, as well as higher escrow payables. Deferred Revenue increased about 23% YoY to US$2.6bn in FY20, and was mainly due to elevated amounts of cash generated from the sale of in-game virtual items in their digital entertainment business – recognized when users make non-refundable in-game purchases (Figure 22).
US$2.5bn CONVERTIBLE NOTE
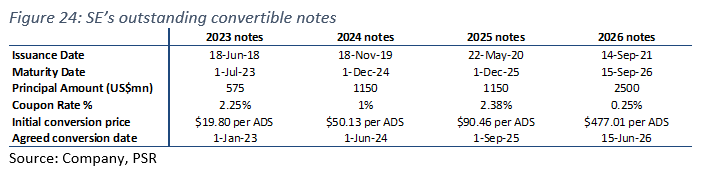
SE recorded US$3.5bn in convertible notes on their balance sheet in FY21, increasing about $1.7bn from FY20, and representing around 31% of total liabilities (Figure 23). So far, the issuance of convertible notes have been a very effective and low cost avenue to fund growth plans, with most of these notes converted into common stock on or before their expiration – SE does not have to repay the principal amount to noteholders who converted, and also save on interest payments. The company recently issued a new tranche of 2026 convertible notes with a principal amount of US$2.5bn, at a coupon rate of only 0.25% (Figure 24). However, it’s conversion price (US$477.01 per ADS) is 4 times more than its current stock price of around US$115, which means that SE would be liable to pay back the full US$2.5bn principal amount to noteholders if the share price does not quadruple by its conversion date in 2026, as these notes would not be converted into common stock.
CASH-FLOW
Free Cash Flow (FCF) in FY21 was -US$714mn. We expect this to continue as the company expands its businesses into more markets.
BUSINESS MODEL
E-commerce (Shopee): Shopee is a mobile-centric, highly scalable, social-focused marketplace platform that connects both buyers, as well as sellers. The platform provides users with a convenient, safe, and trusted marketplace, supported by its own integrated payment and logistics infrastructure, as well as comprehensive services aimed at empowering sellers with the appropriate tools to better engage with buyers. The platform also effectively breaks down barriers to cross-border commerce through its scale and logistics infrastructure. Shopee also periodically introduces new social and gamification elements onto the platform to increase user retention and acquisition.
Shopee’s buyers are predominantly individuals or households who mainly purchase from sellers within the same market. Sellers are primarily small and medium businesses and brands which leverage on the platform’s scale and reach to distribute their merchandise. Shopee currently focuses on long-tailed high-margin product categories such as fashion, health and beauty, home and living and baby products.
The platform has also invested heavily into creating a more secure and reliable shopping environment for buyers, by developing a host of robust consumer protection policies and procedures. For sellers, Shopee has dedicated on-the-ground teams that offer fast and localized operation and technological assistance, as well as a range of value-added services at the sellers’ disposal – inventory management, online store operations and fulfillment services. Transactions on Shopee can be conducted using credit cards, bank transfers, cash payments on delivery, or its own mobile wallet services supported by SeaMoney.
Shopee generates revenue by: 1) selling paid advertising services; 2) charging transaction-based fees; 3) charging sellers for certain value-added services; and 4) direct sales of certain products to consumers. It is also the largest e-commerce platform in the Southeast Asian region by Gross Merchandise Value (GMV), and total orders.
Digital Entertainment (Garena): Garena is focused around two main areas: 1) offering online PC and mobile games; and 2) developing mobile games for global markets. Its digital entertainment services provide users with easy access to a multitude of highly engaging and localized content that are either licensed or developed in-house, while also organizing both online as well as offline gaming activities and events. Garena currently has over 750 developers focusing on building out a pipeline of self-developed games for the future.
Garena’s gaming content library includes some of the most popular and engaging genres of games, including battle royale games, multiplayer online battle arenas (MOBAs), action role-playing games (RPGs), massively multiplayer online role-playing games (MMORPGs), as well as other sports games. In most cases, users play these games online in a virtual environment connected with a large number of other players using existing game servers, allowing users to play simultaneously and interact with one another.
Garena’s most popular in-house developed offering is “Free Fire”, a battle royale mobile game that is ranked 2nd globally by monthly active users for all mobile games on Google Play, and is also the highest grossing mobile game in Southeast Asia, Latin America, and India.
Garena monetizes its games by adopting a “freemium” model, allowing users to download and play games for free, while selling in-game items to users who are able to purchase these items using various payment platforms and methods, including SeaMoney.
Digital Financial Services (SeaMoney): SeaMoney was introduced in 4Q19, and is a leading digital financial services provider in Southeast Asia. It has obtained licenses and approvals to provide e-financial services and loans in several countries within Southeast Asia, and has also obtained a full digital bank license in Singapore. SeaMoney currently offers mobile wallet services, payment processing, credit-related digital financial offerings and other financial products to various markets in Southeast Asia under several different brand names.
One of the main use cases for SeaMoney is to reduce payment friction for Shopee users, tapping on synergies between both platforms to create transactional volume growth. SeaMoney has also expanded, and will continue to expand the use cases of its mobile wallet services outside of SE’s platforms to include other online and offline merchants.
SeaMoney generates revenues primarily from commissions earned from third-party merchants via mobile wallet services, as well as interest earned from borrowers in SeaMoney’s consumer financing business.
INDUSTRY
E-Commerce (Shopee): SE faces heavy competition for both buyers and sellers in the e-commerce industry from regional, as well as large global players. SE’s key markets of Southeast Asia and Taiwan have a population total of about 680 million people, and an estimated GDP of around US$3.6tn, offering a significant market-size opportunity to support the company’s growth in the e-commerce industry. Continued internet penetration in the region, coupled with a generational transition towards more digital forms of commerce, as a result of the pandemic, have provided significant tailwinds for growth in the overall e-commerce industry.
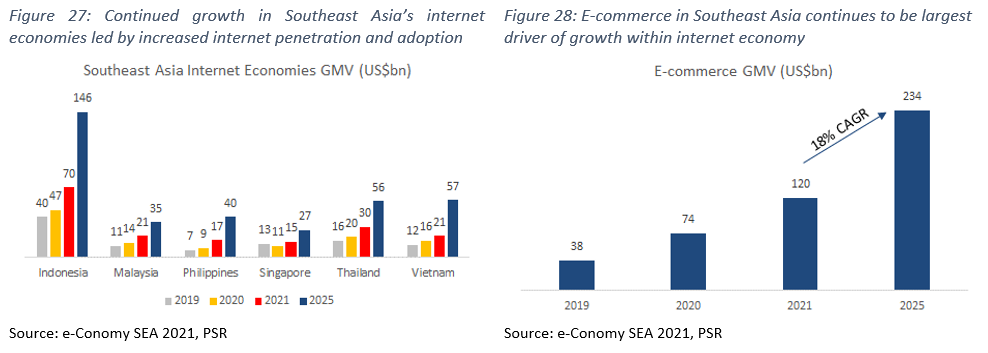
According to the e-Conomy SEA 2021 report by Google, Temasek, and Bain & Company, 60 million new digital consumers were added since the start of the pandemic, with overall usage frequency and amount spent on e-commerce products increasing 30-40% vs pre-pandemic levels. At the same time, more than 90% of new e-commerce users from FY20 continued using such services in FY21, confirming a strong permanent adoption of e-commerce and other digital services. Overall GMV for e-commerce in Southeast Asia remained resilient, growing 62% YoY in FY21 to US$120bn, and is expected to continue trending upward at a 5-year CAGR of 18% until FY25e (Figure 28), with online groceries still a largely under penetrated vertical within e-commerce.
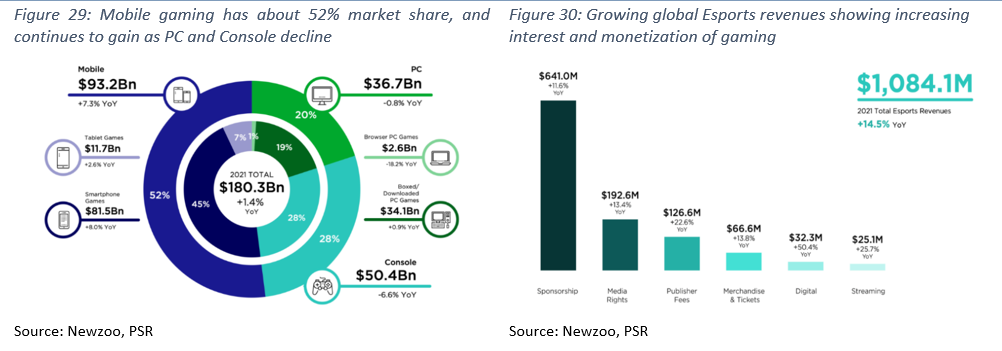
Digital Entertainment (Garena): According to an industry report by Google and Newzoo, the global gaming market grew 1.4% YoY in FY21 to US$180bn. Of the 3 main segments in gaming, mobile gaming stood out with a 7.3% YoY increase to US$93bn (Figure 29), partly driven by a 6.1% YoY increase in global active smartphone users. This bodes well for SE as it focuses mainly on the mobile gaming market. Around 3 billion game players are expected to drive revenues, with an estimated 20% of this number contributed by new gamers as lockdowns from the pandemic provided more free time for people to spend on gaming.
Global Esports revenue for FY21 grew 14.5% YoY to slightly over US$1bn (Figure 30), with audiences for gaming live streams increasing almost 13% YoY to 747 million people. This is expected to hit 950 million by FY24e. Twitch, which is a leading live streaming platform outside of China, generated slightly over 23 billion hours of live viewerships in FY21 – an all-time high for the platform, with YouTube generating almost 5 billion hours.
We expect the growth in popularity in mobile games, and the ever increasing time spent by people watching and playing games to be substantial growth drivers for SE’s digital entertainment business moving forward.
Digital Financial Services (SeaMoney): SE primarily competes with existing online and offline payment service providers, including other mobile wallet service platforms both regionally and globally, with these services complementing other digital services like e-commerce and gaming. SE operates predominatly in the e-wallet and digital lending verticals.
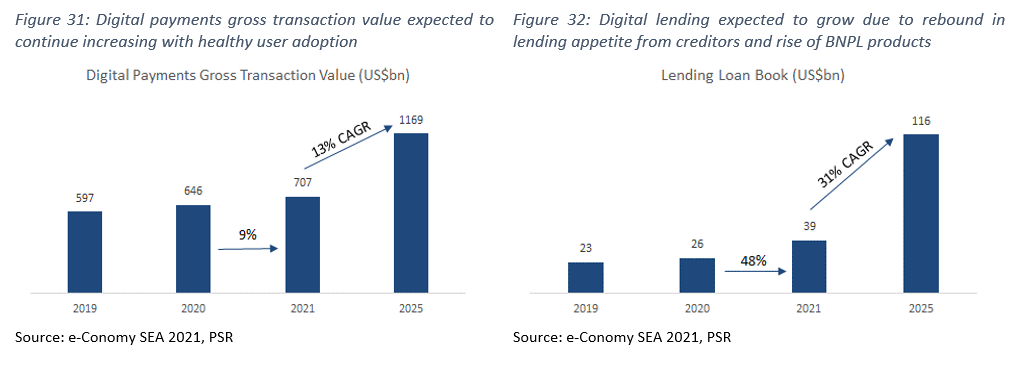
According to the e-Conomy SEA 2021 report, digital financial services adoption rates are increasing and quickly becoming mainstream services, heavily supported by ongoing e-commerce growth in the region. Cash is still king in the region, with about 59% share of total Gross Transaction Value (GTV), but its dominance is expected to continue eroding away over time due to an increasing demand for seamless digital payment experiences. The GTV of digital payments in the region grew 9% YoY, with consumer e-wallet usage increasing 45% vs pre-pandemic levels, with GTV expected to increase 65% by FY25e (Figure 31).
In FY21, digital lending loan books saw a 48% YoY increase in size to US$39bn, with most of it coming from consumer lending, and the expectation that loan books would continue to see a 31% CAGR until FY25e. The growth in this area is expected to be supported by several tailwinds including a rebound in lending appetite from creditors, an increasing usage of supply chain financing from digital merchants, and the rise in buy-now-pay-later (BNPL) consumer financing products.
RISKS
- Profitability concentrated in a single product – Free Fire. Currently, Garena is the only profitable segment within SE, with the majority of revenue in this segment coming from its most popular in-house developed game, “Free Fire”. We view this revenue concentration risk to be somewhat concerning, given that Garena’s revenue could be significantly impacted by a multitude of external factors: declining popularity of Free Fire over time, restrictions imposed on mobile game downloads in specific markets.
- Tough competition in a saturated e-commerce market. The e-commerce landscape in markets where Shopee operates in is very fragmented, with up to 30 e-commerce players in many of the markets. Shopee faces tough competition across its markets by larger well-funded players, which could provide headwinds to Shopee’s growth and monetization plans, especially as the company plans on increasing its take rate and reducing cash burn on marketing and promotional incentives moving forward.
- Reliance on equity markets for funding through convertible notes. SE has been very reliant on raising funds via the sale of convertible notes and shares, with almost US$10bn worth of funds raised. The company also benefits from the fact that most notes end up being converted on or before its maturity date, resulting in the company freeing up cash flow from not needing to pay back the principal amount, as well as expected future coupon payments of these notes. The downside to this for investors is a dilution in shares as more notes are converted into common stock. Poor conditions in equity markets may result in difficulty raising low-cost funds through these methods in the future, which in turn could affect SE’s growth plans moving forward.
VALUATION
We initiate coverage on SEA Ltd. with a BUY rating and a price target of US$196.00. Our valuation is based on DCF, using a 6.9% WACC and 4.0% terminal growth rate.
About the author

Jonathan Woo
Research Analyst
PSR
Jonathan covers the US technology sector focusing on internet companies. Formerly a national and professional athlete, he graduated from the University of Oregon with a Bachelor’s Degree in Social Sciences.


About the author
Jonathan Woo
Research Analyst
PSR
Jonathan covers the US technology sector focusing on internet companies. Formerly a national and professional athlete, he graduated from the University of Oregon with a Bachelor’s Degree in Social Sciences.
 Apr 19th - Things to Know Before the Opening Bell
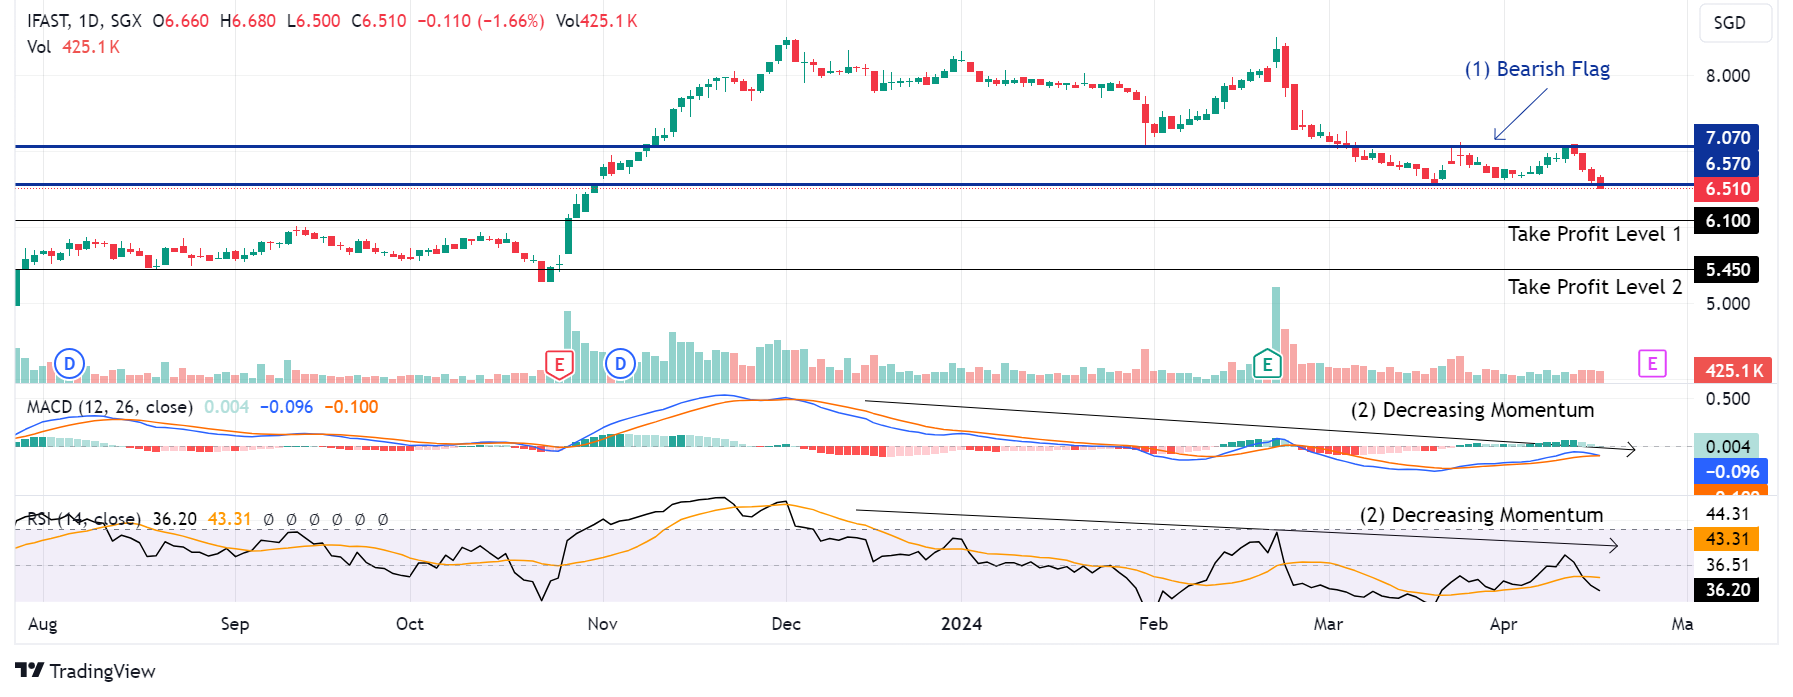 Trade of the Day - iFAST Corporation Ltd (SGX: AIY)
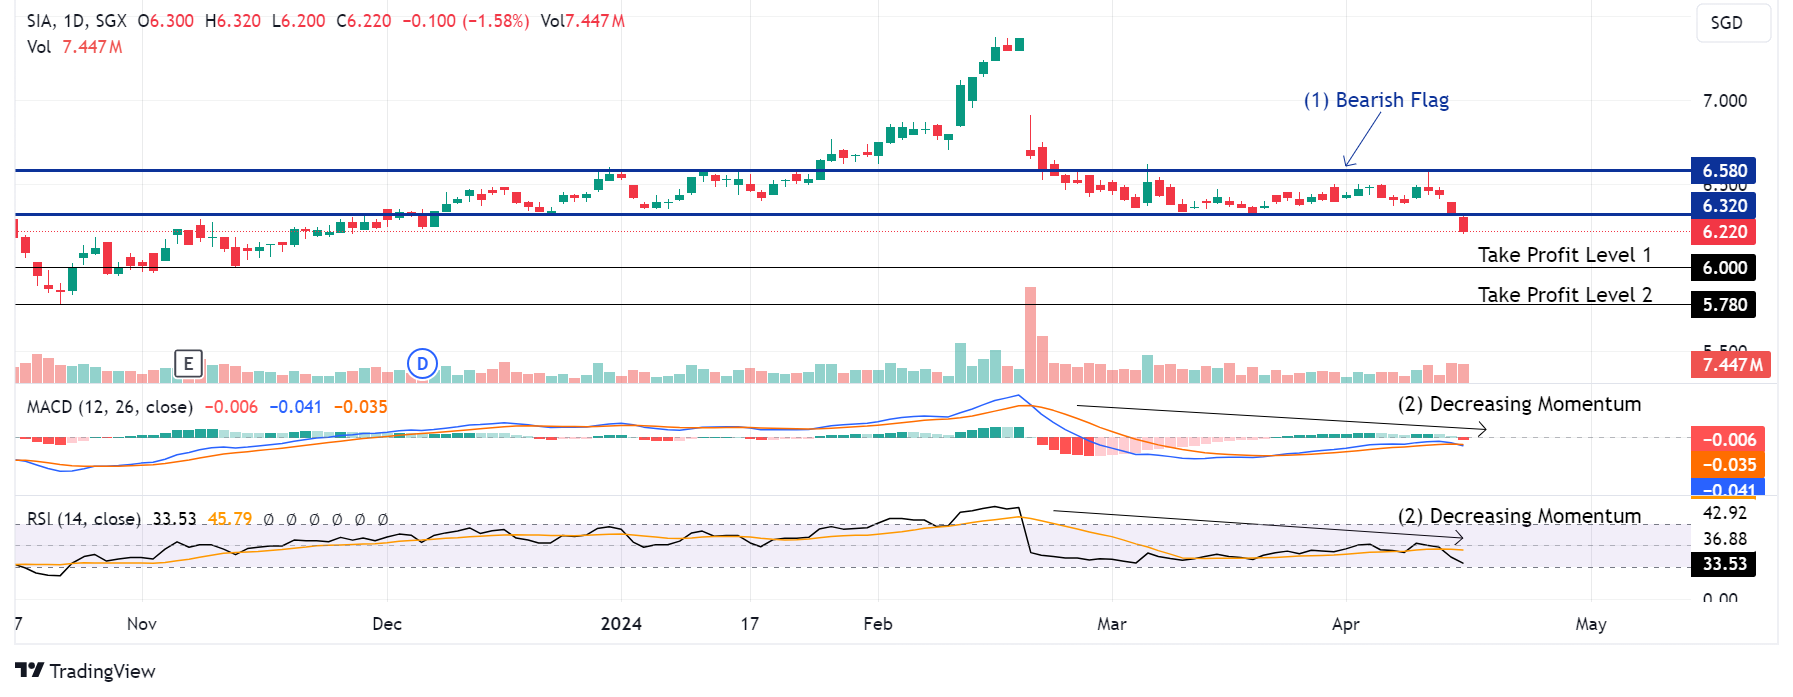 Trade of the Day - Singapore Airlines (SGX: C6L)
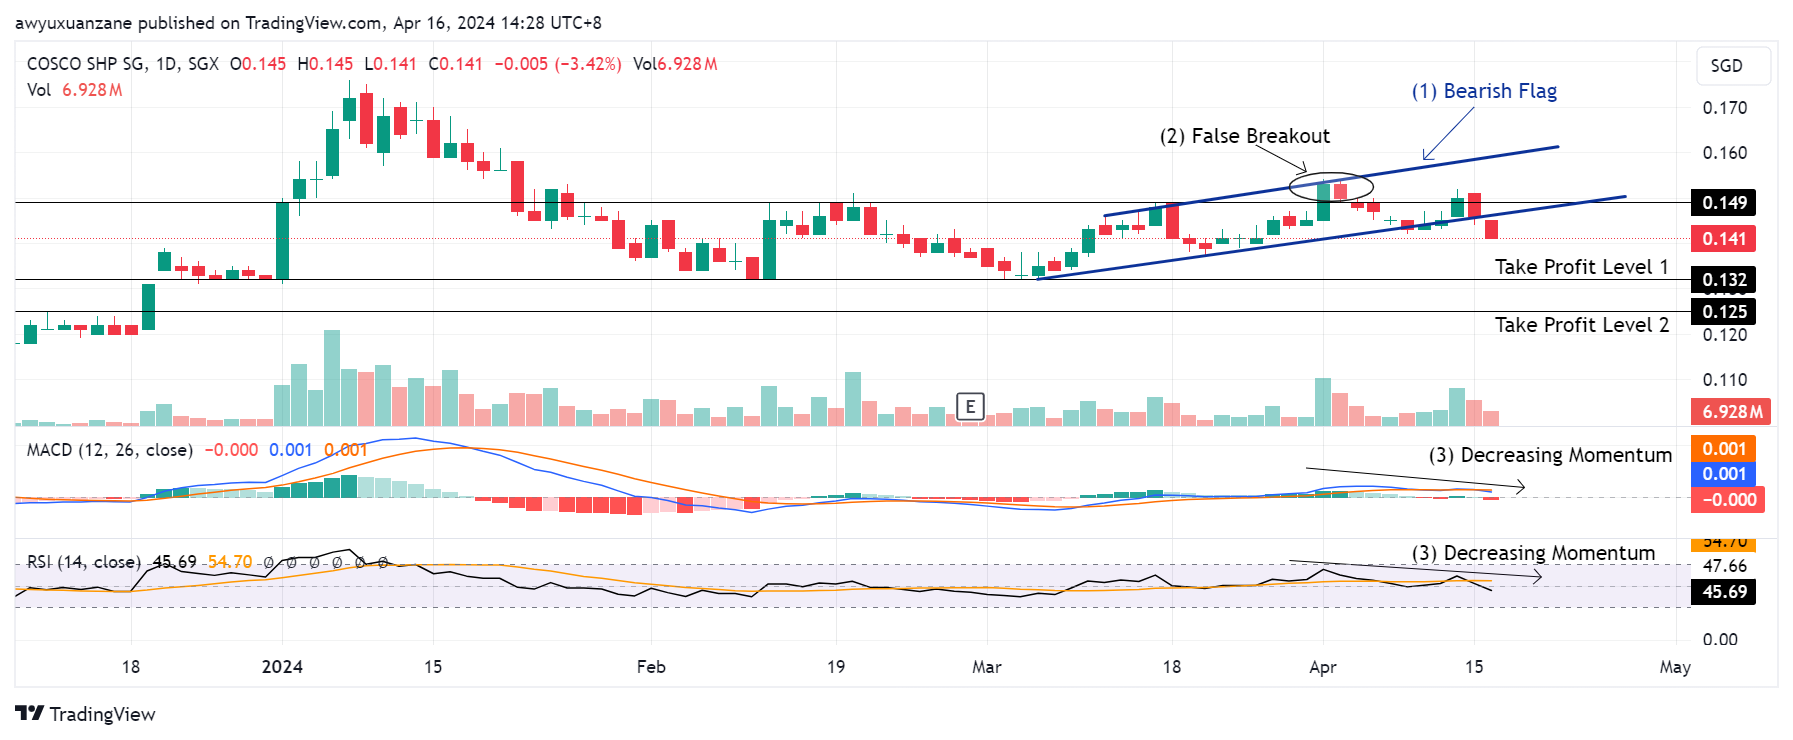 Trade of the Day - COSCO Shipping International (Singapore) Co Ltd (SGX: F83)