
Spotify Technology S.A. - Leading global audio platform with pricing power
3 Oct 2022- Revenue spiked >3x in last 5 years, with the company also adding 300mn users. Incremental conversion of Monthly Active Users (MAU) and increasing prices (ARPU) to drive revenue growth of 54% over the next 2 years.
- Recurring revenue business model, around 90% of revenue is recurrent from ~190mn premium subscribers growing at 30% p.a. over last 5 years, churn levels improving YoY.
- The faster growing advertising revenue from podcasts and audiobooks will be a boost to gross margins.
- Initiate coverage with a BUY recommendation and DCF-based target price (WACC 7.5%, g 3.0%) of US$117.00
Company Background
Spotify Technology S.A. operates the world’s most popular audio streaming subscription service with >430 million monthly active users across 180+ countries and territories. The bulk of its total revenue comes from premium service subscriptions (87.5%), and the remaining 12.5% comes from advertising revenue in its ad-supported segment. Spotify currently has the largest market share (31%) in the global audio streaming industry, with more users than the next 2 closest competitors combined.
Investment Highlights
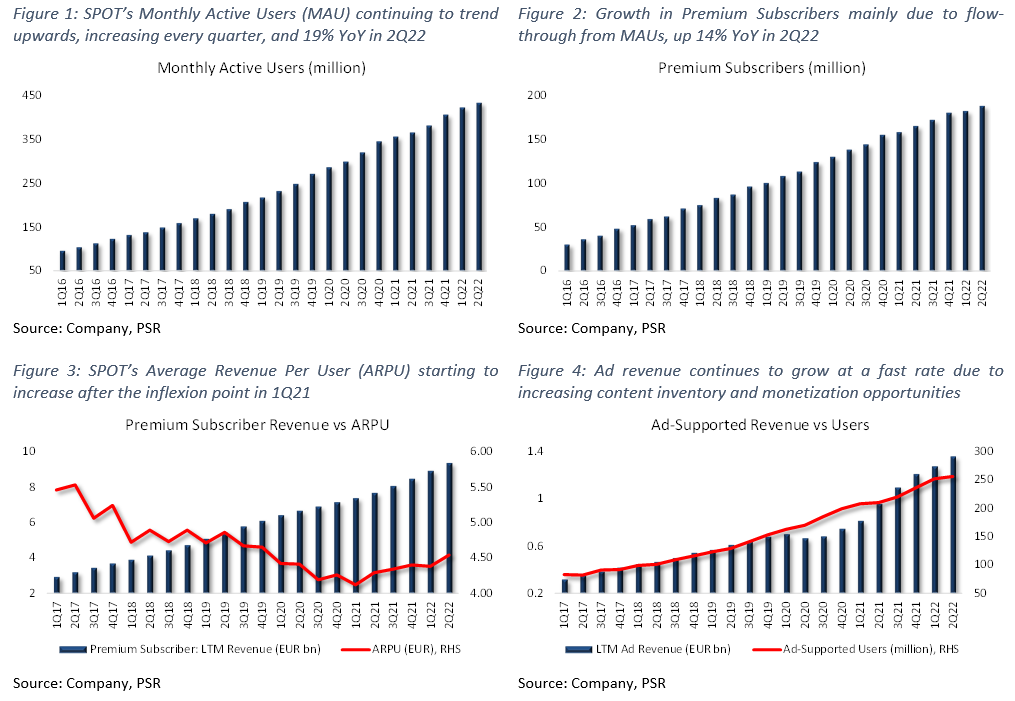
- Growing user base and rising prices to drive future revenue growth. SPOT has consistently grown both its revenue and user base, by more than 3x from FY16 to FY21. Premium revenue – which drives ~90% of revenue growth, grew 22% YoY in 2Q22 to EUR2.5bn, leveraging from the conversion of MAUs into premium subscribers. SPOT is also the leader (31% market share) in the global audio streaming market – an industry that is expected to increase 9% CAGR until FY25e, and has the largest library of audio content across formats like music, podcasts, and audiobooks. We expect the company’s continued ability to convert existing MAUs into premium subscribers through its engaging content, coupled with increasing subscription prices – as demonstrated by rising ARPU (6% YoY), to drive revenue growth of ~54% over the next 2 years.
- Recurring revenue business model with churn levels improving YoY. SPOT operates a recurring revenue business model from its premium monthly subscriptions (~90% of total revenue). Premium revenue has grown over the last 5 years at a 26% CAGR, largely due to a 130mn jump in subscribers. With churn levels improving YoY, premium revenue continues to be a base of resilient revenue generation for SPOT, even amidst a weaker macroeconomic environment this year. ARPU saw an inflexion point in 1Q21, and has since been improving 5-6% YoY as a result of increasing subscription prices – which are expected to continue trending upwards. SPOT’s ability to add subscribers and incrementally raise prices at the same time should allow the company to expand their resilient base of premium revenue further.
- Stretching higher-margin ad revenue to boost margins. Gross margins were 27% in FY21 – increasing about 1.5% YoY, with management reiterating its goal of achieving 35-40% gross margins in the near future as revenue per listening hour continues to outpace cost per listening hour. Additionally, SPOT remains focused on growing its higher-margin ad revenue (12.5% of revenue), expanding its non-music content – podcast and audiobooks, to create more ad-placement opportunities for advertisers. We expect this focus on growing ad revenue to help overall margin expansion moving forward.
We Initiate coverage with a BUY rating and a target price of US$117.00 based on DCF valuation, with a WACC of 7.5% and terminal growth of 3%.
REVENUE
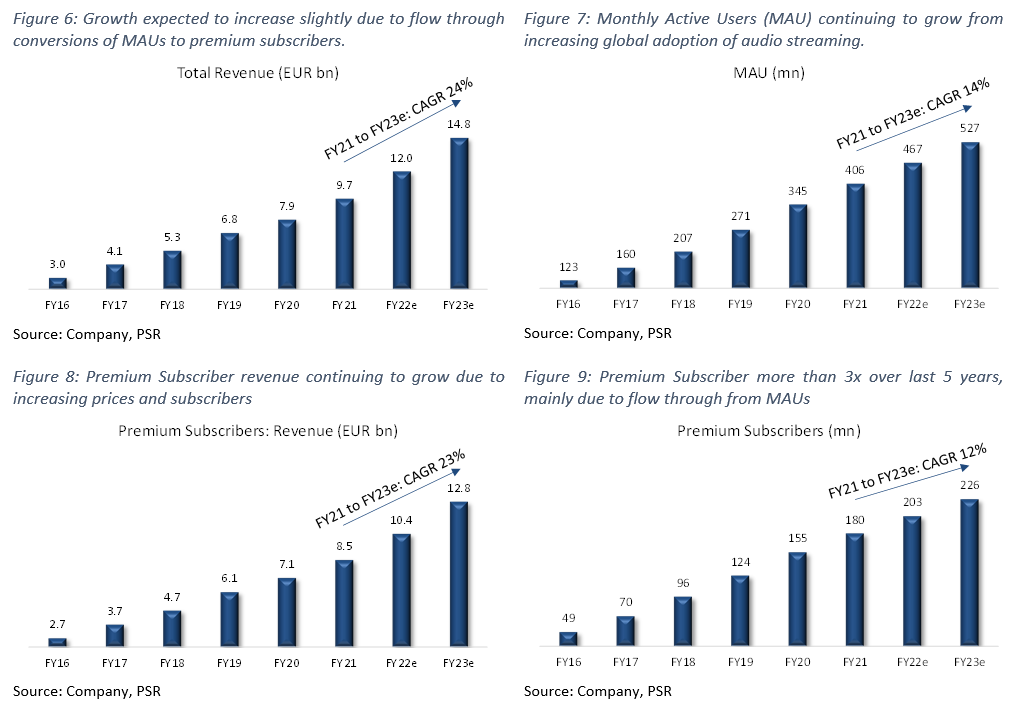
SPOT posted EUR9.7bn in revenue for FY21, increasing 23% YoY (Figure 6), with the majority (87.5%) of its total revenue coming from its premium service subscriptions, and the remaining 12.5% coming from advertising revenue in its ad-supported segment.
Premium Subscription: SPOT generated about EUR8.5bn in revenue for this segment last year, growing 19% YoY (Figure 8), with a 5-Yr CAGR of 26%. From the company’s latest 2Q22 filings, revenue from premium subscriptions came in at EUR2.5bn, up 22% YoY (14% YoY in constant currency), primarily due to a follow-through effect on subscriber gains. Revenue in this segment is earned mainly through the sale of its premium services – on-demand and offline listening. This service is sold both directly to end-users, and also through distribution partners such as telecommunications companies. The premium service is typically paid for on a monthly recurring basis, with average revenue per user (ARPU) the main metric used to monitor pricing trends. ARPU had been declining due to expansion into lower-priced regions but has since reached an inflexion point as a result of strong pricing power, increasing QoQ since 1Q21.
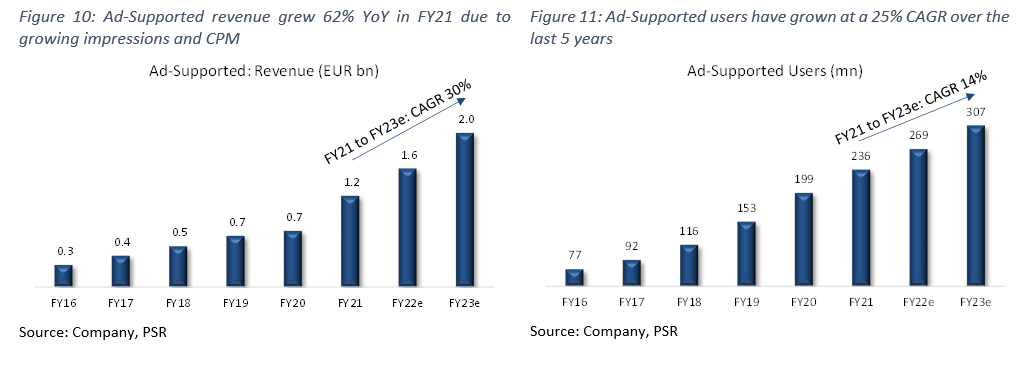
Ad-Supported: SPOT generated about EUR1.2bn in ad-supported revenue for FY21, with a growth rate of about 62% YoY (Figure 10), and a 5-Yr CAGR of 33%. Ad-Supported revenue for 2Q22 grew 31% YoY (17% in constant currency), led by growth in ad impressions and cost per 1000 impressions (CPM). Revenue from this segment is generated primarily from the sale of display, audio, and video advertising through ad impressions across the company’s music, podcast, and audiobook content. Advertising arrangements are usually sold on a cost-per-thousand basis and recognized when impressions are delivered on the platform
Revenue Growth: We forecast total revenue for FY22e to hit EUR12bn, which would represent a 24% YoY growth, supported by a combination of FX tailwinds, increasing premium subscribers, and increasing ad revenue. Revenue from premium subscribers in FY22e is expected to hit EUR10.4bn (23% YoY), primarily from subscriber growth and slight increases in the subscription price. Ad-supported revenue is expected to grow 30% YoY to EUR1.6bn, on the back of increasing ad impressions.
RULE OF 40
The “Rule of 40” was first introduced as a benchmark to measure the balance between growth and profitability of SaaS companies, taking into account both revenue growth, as well as profitability (Revenue Growth + EBITDA Margins), with the addition of both metrics needing to exceed the 40% threshold. We have modified this slightly by averaging revenue growth over a 3-year period compared with just a single period growth rate. Adding together SPOT’s 3-year average revenue growth of 23% and its EBITDA margin of 2%, the total of 25% is less than our required threshold of 40% (Figure 12). However, we do expect EBITDA margins to continue rising due to SPOT’s growth in operating leverage.
EXPENSES
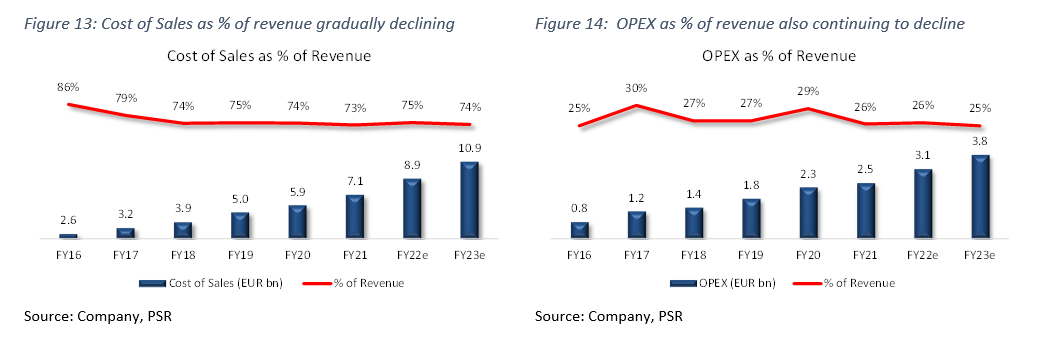
SPOT’s cost of sales grew 21% in FY21 to EUR7.1bn (Figure 13), slightly below the total revenue growth of 23%. Cost of sales (73% of total revenue) encompasses mainly royalties and distribution costs related to content streaming paid to third parties – record labels, music publishers, etc. Through FY21, the company had paid more than EUR26bn in royalties, making them one of the largest engines for revenue growth to artists and labels in the music industry.
Premium subscriber cost of sales grew 17% YoY, but decreased slightly as a percentage of premium subscriber revenue from 72% in FY20, to 71% in FY21. The YoY increase was mainly driven by growth in premium subscribers and increases in publishing licensing rates. Ad-supported cost of sales grew 48% YoY, but decreased as a percentage of ad-supported revenue from 99% in FY20 to 90% in FY21. The YoY increase was mainly due to higher royalty and revenue-sharing costs due to growth in advertising revenue and increases in publishing rates.
Operating expenses include research and development (9% of revenue); sales and marketing (12%); and general and administrative (5%). R&D expenses grew 9% YoY, primarily due to personnel-related costs as a result of increased headcount to support growth. Sales and marketing expense grew 10% YoY, primarily due to a EUR128mn increase in advertising costs for marketing campaigns. General and administrative expenses increased only 2% YoY. Total Operating Expense for FY21 was EUR2.5bn (Figure 14) – 26% of revenue.
MARGINS
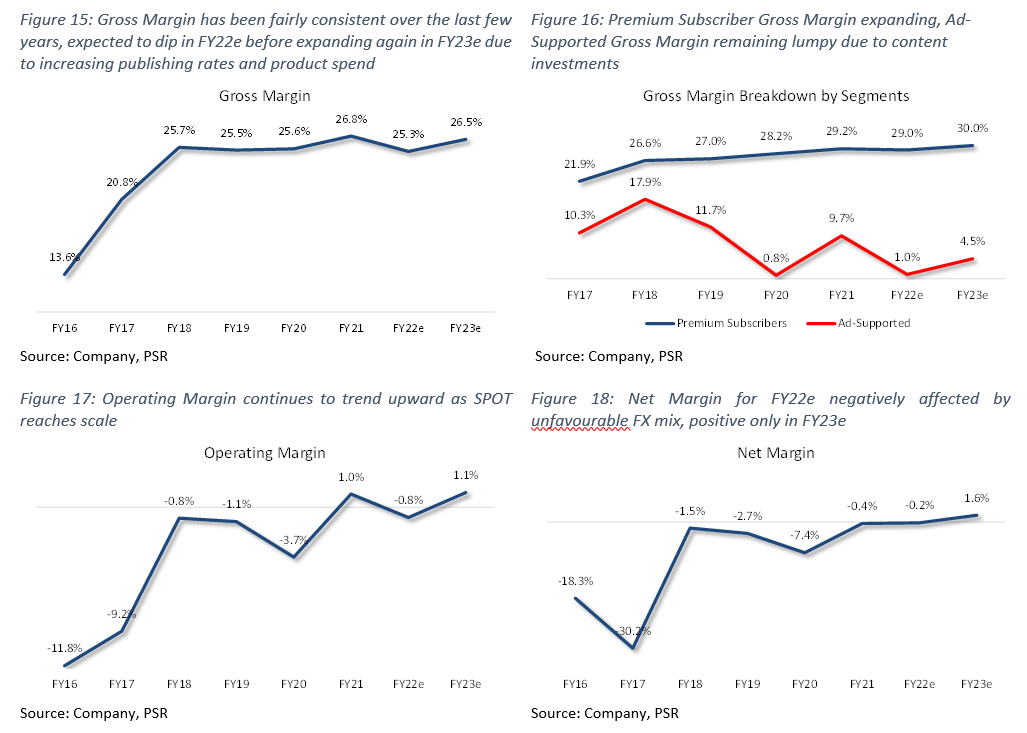
SPOT’s gross margin was 27% in FY21, and has been gradually improving over the last 5 years (Figure 15). Premium subscriber gross margin was 29.2% in FY21, up 1% YoY, and an increase of 7.3% from FY17 – 21.9% (Figure 16). The increase was primarily due to certain benefits from marketplace programs and beneficial changes in rights holder liabilities estimates. Ad-supported gross margin was 9.7% in FY21, compared with 1% in FY20 (Figure 16). The sharp increase was primarily due to a decrease in streaming delivery, ad servicing, and production costs as a percentage of revenue.
Typically, gross margins have been relatively low due to high royalties paid out to record labels and music rights holders, and continued investments in building up its Podcast and Audiobook content. However, we do expect gross margins to start climbing as the company begins slowing its product investments as a % of revenue over time. Management has also reiterated its goal for gross margins to be in the 35-40% range moving forward.
Operating margin was 1.0% in FY21, and has been steadily increasing over the years – up from -12% in FY16 (Figure 17). We forecast operating margins to dip slightly in FY22e due to unfavourable FX headwinds – SPOT has a larger percentage of US Dollar denominated expenses, but to resume its path upwards in FY23e and beyond, mainly due to increasing operating leverage.
Net margin in FY21 was -0.4%, and has been improving YoY, with positive net margins expected for the first time in FY23e as the company leverages on its growing user base and increasing pricing power (Figure 18).
BALANCE SHEET
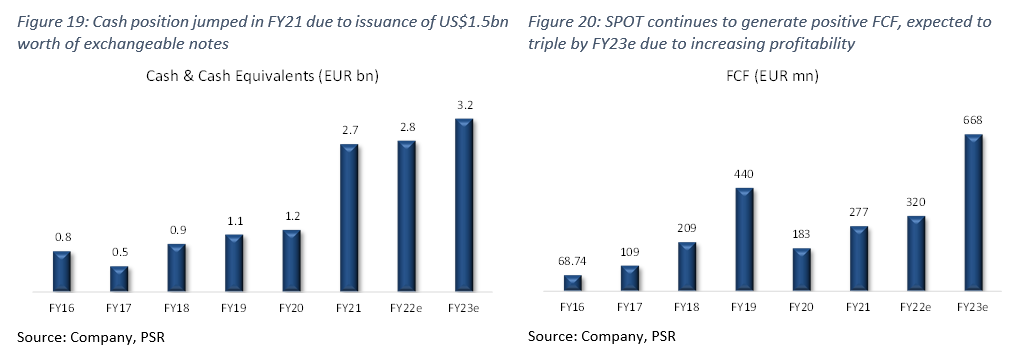
Assets: Cash and cash equivalents increased by about EUR1.6bn YoY in FY21 to EUR2.7bn (Figure 19), largely due to a EUR1.2bn issuance of exchangeable notes, and improving cash generated from operations. Short-term investments were at EUR756mn, and generally consist of commercial paper, corporate debt securities, collateralized reverse purchase agreements, and government and agency debt securities, with an average duration of less than 2 years.
Liabilities: SPOT’s largest current liability was its accrued fees payable to rights holders of its streaming content, and was EUR1.4bn in FY21 – falling within accrued expenses and other liabilities category.
US$1.5bn Exchangeable Notes
SPOT issued US$1.5bn worth of 5-year 0% exchangeable notes in FY21, and it was the company’s largest non-current liability. These notes mature in March 2026 with a strike price of ~US$515 per ordinary share (around 5x its current price). Net proceeds for this issuance was EUR1.2bn after transaction costs. The company will be able to repay the notes with its net cash hoard of EUR2.1bn by 2023e.
CASH-FLOW
Free Cash Flow (FCF) grew 51% YoY in FY21 to EUR277mn (Figure 20) and has been increasing at a 5-Yr CAGR of 32%. We expect FCF to triple by FY23e on the back of increasing profitability and operating leverage.
BUSINESS MODEL
Similar to how Netflix has transformed the way people consume on-demand visual entertainment, SPOT has also provided consumers the ability to stream music on demand, transforming the music industry through its >80 million tracks – including >4.4 million podcast titles. The company has also reiterated its decision to actively invest in other forms of alternative and spoken word content like audiobooks and podcasts to complement its existing music library – through direct ownership or licensing arrangements. SPOT also leverages on relationships in the music industry, data analytics, and software, to build and enhance a two-sided marketplace for both users and creators, empowering creators by unlocking new monetization opportunities, and reshaping the way users enjoy, discover, and share audio content. SPOT’s two distinguished services – premium and ad-supported, live independently of each other, with ad-supported services acting as a funnel that drives a significant portion of premium subscriber additions.
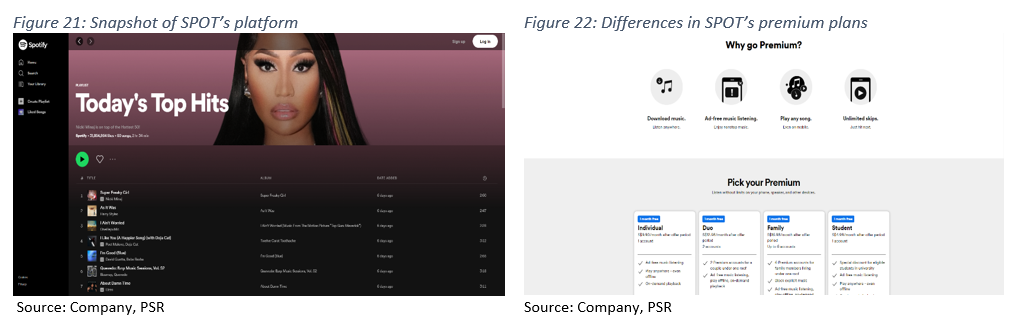
Premium Subscription: SPOT provides its premium subscribers unlimited online and offline high-quality streaming access (via PC, mobile, and tablets), to its library of music, podcasts, audiobooks. Subscribers also have the option of choosing from a variety of price plans – Standard, Family, Duo, Student. Prices vary between plans, and are adapted to local markets to align with consumer purchasing power. Subscriptions are usually recurring on a monthly basis, but SPOT has also expanded to include prepaid options and durations other than monthly (longer or shorter durations) to cater to local markets. Most of the new premium subscribers are generally sourced from converting ad-supported users through online platform and marketing engagements.
Ad-Supported: No subscription or platform fees, provide users with limited on-demand online access to music catalogue, but unlimited access to podcasts via PC, mobile, tablets. It also serves as both an acquisition channel for premium subscribers, and a free option for users who are unable or unwilling to pay a monthly subscription fee. Revenue is generated via the sale of video, display, and audio advertisement placements. Advertising arrangements are usually sold on a cost-per-thousand basis. SPOT is also constantly looking to introduce new advertising products across all catalogues. An example of this would be the introduction of an audio advertising marketplace, Spotify Audience Network (SPAN), with SPOT acting as an enabler helping publishers sell targeted advertisements to brand partners. The prospect of monetization has been successful in incentivizing content creators into publishing more content into SPAN, which has in turn made it more attractive for advertisers to be a part of this ecosystem, creating sort of a flywheel effect which will benefit the growth in Ad-supported revenue. Revenue from this segment is reliant on the number of users, total hours of content consumed, and SPOT’s ability to provide relevant innovative advertising products.
INDUSTRY
SPOT is the leader in audio streaming services globally, with almost the same number of subscribers as the next 3 platforms combined (Figure 23). As of FY21, SPOT had an estimated 31% market share in the global audio streaming market, based on subscriber base – almost twice that of its nearest competitor Apple Music. Other competitors include YouTube Music, Amazon Music, SiriusXM, and Pandora. The company’s highest penetrated countries are developed regions like North America and Europe, with other regions such as Asia still in its early stages of adoption (Figure 24).
The global audio streaming industry has continued to grow at a 3-YR CAGR of 19% since FY18, with users also growing at a similar CAGR of 18%. Several factors have contributed to this: 1) increasing smartphone penetration globally has allowed more users to consume on-demand audio wherever they go; 2) traditional radio usage has been declining, with digital consumption taking its share, particularly with car usage being a huge use case in North America. We do expect growth rates to come down slightly, to about 9% CAGR over the next 4 years, mainly due to a huge adoption wave over the last 2 years that was driven by COVID-19 (Figure 25). Similarly, we expect the growth in users to slow to about 7% CAGR over the same period moving forward (Figure 26).
About the author

Jonathan Woo
Research Analyst
PSR
Jonathan covers the US technology sector focusing on internet companies. Formerly a national and professional athlete, he graduated from the University of Oregon with a Bachelor’s Degree in Social Sciences.


About the author
Jonathan Woo
Research Analyst
PSR
Jonathan covers the US technology sector focusing on internet companies. Formerly a national and professional athlete, he graduated from the University of Oregon with a Bachelor’s Degree in Social Sciences.
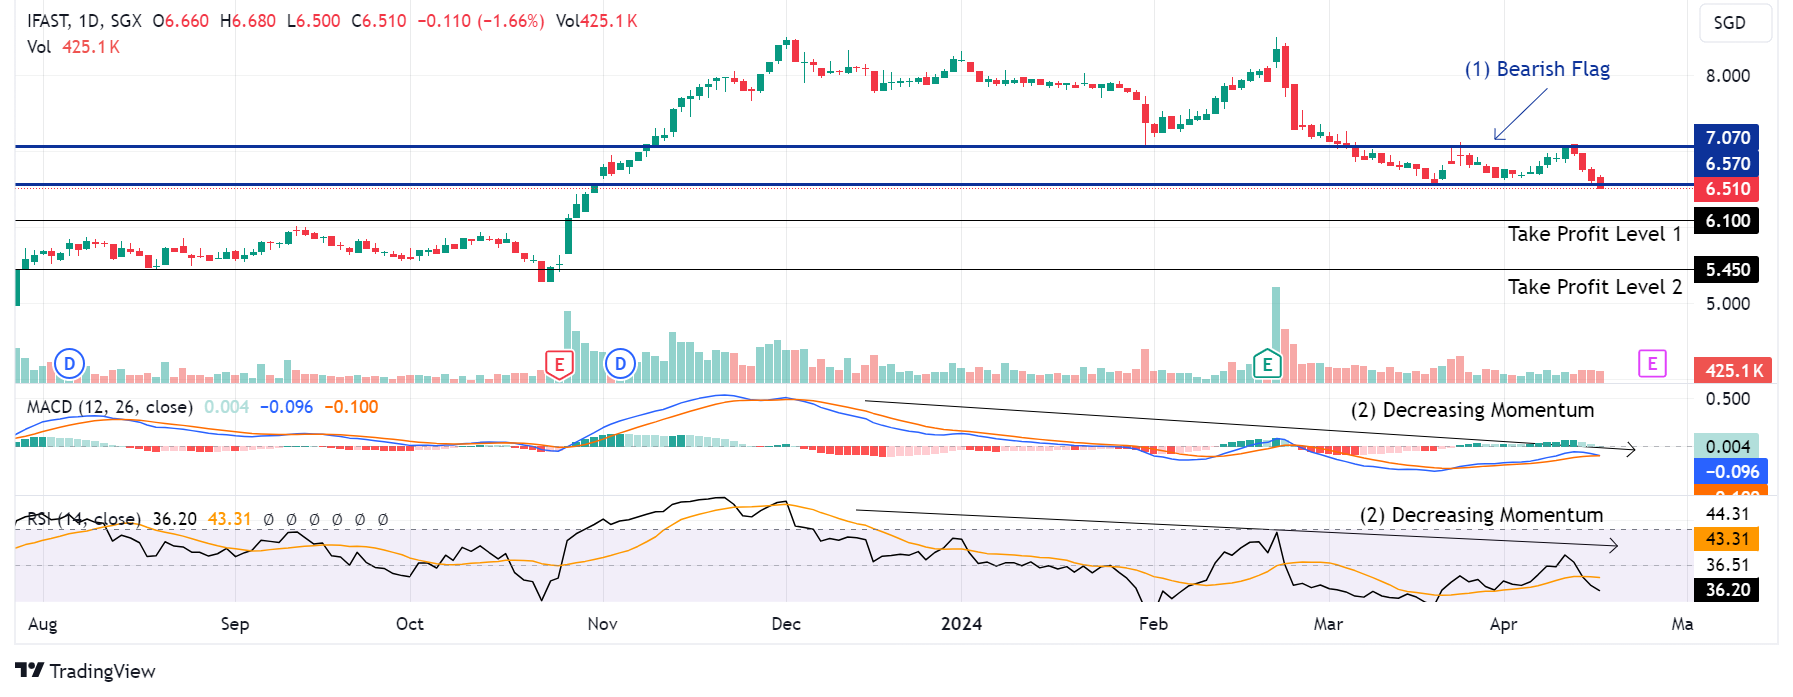 Trade of the Day - iFAST Corporation Ltd (SGX: AIY)
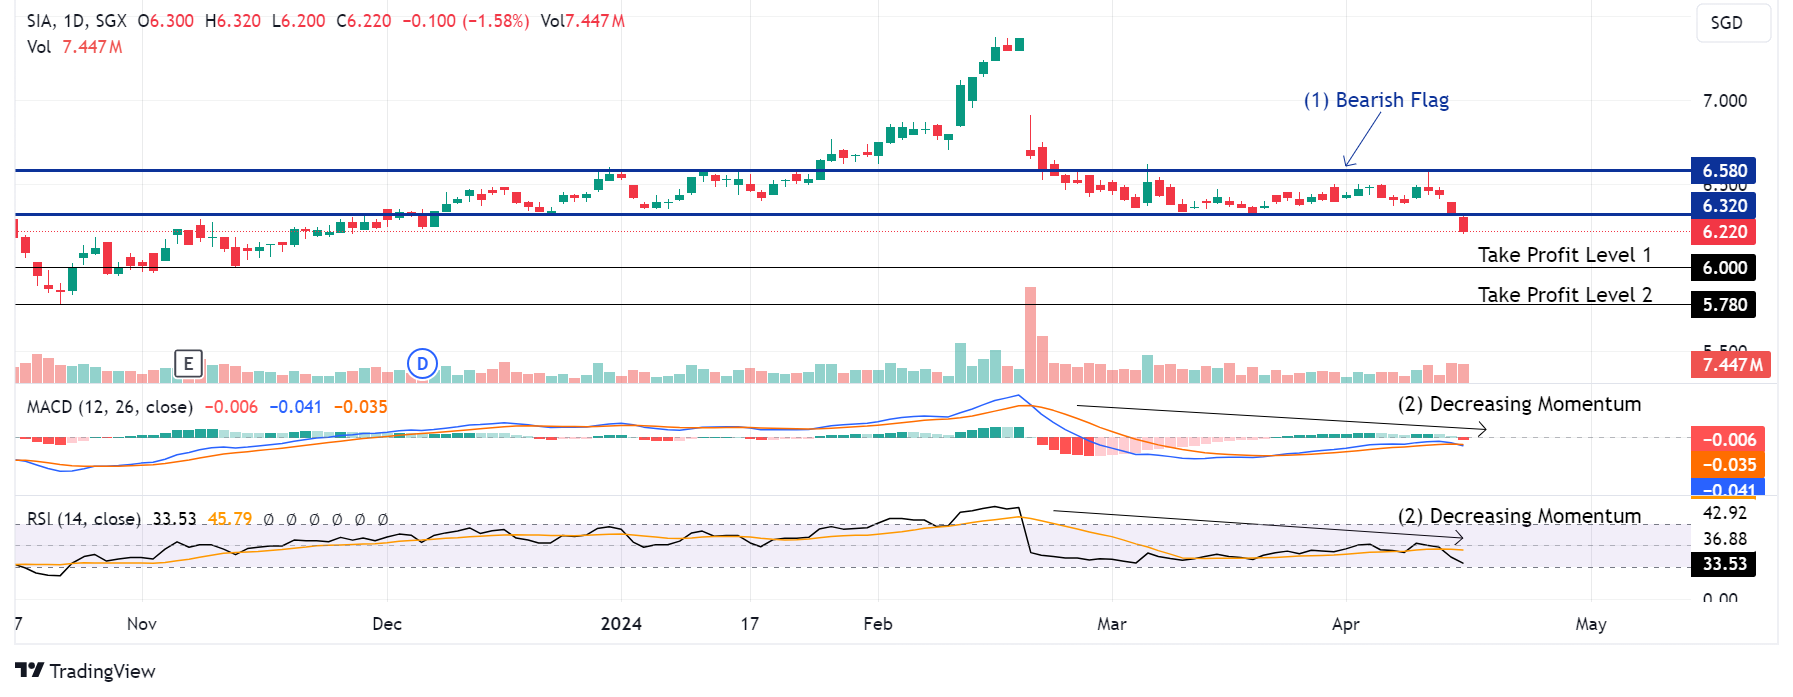 Trade of the Day - Singapore Airlines (SGX: C6L)
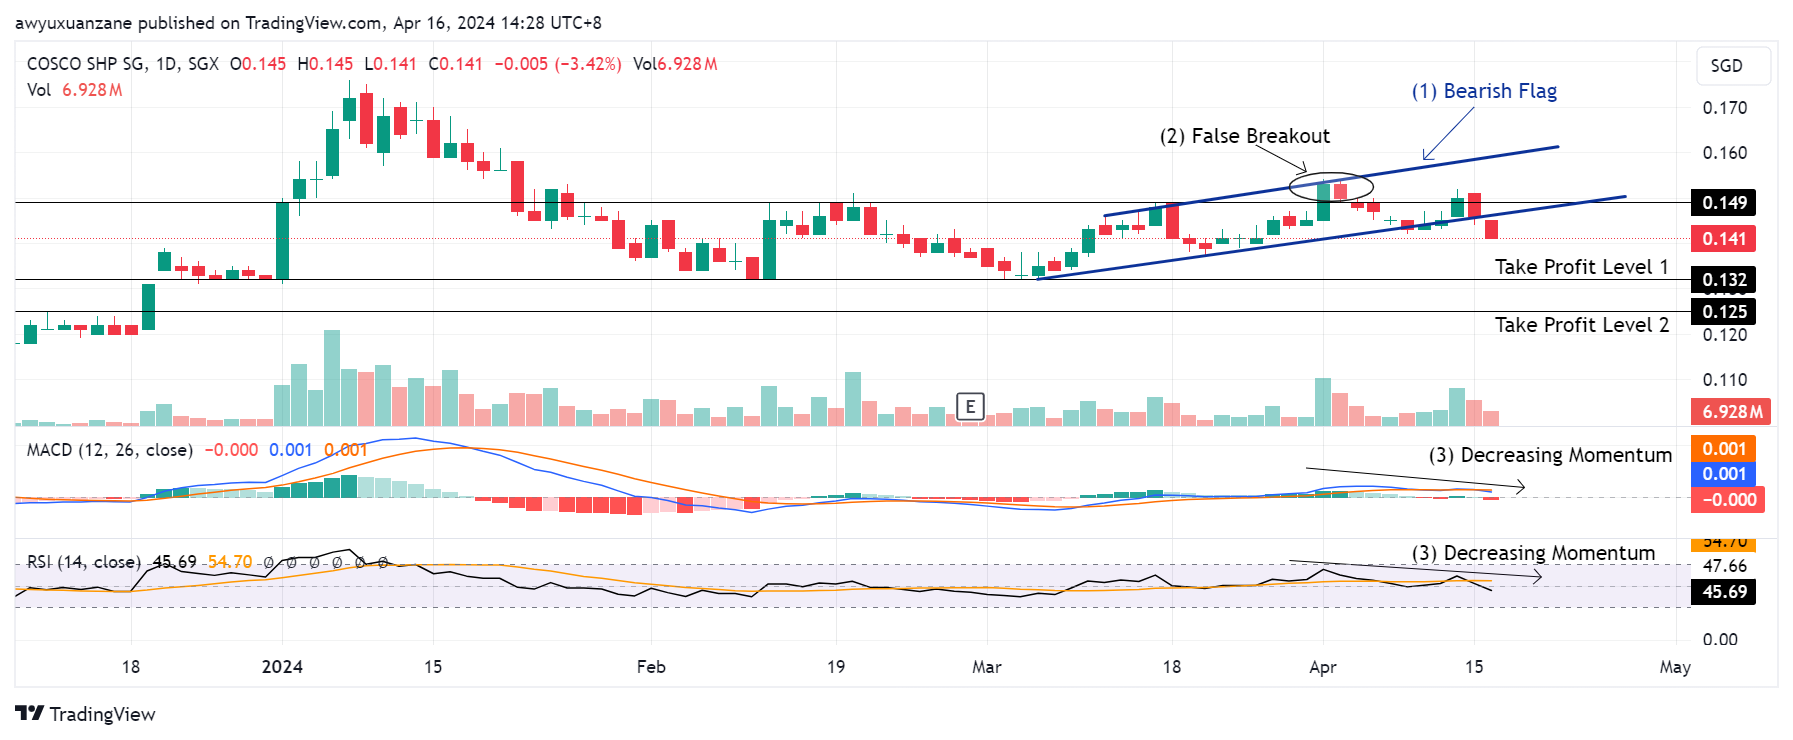 Trade of the Day - COSCO Shipping International (Singapore) Co Ltd (SGX: F83)
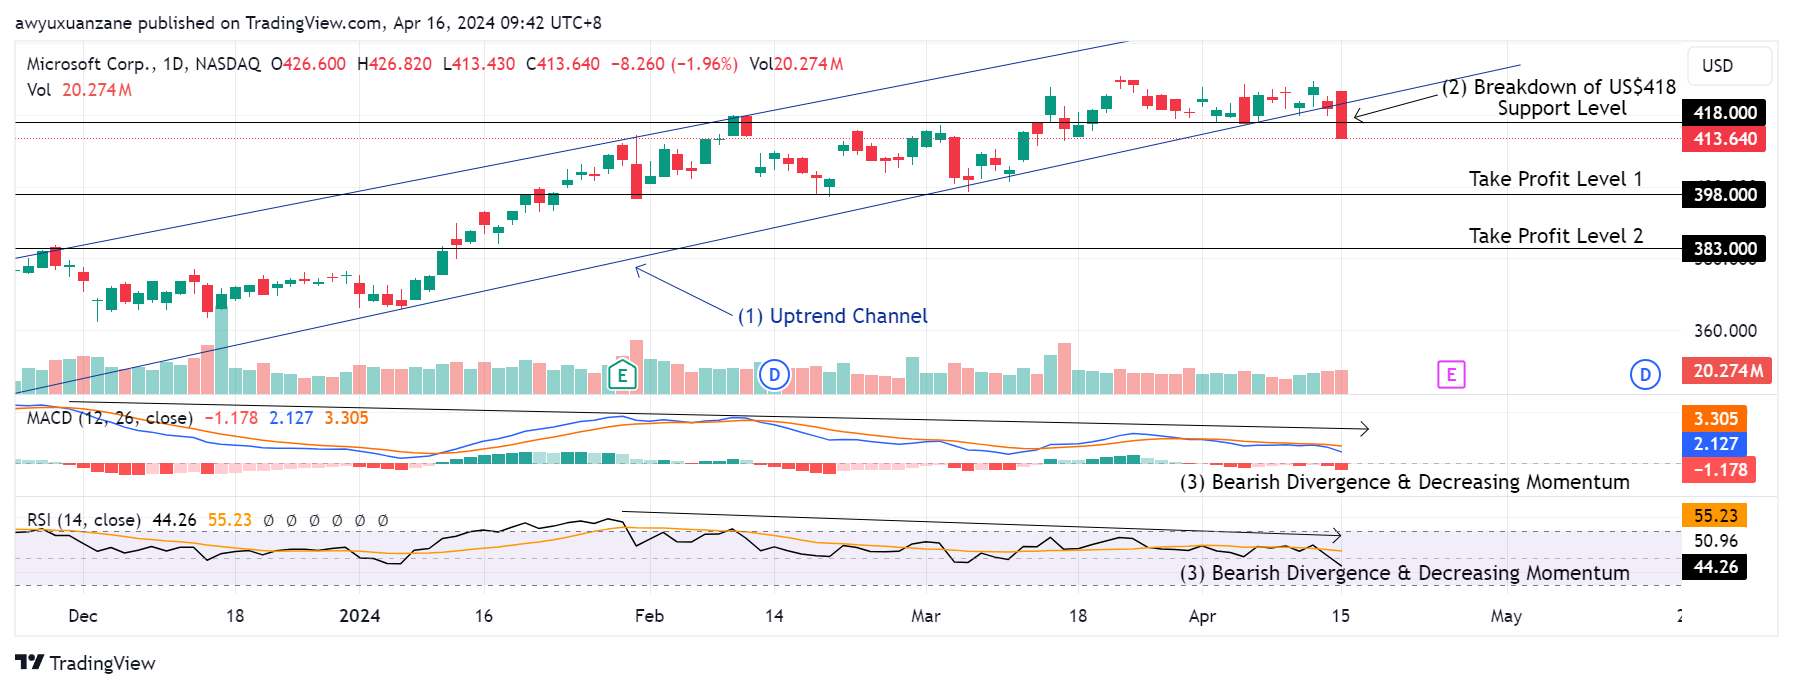 Trade of the Day - Microsoft Corp (NASDAQ: MSFT)