
United Overseas Bank Limited - Boosted by higher net interest income
1 Aug 2022- 2Q22 earnings of S$1,113mn were in line with our estimates due to higher net interest margin and healthy net interest income growth. 1H22 PATMI is 43% of our FY22e forecast.
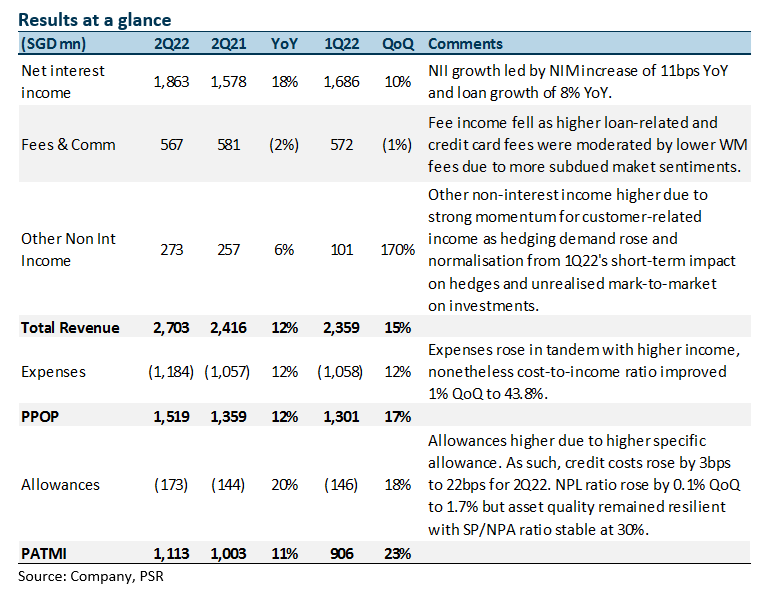
- NII was up 18% YoY from a NIM increase of 11bps YoY to 1.67% and loan growth of 8% YoY. Fee income fell 1% QoQ while other non-interest income was up 170% QoQ. Management is guiding single-digit loan growth with higher NIMs, stable cost-to-income ratio and slightly higher provisions.
- UOB has guided NIM to expand at 9bps each quarter and to reach an exit NIM of 1.90% by the end of 2022. We estimate 2H22 NII to jump 22% YoY.
- Maintain BUY with an unchanged target price of S$35.70. Our FY22e estimates remain unchanged. We assume 1.46x FY22e P/BV and ROE estimate of 11.5% in our GGM valuation. There is upside to our estimates from further GP write-backs and higher NIMs. Every 25bps rise in interest rates can raise NIM by 0.04% and PATMI by 4.3%.
The Positives
+ NII increased 18% YoY, led by steady loan growth. NII grew 18% YoY, led by continued loans growth of 8% YoY, while NIM improved 11bps YoY to 1.67%. Loan growth QoQ was mainly from term and housing loans, while YoY loan growth was broad-based across geographies as business regained momentum. UOB has lowered its guidance to mid single-digit loan growth for FY22e (previously mid to high single-digit).
+ Other non-interest income increased 170% QoQ. Other NII increased 6% YoY due to the strong momentum for customer-related income as hedging demand rose. Other NII increased 170% QoQ on the back of customer-related growth and normalisation from 1Q22’s short-term impact on hedges and unrealised mark-to-market on investments.
+ Loan fees increased 10% YoY. Fees were stable QoQ but fell 2% YoY despite loan fees growth of 3% QoQ and 10% YoY and record credit card fees as customer spending increased with borders reopening. However, this was partially offset by lower wealth and fund management due to subdued market conditions. UOB has lowered its guidance to low single-digit growth in fee income for FY22e (previously high single-digit growth).
The Negatives
– Credit costs increased by 2bps YoY. Total allowances increased by 20% YoY to S$173mn resulting in credit costs increasing by 2bps YoY to 22bps. This was mainly due to specific allowance increasing by 20% YoY to S$166mn. Total general allowance for loans, including RLARs, were prudently maintained at 0.9% of performing loans. UOB has maintained its credit cost guidance of 25bps for FY22e.
– New NPAs of S$661mn in 2Q22. New NPA formation increased by 83% YoY and 43% QoQ to S$661mn mainly due to a major but non-systemic corporate account. Resultantly, the NPL ratio rose by 0.1% to 1.7%. Nonetheless, asset quality remained resilient with SP/NPA stable at 30%. 2Q22 NPA coverage is at 91% and unsecured NPA coverage at 185%.
Outlook
PATMI: UOB’s profit should continue to grow in 2022e on the back of stabilising margins, stronger fees and lower provisions. We expect NII to expand 14% YoY. We expect credit costs to come in below guidance of 25bps. Management has said that as it is being conservative, they are not intending to write-back provisions but will not be adding a significant amount during the second half of 2022.
NIMs: Management expects improvement in NIMs only in the later part of 2022. They are expecting NIM to sustain growth at 9bps each quarter and to reach 1.90% by the end of 2022. UOB said that a 25bps rise in interest rates could raise NII by $150mn-200mn (or NIM sensitivity of 4bps for every 25bps rate hike). Assuming rate hikes totalling 100bps this year, our FY22e NII can climb S$800mn (or 11%) resulting in an increase in our FY22e PATMI by 17%.
Loan growth: Management expects to see strong demand for loans as cross-border activities pick up. ASEAN loans growth is expected to be higher with some slowdown in Singapore and North Asia. Growth so far has been skewed towards the developed markets as the ASEAN economy remains muted, but management expects this to change in 2022 as the economy recovers. UOB has guided mid single-digit loan growth for FY22e.
China exposure: UOB’s mainland China exposure stands at S$24.8bn or 5% of total assets, of which S$8.2bn is bank exposure and S$12.6bn is non-bank exposure. The top 5 domestic banks and 3 policy banks account for ~70% of total bank exposure while non-bank exposure’s client base include top-tier state-owned enterprises, large local corporates and foreign investment enterprises. Management has mentioned they have ~S$3bn in loans to mainland Chinese developers (1% of group loans) with low borrower concentration and they do not see any risk of it turning to NPL.
About the author

Glenn Thum
Research Analyst
PSR
Glenn covers the Banking and Finance sector. He has had 3 years of experience as a Credit Analyst in a Bank, where he prepared credit proposals by conducting consistent critical analysis on the business, market, country and financial information. Glenn graduated with a Bachelor of Business Management from the University of Queensland with a double major in International Business and Human Resources.


About the author
Glenn Thum
Research Analyst
PSR
Glenn covers the Banking and Finance sector. He has had 3 years of experience as a Credit Analyst in a Bank, where he prepared credit proposals by conducting consistent critical analysis on the business, market, country and financial information. Glenn graduated with a Bachelor of Business Management from the University of Queensland with a double major in International Business and Human Resources.
 Keppel DC REIT - DXC settlement offers partial relief from uncollected rents
 Apr 19th - Things to Know Before the Opening Bell
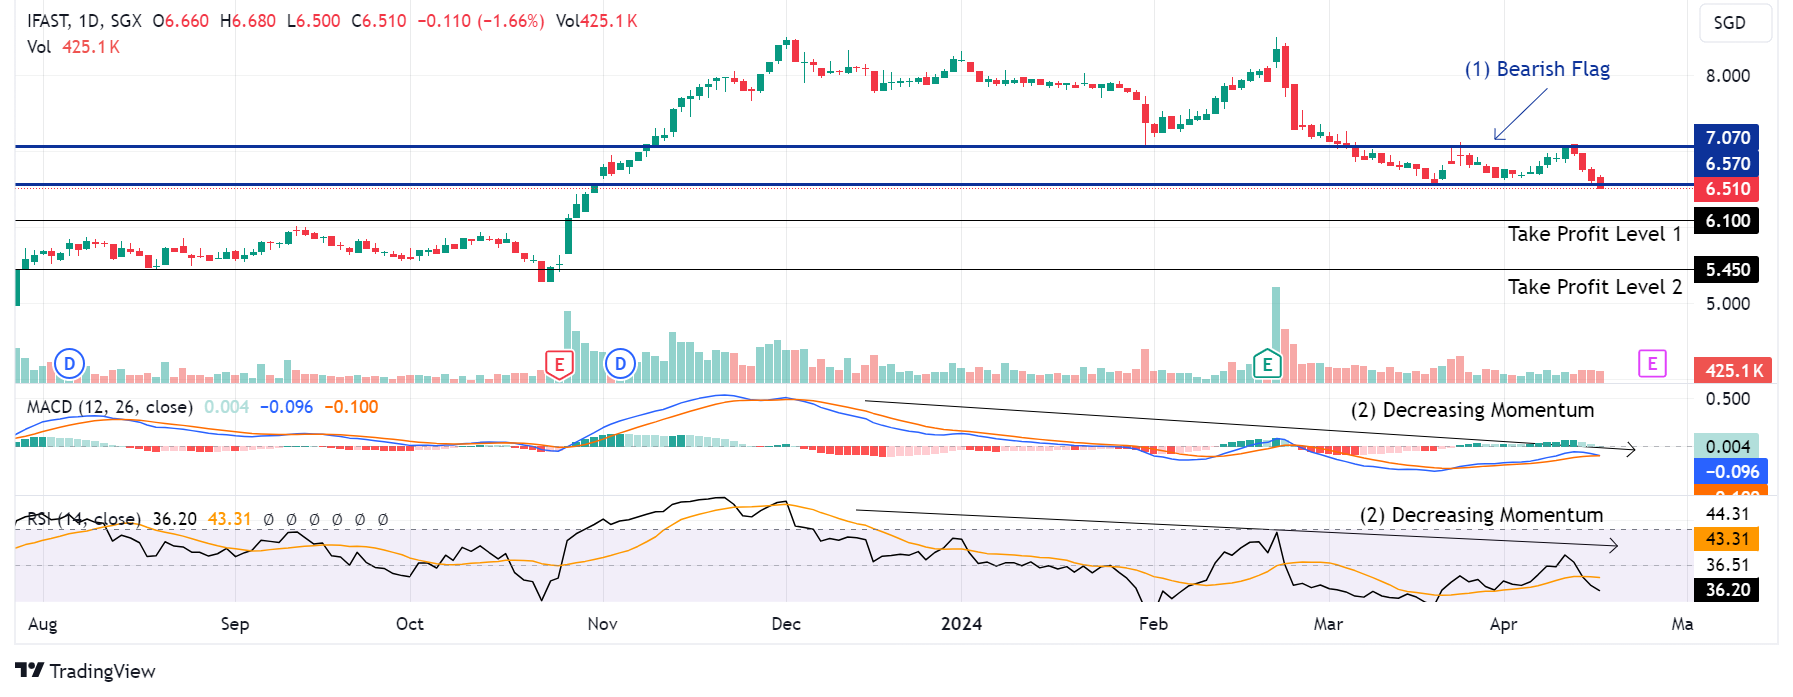 Trade of the Day - iFAST Corporation Ltd (SGX: AIY)