SGXシンガポール株式市況レポート ーアセアン各国における消費財企業がパフォーマンス牽引ー 2023, 21 July

原文:シンガポール取引所(SGX) 

原文公開日:2023年6月22日

翻訳作成日:2023年6月29日

*このレポートはシンガポール取引所が発行した、経済見通しと市場、発行体に関するレポートを日本のフィリップ証券が翻訳して作成しています。

■レポートサマリー

  • STI30銘柄に72銘柄の中小型株を加えた FTSE STオールシェア指数の年初来トータルリターンは4%となった。2019年末から起算したトータルリターンは10.9%となり、FTSE APACインデックスの8.0%をわずかに上回った。
  • FTSE STオールシェアの102銘柄のうち、84銘柄は今年これまでにシンガポールで最も取引高の多い100銘柄にランクインしている。同指数では、消費循環セクターがGenting社に率いられる形で、年初来での機関投資家の資金流入を最も多く記録しており、これは一般消費財セクターが、地域内および世界的にみても、最も堅調なパフォーマンスで推移しているセクターの3つにランクインしたのと同時期に起こったことである。
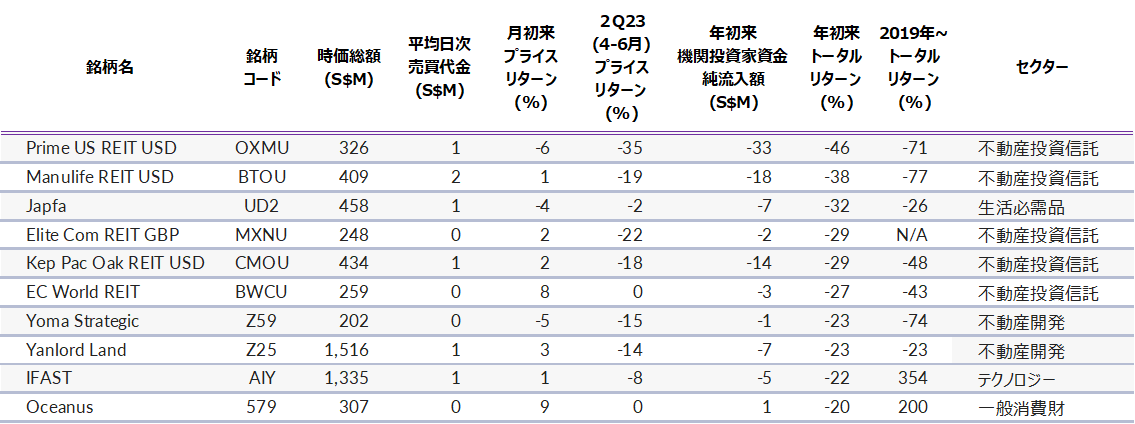
  • 当インデックスにおいてYTDで最も好調なパフォーマンスを記録したのはDelfi社であり、同社は年初来で65%のトータル・リターンを記録し、さらにシンガポール取引所で最も取引された80銘柄にランクインした。同銘柄は、インドネシアのブランド菓子製品に対する消費者の需要を背景に、2022年と2023年第1四半期に前年同期比2桁の売上成長率を記録した。

■ FTSE STオール・シェア・インデックスの主要構成銘柄と世界の類似銘柄との比較

22年下期と同様に、23年上期もストレーツタイム指数(STI)の取引レンジは300ポイントとなり、同指数は今年に入って0.9%下落。配当を加味した場合の同指数の年初来トータルリターンは1.7%となった。STIの主要30銘柄と中・小型株72銘柄で構成されるFTSE STオール・シェア・インデックスの年初来トータル・リターンは1.4%であった。FTSE STオール・シェア・インデックス102銘柄のうち、84銘柄がシンガポールで最も売買高の多い100銘柄にランクインしている。
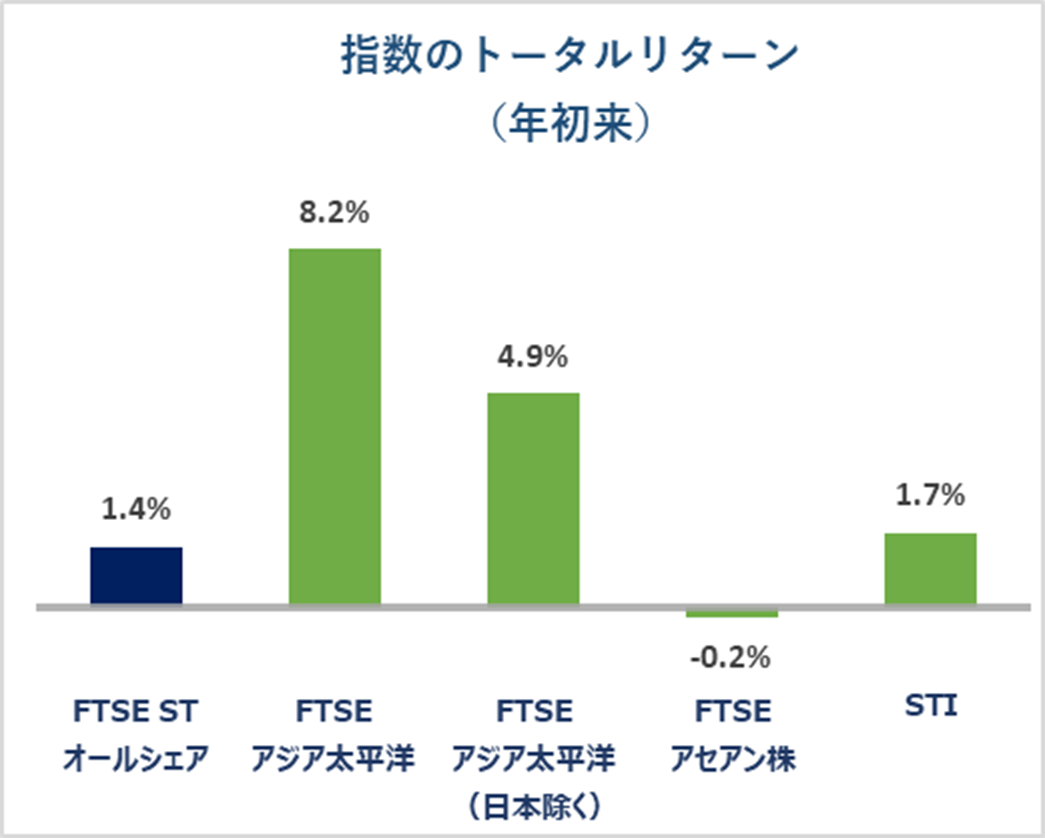
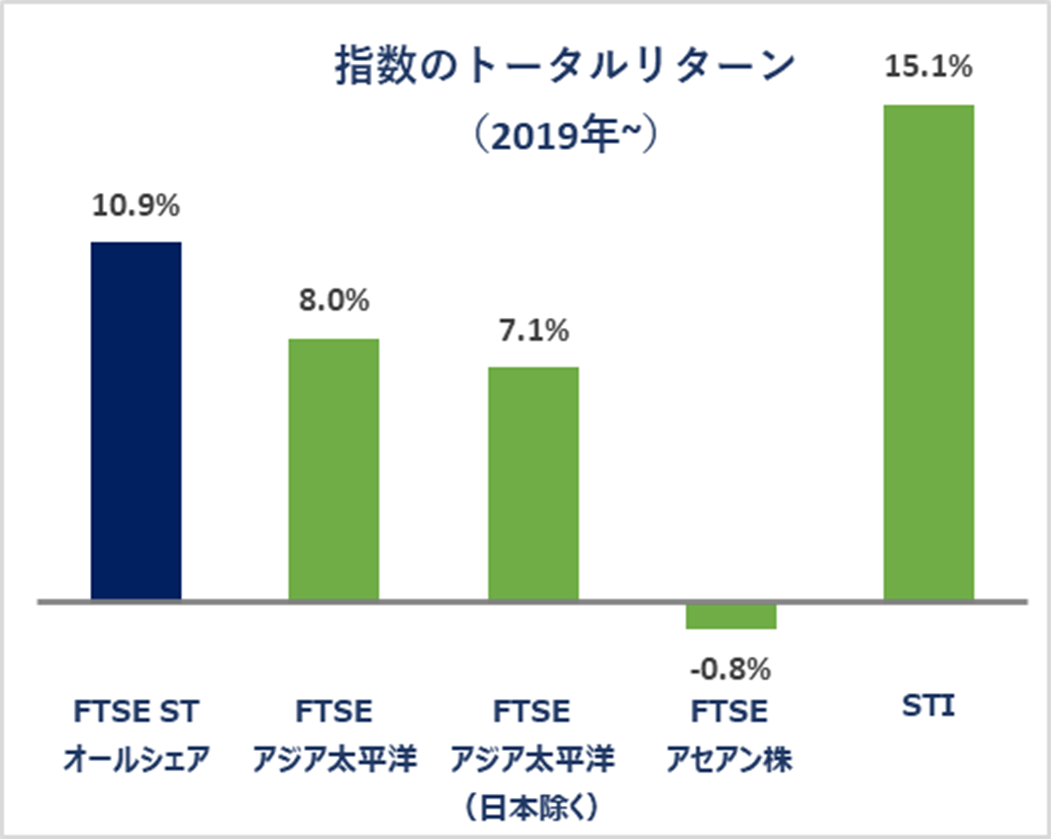
SGXシンガポール株式市況レポート ーアセアン各国における消費財企業がパフォーマンス牽引ー   SGXシンガポール株式市況レポート ーアセアン各国における消費財企業がパフォーマンス牽引ー

引用:ロイター、ブルームバーグ、FTSE(2023年6月21日終値データに基づく)


FTSE STオール・シェア・インデックスの年初来リターンが横ばいとなったタイミングは、貿易を中心とする経済の非石油国内輸出が2020年中の水準に戻った時期と一致している。同時に、金利上昇と中国の成長モメンタムの鈍化によって世界的な成長見通しが悪化しているため、23年第1四半期中の同指数のリターンは前四半期中のリターンと比べて0.4%減となったが、前年同期比では0.4%増となった。とはいえ、株価は本質的には将来的な見通しを織り込んでいくものである。23年上半期に世界株と地域株を牽引したセクターは、テクノロジー、通信、消費循環セクターなどである。これは、デジタルを活用した革新的な消費者成長というテーマに関わる、長期的な(あるいは短期的かつ近視眼的な)企業のもつ野望と矛盾するものではない。

シンガポールでは、一般消費財株式への機関投資家の資金流入が今年最も多かった。ベンチャー・コーポレーション、UMSホールディングス、AEMホールディングスで構成されるシンガポールで最も取引量の多いテクノロジー株3銘柄は、2019年末以降、ナスダック総合株価指数と歩調を合わせたトータルリターンの平均値に着地している。また、シンガポールのテレコミュニケーション企業は、2020年の最初の10ヵ月間に世界の同業他社を35%、地域の同業他社を40%アンダーパフォームした。しかし、それ以降から現在までの間に、これら世界および地域内における同業他社を25%アウトパフォームした。FTSE STオール・シェア・インデックスの5銘柄中3銘柄は年初来で、時価総額に対する機関投資家の資金流入の比率で見て、高い出来高が観測された。そうした銘柄の中には、AEM Holdings、Best World International、Genting Singaporeの3銘も含まれている。この3銘柄は23年初来で1桁台のトータル・リターンを記録した。

Delfi社は2023年年初来でFTSE STオールシェア・インデックスをリードしている。Delfi社は今年、最も取引されたシンガポール株80銘柄にランクインしており、23年初来トータル・リターンは65%だった。Delfi社の23年第1四半期の業績は、消費者需要に牽引され、インドネシアとその地域市場にまたがる自社ブランドと代理店ブランドの両方で堅調な伸びを示し、前年同期比20.8%の大幅な増収を記録した。インドネシア市場はDelfiの売上高の3分の2以上を占めており、この市場での売上は同社2022年通期決算において、前年比19.2%の売上成長を示した。

Statista社は4月、インドネシアの小売部門がアジアで急成長しており、インドネシアの国内総生産(GDP)に約13%貢献していると強調した。また、2億7000万人以上の比較的大きな人口、購買力の高い中間層の増加、習慣的に高い消費行動を行うミレニアル世代、インドネシアは小売市場にとって大きな潜在力を秘めていると付け加えた。

これと並行して、Delfi社は2023年の大半は事業の勢いが続くと予想しており、主要市場における消費者需要の成長から引き続き利益を得るため、中核ブランドの成長戦略の実行、流通能力の強化、地域事業の成長支援に引き続き注力している。当グループは、1950年代に発売されたシルバークィーンやケレス、1980年代発売のデルフィなど、インドネシアで確立されたチョコレート菓子ブランドのポートフォリオを有している。

Delfi社の株価は1.24シンガポールドルで、52週高値1.45シンガポールドルと52週安値0.67シンガポールドルの間にある。バリュエーション面では、Delfi社のPBRは2.3倍で、5年平均のPBR1.9倍より割高で取引されている一方、PERは13倍で、5年平均のPER18倍より割安で取引されている。

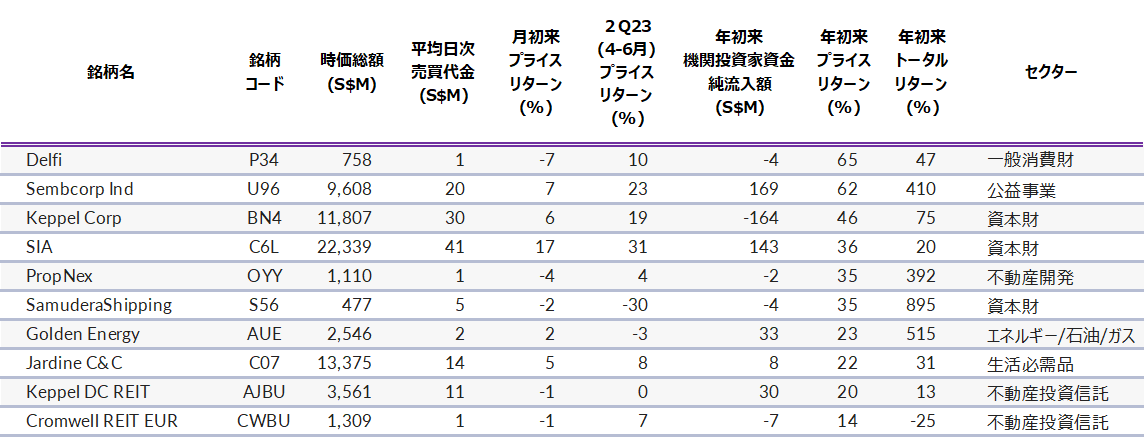
当インデックスの年初来パフォーマー上位10銘柄と下位10銘柄を以下に示す。

FTSE STオールシェア指数における年初来パフォーマンス上位10銘柄
SGXシンガポール株式市況レポート ーアセアン各国における消費財企業がパフォーマンス牽引ー

引用:ロイター、ブルームバーグ、FTSE(2023年6月21日終値データに基づく)


FTSE STオールシェア指数における年初来パフォーマンス下位10銘柄
SGXシンガポール株式市況レポート ーアセアン各国における消費財企業がパフォーマンス牽引ー

引用:ロイター、ブルームバーグ、FTSE(2023年6月21日終値データに基づく)


SGXシンガポール株式市況レポート ーアセアン各国における消費財企業がパフォーマンス牽引ー

Contact us to Open an Account

Need Assistance? Share your Details and we’ll get back to you

IMPORTANT INFORMATION

This material is provided by Phillip Capital Management (S) Ltd (“PCM”) for general information only and does not constitute a recommendation, an offer to sell, or a solicitation of any offer to invest in any of the exchange-traded fund (“ETF”) or the unit trust (“Products”) mentioned herein. It does not have any regard to your specific investment objectives, financial situation and any of your particular needs. You should read the Prospectus and the accompanying Product Highlights Sheet (“PHS”) for key features, key risks and other important information of the Products and obtain advice from a financial adviser (“FA“) pursuant to a separate engagement before making a commitment to invest in the Products. In the event that you choose not to obtain advice from a FA, you should assess whether the Products are suitable for you before proceeding to invest. A copy of the Prospectus and PHS are available from PCM, any of its Participating Dealers (“PDs“) for the ETF, or any of its authorised distributors for the unit trust managed by PCM.  

An ETF is not like a typical unit trust as the units of the ETF (the “Units“) are to be listed and traded like any share on the Singapore Exchange Securities Trading Limited (“SGX-ST”). Listing on the SGX-ST does not guarantee a liquid market for the Units which may be traded at prices above or below its NAV or may be suspended or delisted. Investors may buy or sell the Units on SGX-ST when it is listed. Investors cannot create or redeem Units directly with PCM and have no rights to request PCM to redeem or purchase their Units. Creation and redemption of Units are through PDs if investors are clients of the PDs, who have no obligation to agree to create or redeem Units on behalf of any investor and may impose terms and conditions in connection with such creation or redemption orders. Please refer to the Prospectus of the ETF for more details.  

Investments are subject to investment risks including the possible loss of the principal amount invested. The purchase of a unit in a fund is not the same as placing your money on deposit with a bank or deposit-taking company. There is no guarantee as to the amount of capital invested or return received. The value of the units and the income accruing to the units may fall or rise. Past performance is not necessarily indicative of the future or likely performance of the Products. There can be no assurance that investment objectives will be achieved.  

Where applicable, fund(s) may invest in financial derivatives and/or participate in securities lending and repurchase transactions for the purpose of hedging and/or efficient portfolio management, subject to the relevant regulatory requirements. PCM reserves the discretion to determine if currency exposure should be hedged actively, passively or not at all, in the best interest of the Products.  

The regular dividend distributions, out of either income and/or capital, are not guaranteed and subject to PCM’s discretion. Past payout yields and payments do not represent future payout yields and payments. Such dividend distributions will reduce the available capital for reinvestment and may result in an immediate decrease in the net asset value (“NAV”) of the Products. Please refer to <www.phillipfunds.com> for more information in relation to the dividend distributions.  

The information provided herein may be obtained or compiled from public and/or third party sources that PCM has no reason to believe are unreliable. Any opinion or view herein is an expression of belief of the individual author or the indicated source (as applicable) only. PCM makes no representation or warranty that such information is accurate, complete, verified or should be relied upon as such. The information does not constitute, and should not be used as a substitute for tax, legal or investment advice.  

The information herein are not for any person in any jurisdiction or country where such distribution or availability for use would contravene any applicable law or regulation or would subject PCM to any registration or licensing requirement in such jurisdiction or country. The Products is not offered to U.S. Persons. PhillipCapital Group of Companies, including PCM, their affiliates and/or their officers, directors and/or employees may own or have positions in the Products. Any member of the PhillipCapital Group of Companies may have acted upon or used the information, analyses and opinions herein before they have been published. 

This advertisement has not been reviewed by the Monetary Authority of Singapore.  


Phillip Capital Management (S) Ltd (Co. Reg. No. 199905233W)  
250 North Bridge Road #06-00, Raffles City Tower ,Singapore 179101 
Tel: (65) 6230 8133 Fax: (65) 65383066 www.phillipfunds.com