How to Spot, Enter and Ride a Trend
May 10, 2021The trend is your friend. This is common knowledge to all traders.
It means trading in the direction of the trend. Trading with the trend gives you a higher probability of profiting from the market.
If 100 people want to take the elevator up and only two want to get down, I would gladly join the 100, as the direction is probably up.
Before you trade, you need to know the trend. On some days, the trend may be up; on others, it may be down. Yet on some other days, stocks trade sideways.
You would want to be riding the trend.
Remember, the trend is your friend!
But how do you tell the trend?
We suggest three methods.
Method 1: Price Action
Uptrend: Higher Highs and Higher Lows
A simple method is to look at price actions.
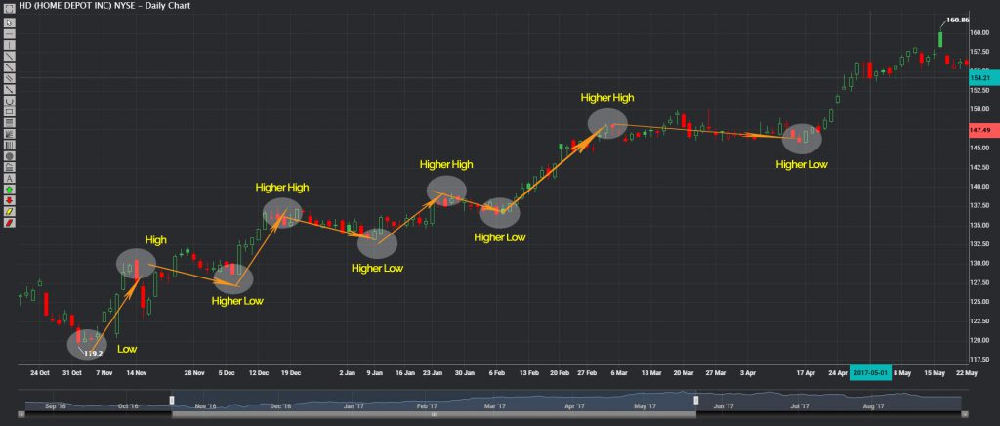
Fig 1: phillipcfd.com – higher highs and higher lows
Notice the higher highs and higher lows. This signals to investors that prices are on an uptrend. The probability favours investors who are buying the shares.
Downtrend: Lower Highs and Lower Lows
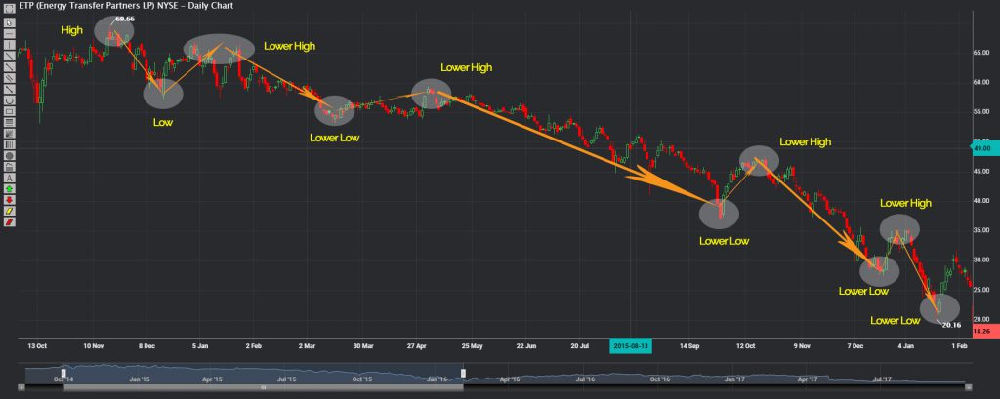
Fig 2: phillipcfd.com – lower highs and lower lows
If you see lower highs and lower lows, you would want to stay out of the market and not buy the stock – unless you are shorting the market.
Method 2: Moving Averages
If the trend is up, the average price of a stock should be up as well.
With the help of moving averages, we can filter out the noise.
What noise? Check out the image below.
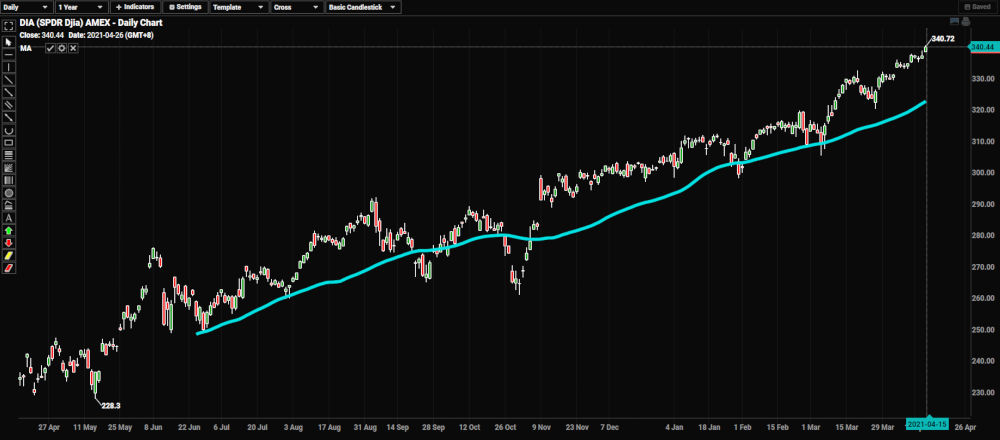
Fig 3: POEMS 2.0 – 50-day moving-average uptrend
The Dow Jones Index is on an uptrend, as you can see.
Although the trend is up, prices do not move up in one straight line. They whip up and down, making higher highs and higher lows as they climb.
With the 50-day moving average, you are able to tell the trend.
Why 50 days? Most professionals use this, which is also known as the 50-day MA.
How do you use the 50-day MA to tell an uptrend?
#1 Prices are above the MA.
#2 The moving average is sloping up.
Similarly for downtrends, we have the image below.
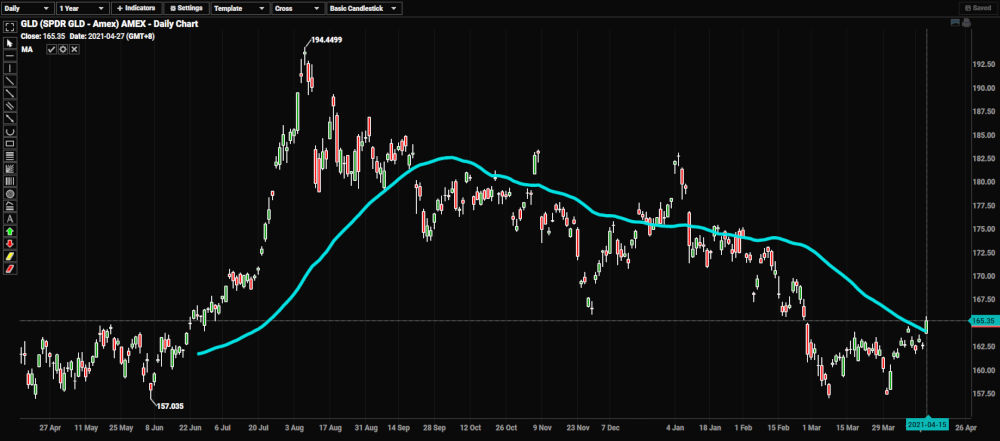
Fig 4: POEMS 2.0 – 50-day moving-average downtrend
See how the prices of the SPDR Gold Trust are trending down.
Once again, prices are below the 50-day MA and the MA is sloping down.
If you are new to trading and investing, MAs will help you filter out the noise by smoothening out prices and presenting trends nicely to you.
Method 3: Moving Average Crossovers
Sometimes, prices move above the MA and come back down in a sideways manner. This tells us that the trend is neither up nor down
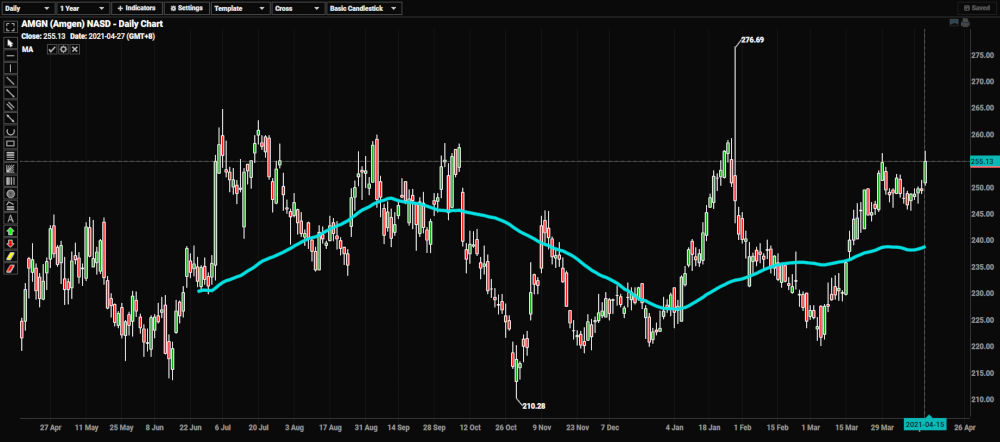
Fig 5: POEMS 2.0 – 50-day moving-average moving sideways
When prices are going sideways, it may be hard to tell whether they are moving above or below their 50-day MA.
One other method traders fall back on is the moving average crossover.
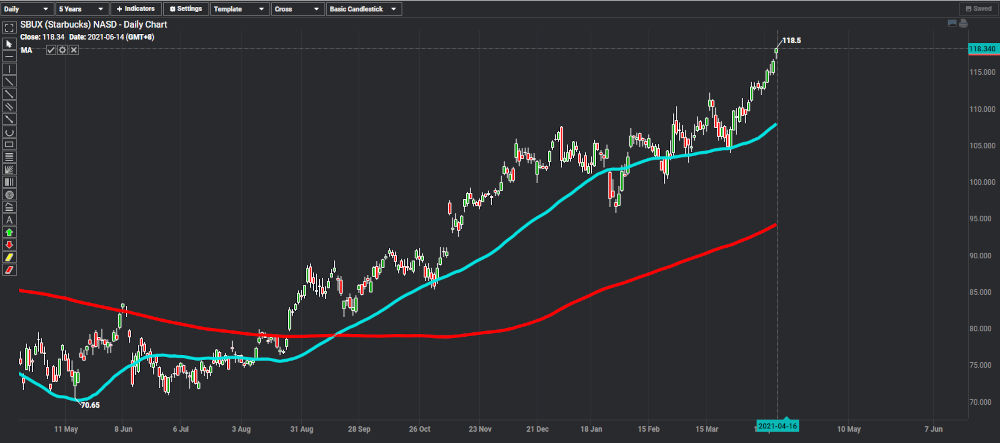
Fig 6: POEMS 2.0 – 50-day and 200-day moving-average uptrends
The above image shows Starbuck’s charts with 200-day and 50-day MAs.
The 200-day MA is illustrated in red and the 50-day MA in blue.
When the 50-day MA crosses above the 200-day MA, we deem it an uptrend.
When it crosses below, we deem it a downtrend.
When the 50-day MA crosses above the 200-day MA and is followed by the MAs turning up, the uptrend is confirmed.
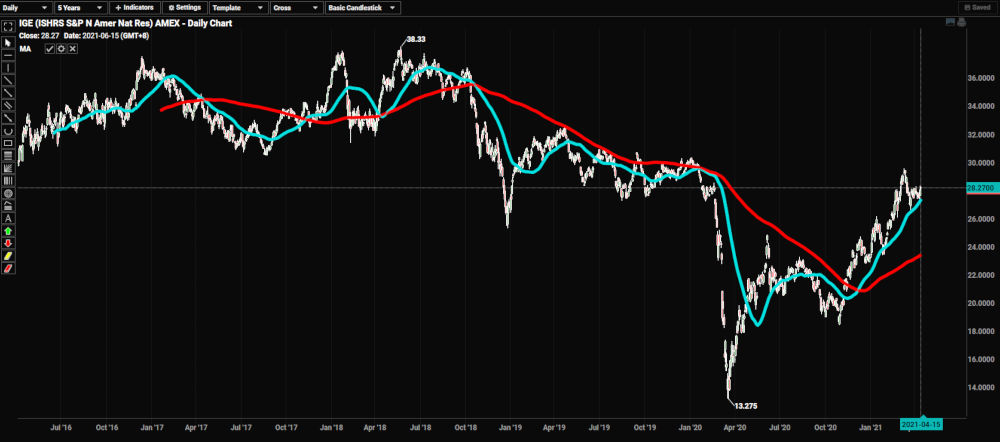
Fig 7: POEMS 2.0 – 50-day and 200-day moving-average downtrends
Above is an image of a downward crossover.
Notice the slope of the MAs turning down, confirming the downtrend.
When To Enter?
Now that we can tell the trend, when is a good time to enter? How do we put the above into practice?
Sometimes, you tell the trend correctly, buy the stock and the price comes back down immediately. This can be very frustrating.
As a follow-on of our previous article on Electric Vehicles (EV), we shall try to tell the trend with moving averages.
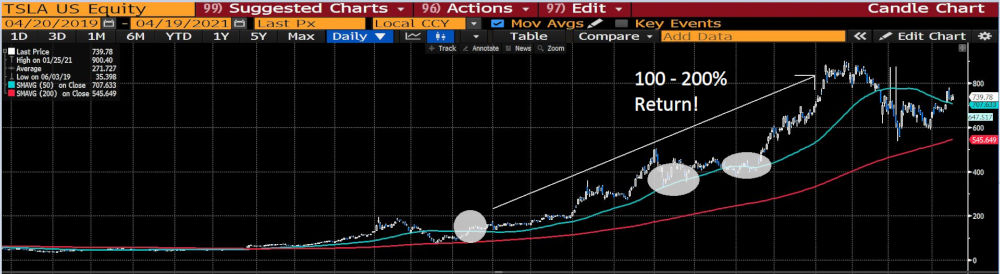
Fig 8: Bloomberg – Tesla’s uptrend
Tesla’s 50-day MA has crossed above its 200-day MA. Both lines are sloping to the upside, so we know the trend is up.
A good time to enter would be when prices touch or move below the 50-day MA and close above this, while staying above the 200-day MA.
Any investor made an entry based on the above would have made at least a 100-200% return in less than five years!
Recap
Let’s recap the three methods to identify uptrends…
- #1 Higher highs and higher lows (lower highs and lower lows)
- #2 Prices above MA (below MA) and sloping up (sloping down)
- #3 50-day MA crossing above 200-day MA and sloping up
and downtrends!
- #1 Lower highs and lower lows
- #2 Prices below MA and sloping down
- #3 50-day MA crossing below 200-day MA and sloping down
To trade with the trend, you need a platform complete with real-time streaming charts, powerful technical indicators and fully customizable chart tools. These can be found on POEMS, which is suitable for anyone looking to navigate markets and monitor real-time price movements.
Trade with confidence on POEMS’ award-winning suite of trading platforms, with a trusted broker that is regulated by the Monetary Authority of Singapore (MAS). We are present in 15 countries, including Indonesia, Malaysia, Singapore and the US. POEMS offers investors free live prices* for the Singapore, Japan, Malaysia and US stock markets with 24/5 trading support! Explore our array of financial products at brokerage fees as low as USD1.88 flat when you open a Cash Plus Account with us today.
Open a Cash Plus account with POEMS
Phillip Securities Pte Ltd (a member of PhillipCapital) has over 50 years of trading heritage and is regulated by the Monetary Authority of Singapore (MAS).
- Trade US shares starting from a flat rate of 1.88 USD
- Access over 40,000 products across more than 26 exchanges worldwide
- No platform, custody or account maintenance fee*
- Free LIVE price quotes* for US, Indonesia, Malaysia and more
About the author
Chua Minghan
Assistant Manager, Dealing
Minghan graduated from the National University of Singapore with a Bachelor’s degree in Economics. He is passionate about education and went on to get a post-grad Diploma in teaching. His vision is to educate clients to make informed decisions for their trading and investments. Minghan enjoys learning fundamental analysis, technical analysis, and strives to use data analysis to improve his trading skills.