Sector Highlight: Powering the Future with Electric Vehicles July 24, 2025

The electric vehicle (EV) industry is entering a new phase of growth, marked by rapid innovation and expanding global adoption, strongly supported by policies amidst rising geopolitical challenges. Here, we explore the latest developments, key growth drivers and players, policies and more as investors navigate towards a rapidly evolving EV landscape.
Outlook
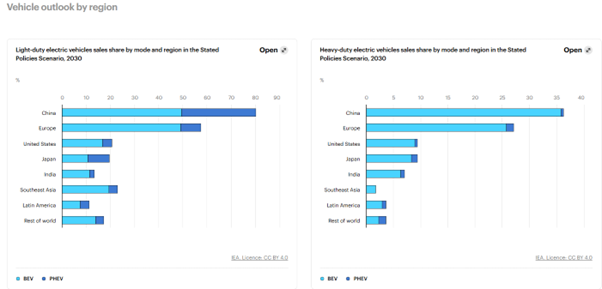 Figure 1. Predicted Light and Heavy Duty Electric Vehicle regional sales in 2030 (Source: IEA.org)
Here is a breakdown of the EV landscape growth & market share:
- According to IEA, EV sales are projected to grow over 25% in 2025, after having reached 17 million units in 2024
- By 2030, EVs are expected to make up 35% of all car sales. This will mostly be driven by sales in China (which accounted for 60% of global EV sales in 2024), Europe and United States (supported by IRA tax credits)
- Key Policy support:
– US Inflation Reduction Act (IRA): provides tax credits and subsidies for EV buyers and manufacturers, which lowers the cost of EV ownership and boosts domestic demand
– EU 2035 Internal Combustion Engine (ICE) ban: planned ban on the sale of new petrol and diesel vehicles by 2035 sets a clear regulatory deadline that accelerates the transition to EVs
Key Enablers
- Battery prices fallen by approximately 15% since 2022 (~$130/kWh): this reduction is driven by lower lithium prices and rising adoption of lithium iron phosphate (LFP) batteries. In fact, LFP batteries now power nearly half of all EVs, offering a cost-effective and stable alternative to nickel-based chemistries.
- Emerging markets gaining ground: countries such as India, Brazil, and those in Southeast Asia are experiencing some of the fastest growth in EV adoption.
Challenges Ahead
- Supply chain bottlenecks: Rare earth elements such as lithium pose a constraint on scaling production
- Uneven charging infrastructure: the global rollout of EV charging infrastructure remains uneven, with significant disparities between urban and rural areas, as well as between developed and developing economies
- Geopolitical risks: disruptions in key supply chains or shift in international policy could delay progress
Impact and Outlook
- By 2030, EVs are projected to displace 5 million barrels of oil, daily: this shows a significant shift in transport-related energy consumption. To sustain this momentum, continued policy and industry support are essential, including investment in technological innovation, such as solid-state batteries, building resilient and diversified mineral supply chains, and ensuring the transition to electric mobility is equitable across regions.
- Battery demand is projected to triple from 1 terawatt-hour (TWh) in 2024 to 3 TWh by 2030 under the International Energy Agency’s Stated Policies Scenario (STEPS), which reflects existing policy commitments and market trends. Electric cars will continue to be the dominant force behind this growth, but the share of Electric trucks’ battery is also expected to expand significantly from around 3% in 2024 to over 8% in 2030
Trends in Electric Car markets
Sales
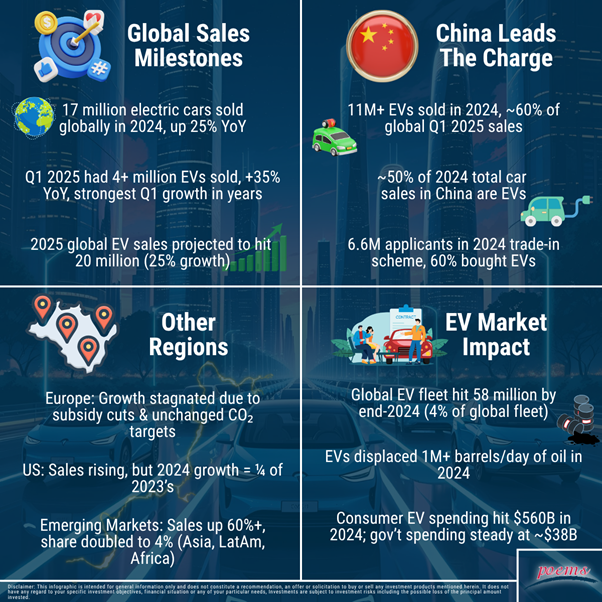
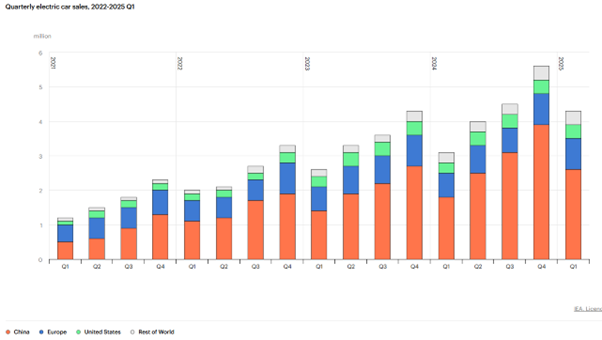 Figure 2. Quarterly electronic car sales. (Source: IEA.org)
Exporters
China and the European Union are the world’s largest EV exporters, while Mexico have ramp up exports to the United States. However, the volume of trade remains unpredictable due to the looming threat of 30% tariffs from the United States on Mexico.
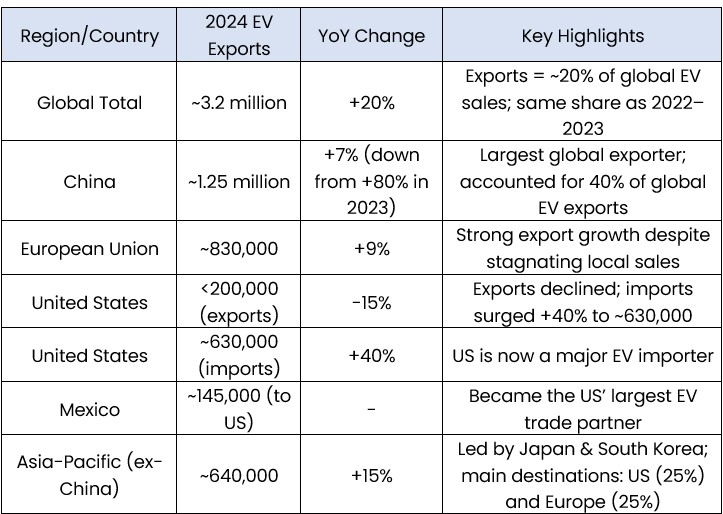
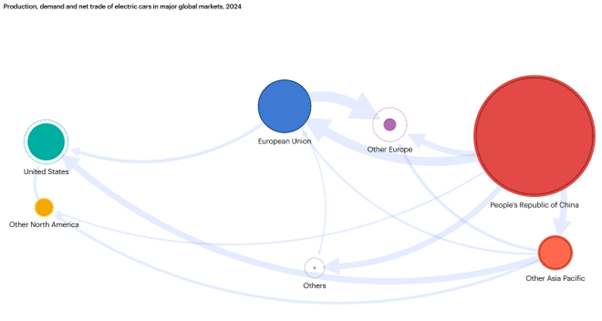 Figure 3. Production and net trade of electric cars in global markets. (Source: IEA.org)
Number of Models
In 2024, the variety of electric car models available globally reached close to 785, an approximate increase of 15%. Although the number of EV models still trails behind traditional Internal Combustion Engine (ICE) and Hybrid Electric Vehicle (HEV) offerings—by around 50%—this disparity is narrowing. Based on announcements from major automakers, this disparity is projected to shrink to 30% by 2027.
Europe led the pack in expanding model variety, with offerings growing from about 290 models to over 360 in the past year. This momentum is expected to continue and potentially double e by 2026.
Stricter emissions regulations in the EU are prompting automakers to ramp up EV production, with over 140 new models anticipated to launch. Notably, Volkswagen and Stellantis have outlined plans to collectively roll out around 35 electric models by 2026.
Battery Range and Chargers
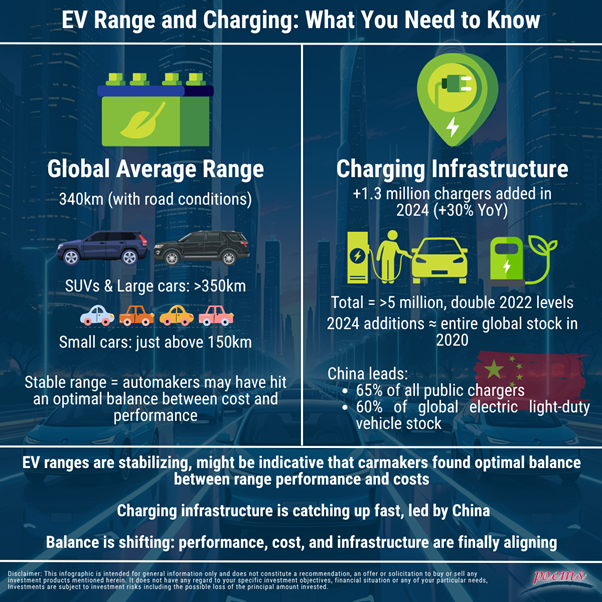
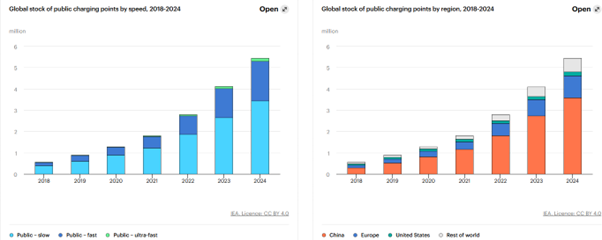 Figure 4. Global stock of public charging points by speed and region. (Source: IEA.org)
Fast Charging Tech, a Timeline
2023 – CATL Shenxing V1
- 30% charge in 5 minutes added 200km range
- Comparable to Tesla Supercharger, which added 100km in 5 minutes
2024 – CATL + SAIC-GM
- 40% charge in 5 minutes
- 30% in 5 minutes, but with higher density of charge, which added 300km range
March 2025 – BYD Super-e Platform
- 400km in 5 minutes, enabled by:
-Silicon carbide chips
-All-liquid cooling
-1,000V architecture
-1 MW charging
April 2025 – CATL Shenxing V2
- Even faster charging (same density) than the V1
- First passenger cars with megawatt charging went on sale in China
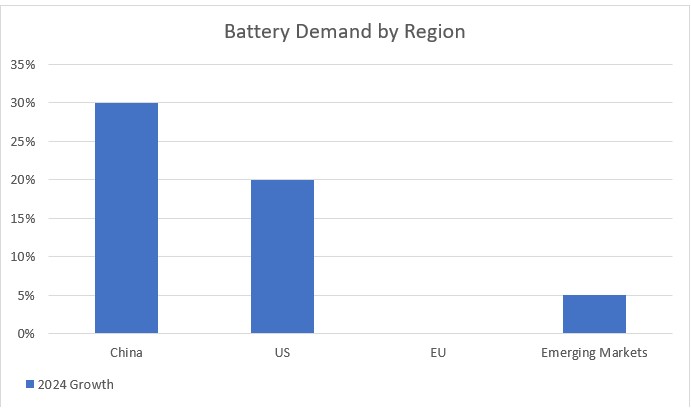 Figure 5. EV Battery Demand by region. (Source: IEA.org)
Chinese EV Market Turmoil Following BYD’s Aggressive Pricing Strategy
China’s EV market has entered a period of heightened volatility following BYD’s aggressive pricing strategy, which included slashing prices by up to 34% on select models. This move triggered a broad selloff across the sector, with many EV stocks falling over 10%.
BYD’s approach prioritises market share over short-term profitability and is supported by its strong vertical integration, substantial government backing, and recent sales momentum; having surpassed Tesla sales in both China and Europe. However, this strategy carries significant short-term risks, particularly margin compression across the industry.
Smaller EV manufacturers, which lack BYD’s scale and cost efficiency, are especially exposed. Major competitors such as Tesla, NIO, Xpeng, and Li Auto have responded with comparable price cuts, further intensifying competitive pressure and raising fears of a prolonged price war and faster-than-expected industry consolidation.
Despite these challenges, the long-term outlook for EV remains robust. Demand is underpinned by accelerating global adoption trends, continued government subsidies and advancement is battery and charging technology. BYD is ultimately wagering that increased volume will offset its margin sacrifices, positioning itself to emerge even more dominant in a post-shakeout market increasingly dominated by large-scaled players like BYD and Tesla.
In Summary:
- The global EV charging infrastructure is experiencing significant expansion, driven by increased EV sales and government policies
- Increased in charging speed technology, along with cheaper battery costs are improving EV affordability and convenience
- Rapid growth in EV sales globally
- Expansion EV adoption continues to reduce oil demand
Negatives for the EV sector:
- YTD, the Global EV market has declined. Both the Global X Autonomous & Electric Vehicles ETF (DRIV) saw a 4.75% drop while the KraneShares Electric Vehicles and Future Mobility Index ETF (KARS) had a 1.48% decline.
- EV market price war driven by aggressive competition and falling battery cost
- Rapid growth in EV sales globally
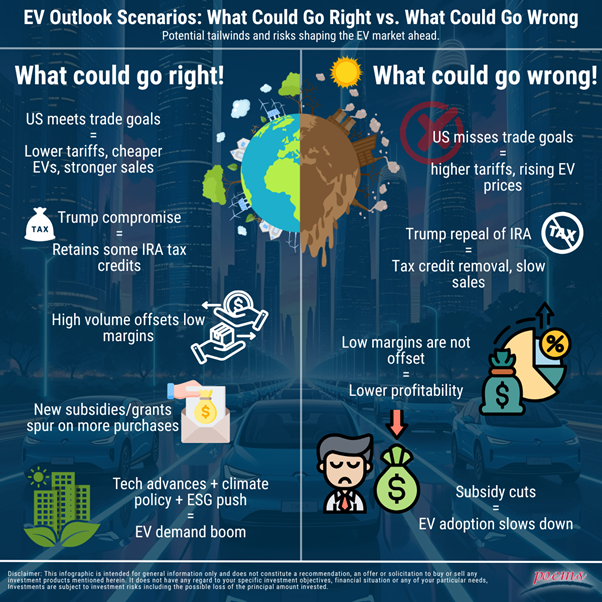
- The trade war’s impact extends far beyond the borders of the US and China, severely disrupting global EV supply chains. Notably, US has imposed a 30% tariff on goods from mainland China and a staggering 102.5% tariff specifically on China EVs.
- Potential rollback of supportive US policies under the Trump administration could slow progress:
- Possible cuts to federal funding for NEVI (National EV Infrastructure Program) will slow charger installations
- Risk of overturning Biden’s EPA’s 2032 EV Mandate (67% of new car sales must be EVs)
- Inflation Reduction Act (IRA) Tax Credits ($7,500 per EV) might be repealed or restricted
- Push for complete domestic manufacturing of EVs which could raise production costs
With the EV industry brimming with potential, investors can also tap into this trend through a range of ETFs that track various markets and companies actively involved in the EV industry! Learn more with our ETF screener here!
CATL HK IPO
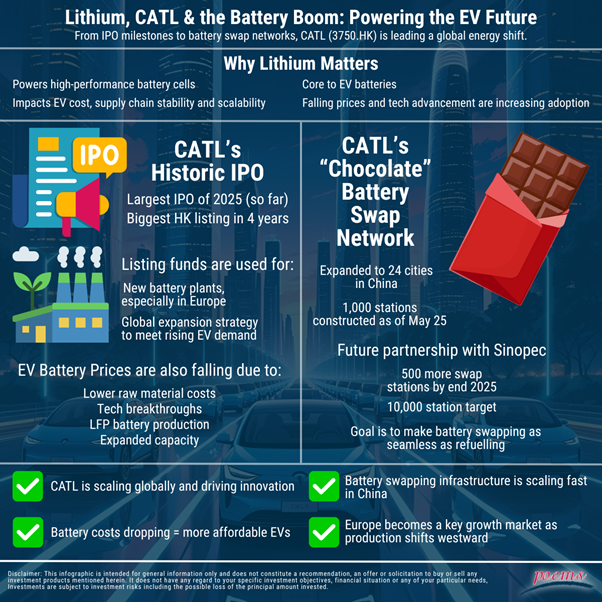
A standout example is the Hong Kong listing of CATL (Contemporary Amperex Technology Co. Limited), which marked the largest IPO fundraise of 2025, raising approximately US$5 billion (CATL was available on POEMS HK Pre-IPO trading one day before listing! Learn more here! The proceeds are earmarked to accelerate CATL’s global expansion plans, namely, the construction of new battery manufacturing plants across Asia, Europe, and Latin America to meet the surging global demand for EVs. As the world’s largest EV battery supplier, CATL is strategically enhancing its production capabilities to maintain its leadership in the energy storage sector. The company is also rapidly rolling out its next-generation “Chocolate” battery swap network in China, a modular solution designed to enable EV drivers to swap depleted batteries for fully charged ones in under a minute. This initiative is bolstered by a strategic partnership with Sinopec, leveraging its vast petrol station network to scale battery swap stations nationwide. CATL’s innovations and expansion highlight the central role battery leaders play in supporting a more sustainable, electrified future and present compelling opportunities for investors seeking exposure to the EV value chain.
Start trading on POEMS!Open a free account here!

Take this opportunity to expand your trading portfolio with our wide range of products including Stocks, CFDs, ETFs, Unit Trusts and more across 15 global exchanges available for you anytime and anywhere to elevate you as a better trader using our POEMS Mobile 3 App!
Appendix:
- [1] https://www.aastocks.com/en/stocks/news/aafn-news/NOW.1443584/3
- [2] http://www.aastocks.com/en/stocks/news/aafn-con/NOW.1443669/popular-news/AAFN
- [3] http://www.aastocks.com/en/stocks/news/aafn-con/NOW.1444280/popular-news/AAFN
- [4] https://www.iea.org/reports/global-ev-outlook-2025
- [5] https://evmagazine.com/news/china-us-trade-war-sparks-global-ev-industry-shakeup
- [6] https://www.caranddriver.com/news/a64772345/proposed-house-budget-kills-ev-credits/
- [7] https://www.reuters.com/business/autos-transportation/eu-china-start-talks-lifting-eu-tariffs-chinese-electric-vehicles-handelsblatt-2025-04-10/
- [8] https://www.reuters.com/business/autos-transportation/trump-says-automakers-tesla-must-build-cars-parts-us-2025-05-30/
- [9] https://rosagalvez.ca/en/initiatives/climate-accountability/list-of-countries-with-net-zero-commitments-and-climate-accountability-legislation/
- [10] https://www.iea.org/reports/global-energy-and-climate-model/stated-policies-scenario-steps
- [11] https://www.nytimes.com/2025/07/16/world/americas/trump-tariffs-mexico-cartels.html
Disclaimer
These commentaries are intended for general circulation and do not have regard to the specific investment objectives, financial situation and particular needs of any person. Accordingly, no warranty whatsoever is given and no liability whatsoever is accepted for any loss arising whether directly or indirectly as a result of any person acting based on this information. You should seek advice from a financial adviser regarding the suitability of any investment product(s) mentioned herein, taking into account your specific investment objectives, financial situation or particular needs, before making a commitment to invest in such products.
Opinions expressed in these commentaries are subject to change without notice. Investments are subject to investment risks including the possible loss of the principal amount invested. The value of units in any fund and the income from them may fall as well as rise. Past performance figures as well as any projection or forecast used in these commentaries are not necessarily indicative of future or likely performance.
Phillip Securities Pte Ltd (PSPL), its directors, connected persons or employees may from time to time have an interest in the financial instruments mentioned in these commentaries.
The information contained in these commentaries has been obtained from public sources which PSPL has no reason to believe are unreliable and any analysis, forecasts, projections, expectations and opinions (collectively the “Research”) contained in these commentaries are based on such information and are expressions of belief only. PSPL has not verified this information and no representation or warranty, express or implied, is made that such information or Research is accurate, complete or verified or should be relied upon as such. Any such information or Research contained in these commentaries are subject to change, and PSPL shall not have any responsibility to maintain the information or Research made available or to supply any corrections, updates or releases in connection therewith. In no event will PSPL be liable for any special, indirect, incidental or consequential damages which may be incurred from the use of the information or Research made available, even if it has been advised of the possibility of such damages. The companies and their employees mentioned in these commentaries cannot be held liable for any errors, inaccuracies and/or omissions howsoever caused. Any opinion or advice herein is made on a general basis and is subject to change without notice. The information provided in these commentaries may contain optimistic statements regarding future events or future financial performance of countries, markets or companies. You must make your own financial assessment of the relevance, accuracy and adequacy of the information provided in these commentaries.
Views and any strategies described in these commentaries may not be suitable for all investors. Opinions expressed herein may differ from the opinions expressed by other units of PSPL or its connected persons and associates. Any reference to or discussion of investment products or commodities in these commentaries is purely for illustrative purposes only and must not be construed as a recommendation, an offer or solicitation for the subscription, purchase or sale of the investment products or commodities mentioned.
This advertisement has not been reviewed by the Monetary Authority of Singapore.
About the author
Global Markets Desk (Asia Market)
The Global Markets Desk Asia Market Dealing team specializes in managing Asia Markets, covering key regions like Greater China, Malaysia, Japan, Thailand, and others. In addition to executing client orders, they also provide educational content through market journals and webinars, offering insights into macroeconomics, stock picks, and technical analyses for the Asia market landscape.

 Reddit Inc.: Transforming Community Engagement into Revenue Growth
  CNMC Goldmine Holdings: Phillip Securities Maintains BUY Rating Amid Production Expansion
  Experiences segment is primary growth driverPhillip Securities Research Initiates Coverage of Disney with Accumulate Rating
  Singapore Market Outlook 2026: Phillip Securities Forecast


