The Rebound of Japanese Stock Market August 23, 2024
In this article, we will explore the history of the Japanese economy1 from Japan’s miracle economic growth to the bursting of its asset price bubble, and the recent highs of the Nikkei 225 We will examine the insights investors can glean from Japan’s economic journey and what it means for the future of both Japan and the global economy.
Japan’s economic history and stock market are often described as extraordinary, for being ahead of their time. Japan was one of the first developed countries to adopt central bank monetary policies that are widely used today, including Quantitative Easing (QE), Prolong Negative interest rates, yield curve control, currency rate control and more2.
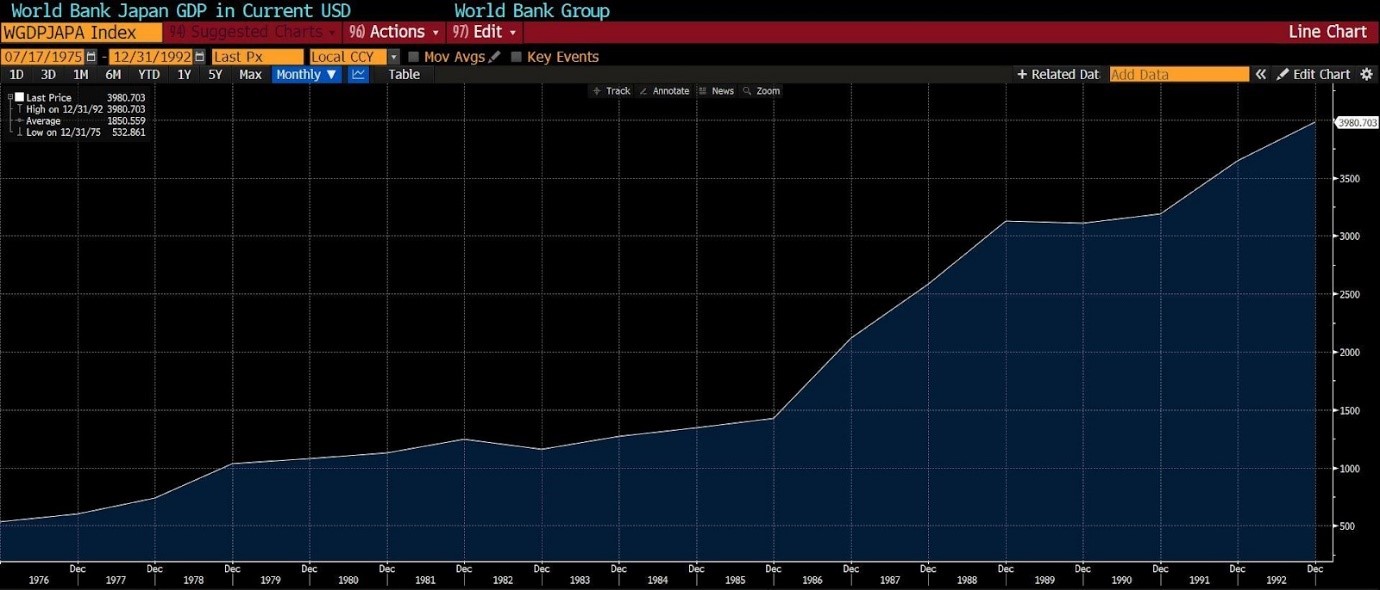
Between 1975 and 1992, Japan experienced one of the most significant periods of economic expansion in modern history. Many Japanese businesses focused on gaining market share rather than prioritising short-term profits, which led them to expand into high growth sectors such as electronics and technology3. The Bank of Japan (BOJ) played a key role during this period by using “window guidance” as an instrument of monetary policy to influence and regulate the supply of credit to targeted industries or sectors4. This approach helped sectors like electronics and technology receive sufficient credit at preferential rates, contributing to the massive expansion of Japan’s overall economy. Furthermore, by integrating robots, innovative manufacturing systems and improving efficiency, Japan’s GDP expanded eight folds between 1975 and 1992, as seen in the graph below:
 Source: Bloomberg
In the late 1990s, Japan’s property asset bubble had inflated to such an extent that the theoretical land value of Japan was estimated to be four times greater than the total land value of the United States (US)– despite the US being approximately 25 times larger than Japan5. With sentiments of both domestic and foreign investors at an all-time high, top analyst were forecasting Japan’s economy would soon overtake that of the US. For comparison, Japan’s GDP was only 39% of US’ GDP in 1980, but by 1995, Japan’s GDP had risen to 71% of the US’ GDP6.
Japanese companies were reporting impressive profit growth with their shares accounting for 45% of the global stock market, compared to US shares that accounted for 33%7. The average price-to-earnings (PE) ratio for Japanese companies was around 60, compared to about 15 for US companies. This was partly due to a financial engineering practice called “zaitech” where corporations with cheap credit would use their cash reserves to speculate on stocks and other risky assets8. Furthermore, accounting standards at that time allowed companies to record capital gains as income, which inflated their profits. This, in turn, enabled them to borrow more, perpetuating the cycle. By the end of the 1980s, it was estimated that 40-50% of corporate profits in Japan were derived from “zaitech”9.
However, this period of inflated asset prices came to a sudden halt when the BOJ decided to crack down on the shadow banking system and tighten monetary policy by raising interest rates to combat inflation10. Japanese companies, burdened with large amounts of corporate debt accumulated during the window guidance period, found themselves facing steep interest and refinancing costs as interest rates rose. At the same time, property prices began to plummet, leaving homeowners with significant debt. The aftermath of the asset bubble’s burst led to Japan’s GDP growing at a much slower pace than that of its peers, while equity prices dropped by 60%, and land values by 70%11.
What followed was a prolonged period of deflation and expectations, which economists have termed the “Lost Decade.” This period, lasting approximately from 1991 to 2010 and even until 2021 by some measures, saw Japan’s economy stagnate12. During this time, wages and prices remained largely unchanged for over 20 years. To some, it might have seen beneficial in terms of increased purchasing power as prices stayed the same or even decreased. However, for an economy to experience long-term deflation, detrimental effects would start to appear. As consumers expected further deflation, they were incentivised to delay purchases and prioritise saving, leading to reduced consumption. This resulted in businesses dialling back on expansion and reduced capital expenditure for new plants and increased production capabilities. The result is a vicious cycle of deflationary expectations and economic slowdown.
Moreover, Japan’s ageing population exacerbated the situation, with fewer young people entering the workforce each year, further reducing the overall productive capacity of the economy.
The Japanese government and the BOJ have made numerous attempts to break out of the deflationary spiral by adopting drastic monetary and fiscal policies. One of the most notable efforts was introduced by the late Prime minister Shinzo Abe in 2012. Known as “Abenomics” by western economists, the strategy comprised three “arrows”13:
- Increasing money supply through increased printing of Japanese currency
- Creating fiscal stimulus through government spending to spur demand
- Undertaking economic and regulatory reforms to make Japan more competitive in the global market
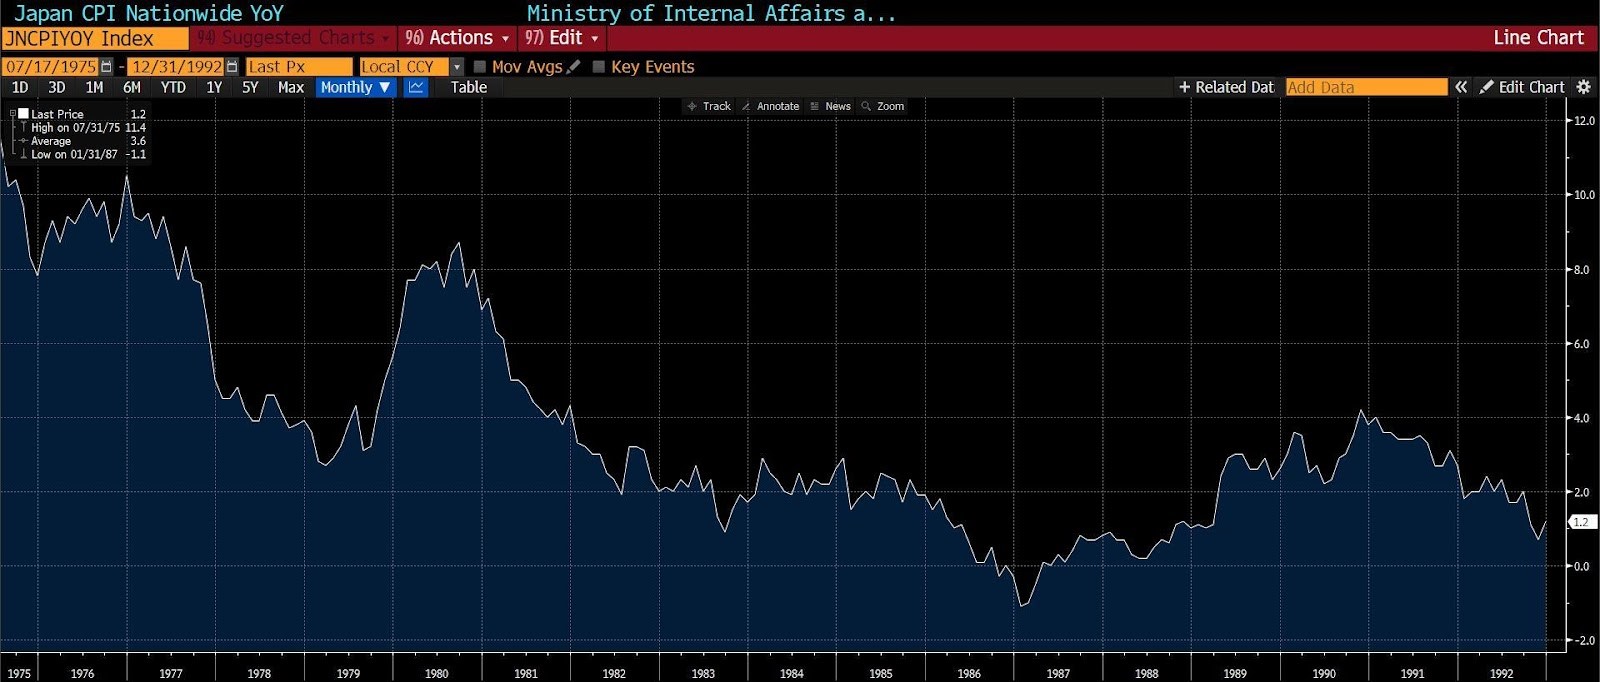
Despite these bold measures, the Japanese economy still struggled to maintain the 2% inflation target, as illustrated in the graph below:
 Source: Bloomberg
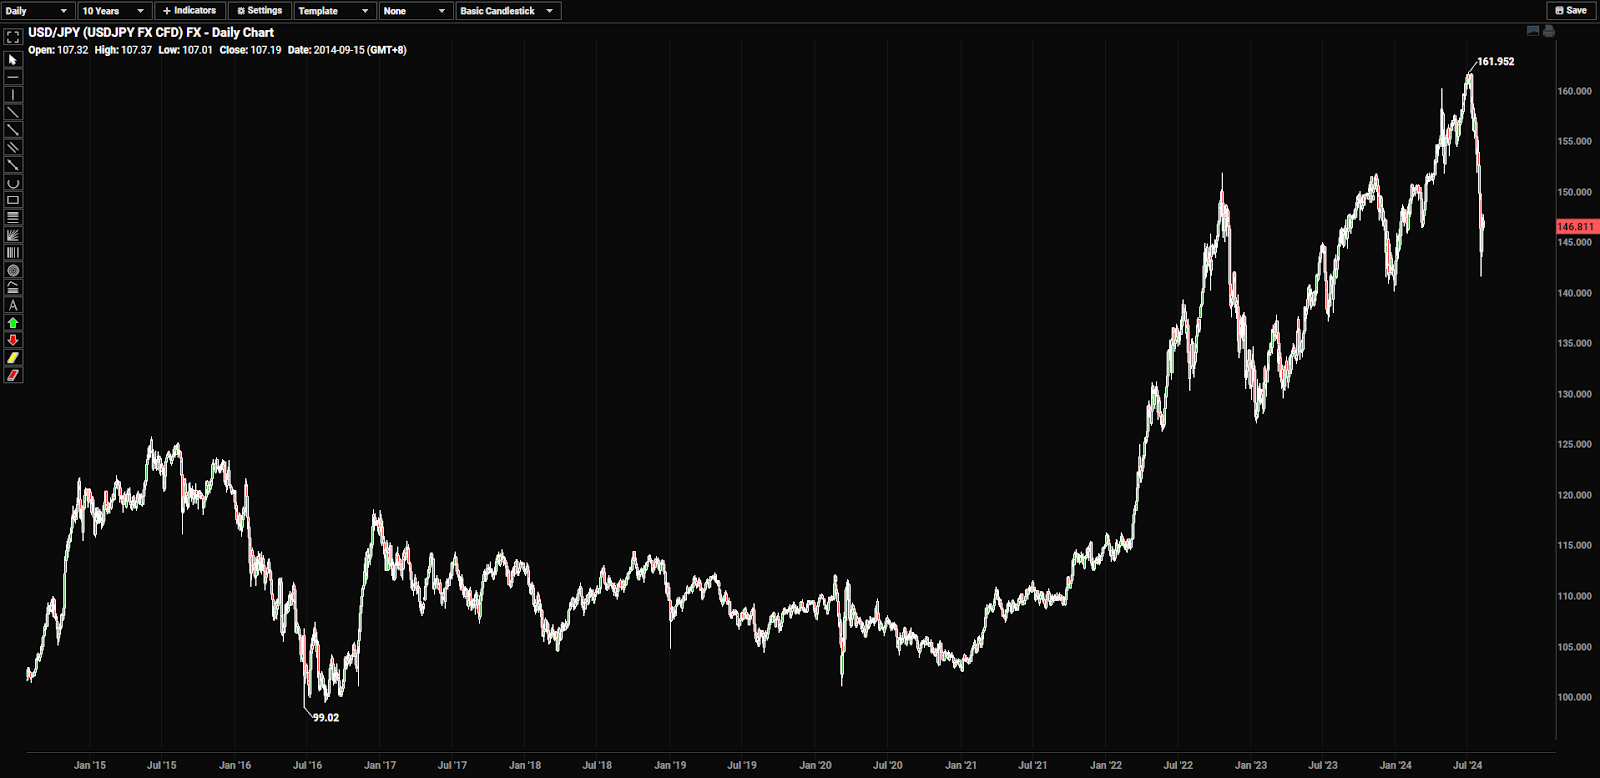
Japan’s economy and the interventions by the BOJ have often served as a reference point for major Central Banks globally when considering monetary policies to address economic downturns. Although Japan was not the first major economy to impose negative rates on deposits held by commercial banks, it was the first economy to sustain such a policy for an unprecedented eight years – a groundbreaking move in the history of central bank policy. However, even with a prolonged period of negative to zero interest rates, Japan’s economy failed to significantly boost domestic demand. Additionally, this policy has exerted downward pressure on Japan’s currency, especially as other nations like US had raised interest rates to combat inflation14.
 Source: Bloomberg
The Japanese Yen depreciated to a 38-year low against the US dollar, currently trading 161 Yen to 1 USD at time of writing. This sharp decline was largely due to the wide interest rate differential, with US rates at 5.5% compared to Japan’s 0%. As a result, Japanese Yen holders seeking higher yields are selling Yen and purchasing foreign currencies to take advantage of this significant positive carry trade. The weakened Yen made imports considerably more expensive, while simultaneously making Japanese exports much cheaper on the global market. In addition, the depreciated Yen sparked a surge in tourism, with many visitors taking advantage of the favourable exchange rate to visit Japan, giving a much needed boost to the economy.
In light of these factors, the Nikkei 225 finally reached a new high after 34 years as shown in the graph below. This achievement was primarily driven by the depreciating Yen, which bolstered Japanese exports and attracted increased interest from foreign investors.
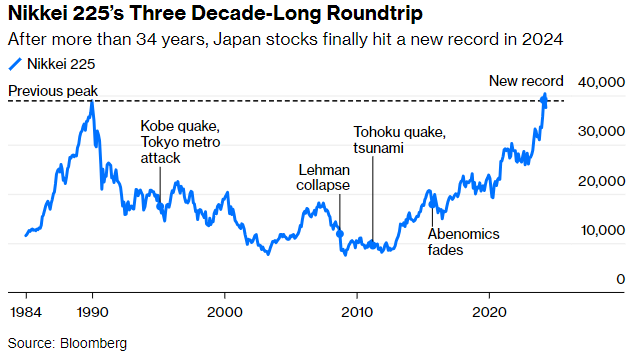
Looking ahead, Japan’s core CPI stood at 2.6% in June 2024, surpassing the BOJ target rate of 2%, driven by an increase in consumption15. In a significant development, Japanese labour unions successfully negotiated a wage increase of 5.28%, marking a 33-year high16. This is an encouraging sign for Japan, indicating a shift in expectations from deflation to inflation. Higher wages typically lead to increased disposable income, which boosts demand for goods and services, subsequently driving up overall prices.
However, given Japan’s prolonged history of deflation and low inflation, analysts and investors are on the fence if the recent momentum will continue. The BOJ has floated the idea of increasing interest rates while other global central banks are considering rate cuts17. An interest rate hike in Japan would likely strengthen the Yen and potentially reverse some of the benefits of a weaker currency.
Moreover, Japan’s Debt-to-GDP ratio is the highest in the world at 264%, meaning any increase in interest rates would significantly raise debt servicing costs, exerting pressure on both the public and private sectors. Additionally, the unwinding of the Yen carry trade could impact global asset prices. Investors and traders should weigh the benefits and risks before reacting to trends and hot news.
How to get started with POEMS
POEMS’ award-winning suite of trading platforms offers investors and traders more than 40,000 financial products across global exchanges.

With our newly launched POEMS Mobile 3 Trading App
Explore a myriad of useful features including TradingView chartings to conduct technical analysis with over 100 technical indicators available!
Take this opportunity to expand your trading portfolio with our wide range of products including Stocks, CFDs, ETFs, Unit Trusts and more across 15 global exchanges available for you anytime and anywhere to elevate you as a better trader using our POEMS Mobile 3 App!
For enquiries, please email us at cfd@phillip.com.sg.
Reference:
- [1] https://www.adb.org/publications/history-of-bank-of-japan-s-more-than-two-decades-of-unconventional-monetary-easing-with-special-emphasis-on-the-frameworks-pursued-in-the-last-10-years
- [2] https://www.aa.com.tr/en/asia-pacific/negative-interest-rate-era-ends-worldwide-as-japan-drops-policy/3170056
- [3] https://hbr.org/1998/01/reinterpreting-the-japanese-economic-miracle
- [4] https://river.com/learn/terms/w/window-guidance/
- [5] https://hbr.org/1990/05/power-from-the-ground-up-japans-land-bubble
- [6] https://dupuyinstitute.org/2018/10/23/where-did-japan-go/
- [7] https://www.reuters.com/markets/asia/japans-crazy-1980s-bubble-dim-memory-nikkei-hits-record-high-2024-02-22/
- [8] https://www.forbes.com/sites/johnfvail/2017/05/12/what-was-japans-bubble-like-in-1989/
- [9] https://economicsdeclassified.wordpress.com/2021/01/01/japan-the-miracle-that-faded-away/
- [10] https://www.imf.org/external/pubs/nft/2000/bubble/
- [11] https://jobsinjapan.com/living-in-japan-guide/what-happened-after-japans-economy-bubble-burst/
- [12] https://www.investopedia.com/terms/l/lost-decade.asp
- [13] https://www.investopedia.com/terms/a/abenomics.asp
- [14] https://www.theguardian.com/world/2024/apr/30/japan-economy-yen-currency-value-falling-low-impact#:~:text=The%20yen%20has%20been%20steadily,it%20because%20it%20is%20falling
- [15] https://asia.nikkei.com/Economy/Inflation/Japan-s-inflation-rate-rose-for-second-consecutive-month-in-Junep
- [16] https://www.japantimes.co.jp/business/2024/03/15/companies/rengo-wages-hikes/
- [17] https://japannews.yomiuri.co.jp/business/economy/20240731-201766/#:~:text=Tokyo%20(Jiji%20Press)%E2%80%94Bank,matter%20told%20Jiji%20Press%20Tuesday
Disclaimer
These commentaries are intended for general circulation and do not have regard to the specific investment objectives, financial situation and particular needs of any person. Accordingly, no warranty whatsoever is given and no liability whatsoever is accepted for any loss arising whether directly or indirectly as a result of any person acting based on this information. You should seek advice from a financial adviser regarding the suitability of any investment product(s) mentioned herein, taking into account your specific investment objectives, financial situation or particular needs, before making a commitment to invest in such products.
Opinions expressed in these commentaries are subject to change without notice. Investments are subject to investment risks including the possible loss of the principal amount invested. The value of units in any fund and the income from them may fall as well as rise. Past performance figures as well as any projection or forecast used in these commentaries are not necessarily indicative of future or likely performance.
Phillip Securities Pte Ltd (PSPL), its directors, connected persons or employees may from time to time have an interest in the financial instruments mentioned in these commentaries.
The information contained in these commentaries has been obtained from public sources which PSPL has no reason to believe are unreliable and any analysis, forecasts, projections, expectations and opinions (collectively the “Research”) contained in these commentaries are based on such information and are expressions of belief only. PSPL has not verified this information and no representation or warranty, express or implied, is made that such information or Research is accurate, complete or verified or should be relied upon as such. Any such information or Research contained in these commentaries are subject to change, and PSPL shall not have any responsibility to maintain the information or Research made available or to supply any corrections, updates or releases in connection therewith. In no event will PSPL be liable for any special, indirect, incidental or consequential damages which may be incurred from the use of the information or Research made available, even if it has been advised of the possibility of such damages. The companies and their employees mentioned in these commentaries cannot be held liable for any errors, inaccuracies and/or omissions howsoever caused. Any opinion or advice herein is made on a general basis and is subject to change without notice. The information provided in these commentaries may contain optimistic statements regarding future events or future financial performance of countries, markets or companies. You must make your own financial assessment of the relevance, accuracy and adequacy of the information provided in these commentaries.
Views and any strategies described in these commentaries may not be suitable for all investors. Opinions expressed herein may differ from the opinions expressed by other units of PSPL or its connected persons and associates. Any reference to or discussion of investment products or commodities in these commentaries is purely for illustrative purposes only and must not be construed as a recommendation, an offer or solicitation for the subscription, purchase or sale of the investment products or commodities mentioned.
This advertisement has not been reviewed by the Monetary Authority of Singapore.
CFD Disclaimer
Investments are subject to investment risks. The risk of loss in leveraged trading can be substantial. You may sustain losses in excess of your initial funds and may be called upon to deposit additional margin funds at short notice. If the required funds are not provided within the prescribed time, your positions may be liquidated. The resulting deficits in your account are subject to penalty charges. The value of investments denominated in foreign currencies may diminish or increase due to changes in the rates of exchange. You should also be aware of the commissions and finance costs involved in trading leveraged products. This product may not be suitable for clients whose investment objective is preservation of capital and/or whose risk tolerance is low. Clients are advised to understand the nature and risks involved in margin trading.
You may wish to obtain advice from a qualified financial adviser, pursuant to a separate engagement, before making a commitment to purchase any of the investment products mentioned herein. In the event that you choose not to obtain advice from a qualified financial adviser, you should assess and consider whether the investment product is suitable for you before proceeding to invest and we do not offer any advice in this regard unless mandated to do so by way of a separate engagement. You are advised to read the trading account Terms & Conditions and Risk Disclosure Statement (available online at https://www.poems.com.sg/) before trading in this product.
Any CFD offered is not approved or endorsed by the issuer or originator of the underlying securities and the issuer or originator is not privy to the CFD contract.
This advertisement has not been reviewed by the Monetary Authority of Singapore.
This material is intended for general circulation only and does not take into account the specific investment objectives, financial situation or particular needs of any particular person. You should seek advice from a financial adviser regarding the suitability of the investment product, taking into account your specific investment objectives, financial situation or particular needs, before making a commitment to invest in such products.
About the author
Hei Tung Sam
Assistant Manager, Dealing
Contract for Differences
Sam graduated from National University of Singapore with a Master of Science in Finance. He personally manages his own investment portfolio and does equity and economic research in his free time. Sam believes that education and information is essential to making good financial decisions.

 Mastering Stop-Loss Placement: A Guide to Profitability in Forex Trading
  Crude Realities: Understanding oil prices and how to trade them
  Gold at All-Time Highs: What’s Fuelling the 2025 Rally?
  Salesforce: A Steady Tech Leader in Volatile Times


