Unlocking the Secrets to High-Quality ETFs July 30, 2024
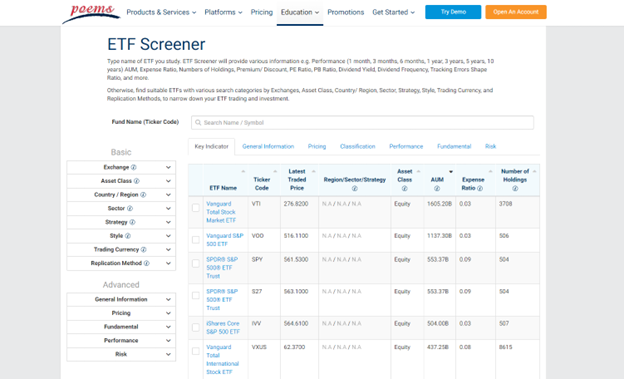
Have you ever dismissed something based on first impressions only to discover you were completely mistaken? That was exactly my experience with the POEMS ETF Screener. Far from being just another tool, it has changed the way I approach investing, offering insightful and adaptable investment strategies for a variety of market conditions.
In this quick visual guide, I’ll demonstrate:
- The quick and simple way to source for high quality ETFs
- Effective techniques for subsequent performance validation
- Personal strategies I employ to leverage the insights and outputs provided by the screener.
ETFs (Exchange-Traded Funds) are investment vehicles that trade on stock exchanges, tracking specific indices or assets. They offer diversification and lower costs compared to some other investment options. (I’ve recently published articles on Basic, Intermediate and Advanced levels.)
ETF screeners are invaluable tools that help investors filter and compare ETFs based on various criteria such as performance, expense ratios, and asset classes. These screeners simplify the process of finding ETFs that match specific investment goals and preferences.
Overview navigation:
- In the left column, you can select a wide range of macro criteria and filters.
- In the top row, you can toggle between different tabs to explore various insights and output.
For our first example, given the commentary from Singapore investors about the lackluster performance of the local market, let’s explore whether this screener can unearth any compelling investment opportunities.
Steps
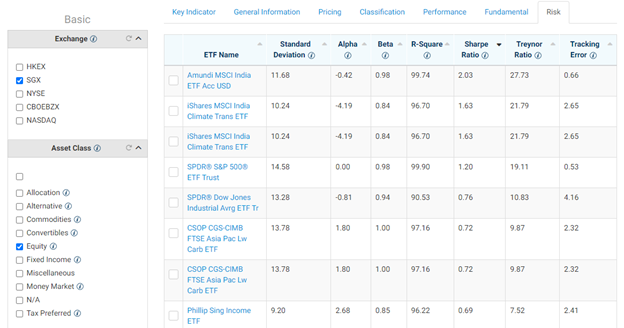
- Select “SGX & Equity” from the left column
- Toggle the top to “Risk”
- Sort by “Sharpe Ratio”
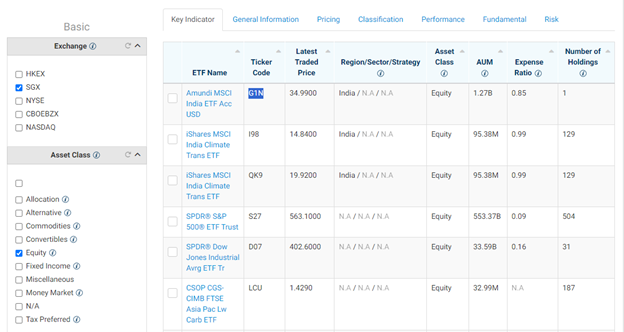
- Go back to key indicator & search for the ticker code (“G1N” for this example)
- Use a charting app to look at its past performance (>5-10 years uptrend preferred)
Definition: The Sharpe ratio measures the performance of an investment compared to a risk-free asset, adjusting for its risk.
In other words: “How much additional performance could I possibly get for a given amount of risk?”
Generally, Sharpe ratios for well-performing investments fall within these ranges:
- 1.0 to 2.0: Good
- 2.0 to 3.0: Very good
- Above 3.0: Excellent
Let’s go through the steps visually:
Steps:
- Select “SGX & Equity” in the left column
- Toggle the top tab to “Risk”
- Click to sort by “Sharpe Ratio”.
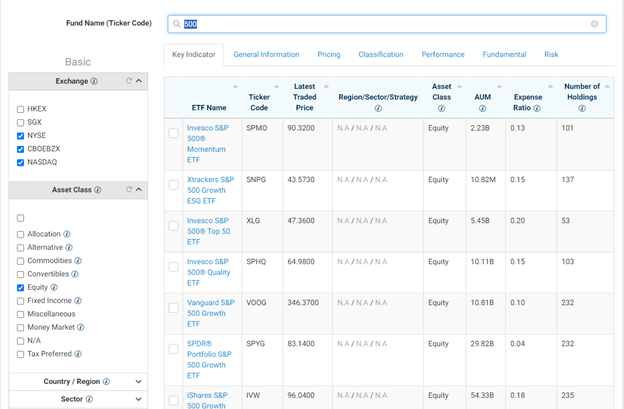
- Filter by “NYSE, CBOE, NASDAQ & Equity” in the left column
- *Type and enter “500” under the fund name search bar (do not click any ETF)
- Toggle to “Risk” & sort by “Sharpe Ratio”
- Toggle back to key indicator to look for “Ticker Code”
- Let’s examine “SPMO” in comparison to popular ETFs like “VOO, SPY, CSPX”
- AUM (Assets Under Management): Higher values are preferable when comparing similar funds, as they suggest better liquidity and narrower bid-ask spreads.
- Expense ratio: Lower is better for similar comparisons.
- Number of holdings: While optional, maintaining a minimum of 30 companies can help reduce non-systematic risk.
- Benchmark: It is essential to know how the ETF methodology comes about and if it suits your investment thesis.
- Replication method:
- Full physical: The ETF holds actual shares of companies according to index weightage.
- Sample-physical: The ETF holds shares of only the most liquid companies.
- Synthetic: ETF hold derivatives like swaps and derivatives.
- Physical’s disadvantage is tracking-error while Synthetic’s disadvantage is counterparty-risk.
- I seldom look at output although the “Large Growth” under “Style” might be meaningful for investors who’re avoiding small caps companies.
- Alpha: Higher is preferable for similar comparisons.
- Beta: Lower values are ideal if you seek less volatile ETFs.
- Sharpe Ratio: Higher values are sought after for comparable funds.
- Filter by “Exchanges & Equity” in left column
- Type and press ENTER “{keyword}” under fund name search bar (do not click any ETF)
- Toggle to “Risk” & sort by Sharpe Ratio
- Toggle back to “Key Indicator” to look for “Ticker Code”
- Let’s examine “{Ticker}” on a charting app and look for >5 to 10 year uptrend.
- Remember the caveat regarding 1-Year Sharpe Ratio, view “Benchmark” under General Information, view “Style” under Classification tab, and ensure everything aligns with your investment profile and goals.
Next Steps:
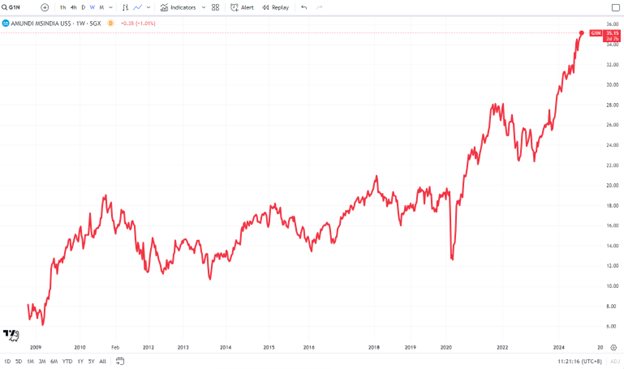
Return to the key indicator tab and search for the ticker code (‘G1N’ for this example).
Next step:
Use a charting app to examine its past performance (an uptrend of over 5-10 years is preferred).
Before discovering this, I wasn’t aware such an ETF was listed on the SGX. Of course, if you’re interested in investing in India Large Cap, then you might consider this as part of your investment portfolio. Feel free to explore other ETFs next in line (tickers: I98, OK9, S27, D07).
Now, for our 2nd example, let’s compare the Sharpe Ratio of different S&P500 related ETFs.
Similar steps:
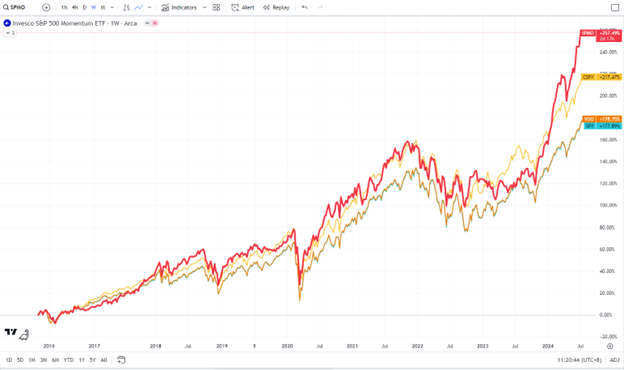
I was both delighted and surprised when I first encountered this.
However, before we get too excited, its important to understand some caveats on using Sharpe Ratio effectively.
Firstly, the figure provided is the 1-Year Sharpe Ratio, indicating that the ETF has performed well over the past year. To gauge long-term stability, use a charting app to verify that it has shown a consistent uptrend, ideally for more than 5 to 10 years. Remember, while past performance is not a reliable indicator of future results, stability is generally more dependable than volatility.
Next, its crucial to understand the benchmark and underlying assets. For example, an ETF like ARKK consists of companies focusing on “Disruptive Innovation”. Such companies are often in the early stages of finding product-market fit and proof of concept, and may not yet be profitable. These types of investments tend to do well during speculative and complacent markets. You can view them under “Benchmark” from General Information and “Style” in the Classification tab.
Lastly, let’s explore the full suite of insights that this screener offers to help you make more informed investment decisions.

On the first “Key indicator” tab, I usually consider:

Next, on the “General Information” tab, I usually focus on:
Below are screenshots of their index methodology from SPMO and VOO official sources.


For the “Pricing” tab, I seldom delve into its details.

Next, on the “In the “Classification” tab, I usually look for:

On the “Performance” tab, I seldom examine this tab as I prefer to verify long-term trends (>5 to 10 years) through charting apps.

Next, in the “Fundamental” tab, I typically examine:
Dividend yield & frequency: Advanced investors might also look at the DPU (Dividend Payout Per Unit).

Finally on the “Risk” tab, I usually look for:
Understanding how to use each tab and the data provided allows you to filter in the left column according to your investment strategy.
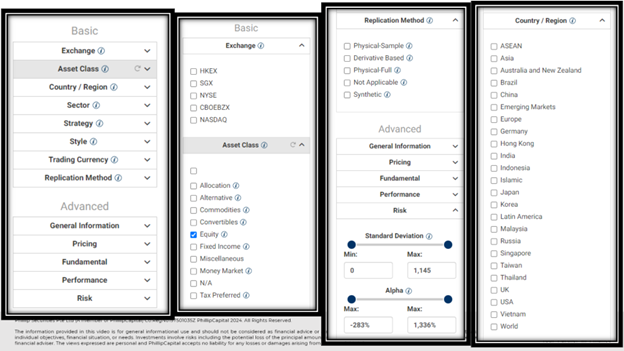
Recap:
Your next step: save these useful tools under your investment arsenal.
Disclaimer
These commentaries are intended for general circulation. It does not have regard to the specific investment objectives, financial situation and particular needs of any person who may receive this document. Accordingly, no warranty whatsoever is given and no liability whatsoever is accepted for any loss arising whether directly or indirectly as a result of any person acting based on this information. Opinions expressed in these commentaries are subject to change without notice. Investments are subject to investment risks including the possible loss of the principal amount invested. The value of the units and the income from them may fall as well as rise. Past performance figures as well as any projection or forecast used in these commentaries are not necessarily indicative of future or likely performance. Phillip Securities Pte Ltd (PSPL), its directors, connected persons or employees may from time to time have an interest in the financial instruments mentioned in these commentaries. Investors may wish to seek advice from a financial adviser before investing. In the event that investors choose not to seek advice from a financial adviser, they should consider whether the investment is suitable for them.
The information contained in these commentaries has been obtained from public sources which PSPL has no reason to believe are unreliable and any analysis, forecasts, projections, expectations and opinions (collectively the “Research”) contained in these commentaries are based on such information and are expressions of belief only. PSPL has not verified this information and no representation or warranty, express or implied, is made that such information or Research is accurate, complete or verified or should be relied upon as such. Any such information or Research contained in these commentaries are subject to change, and PSPL shall not have any responsibility to maintain the information or Research made available or to supply any corrections, updates or releases in connection therewith. In no event will PSPL be liable for any special, indirect, incidental or consequential damages which may be incurred from the use of the information or Research made available, even if it has been advised of the possibility of such damages. The companies and their employees mentioned in these commentaries cannot be held liable for any errors, inaccuracies and/or omissions howsoever caused. Any opinion or advice herein is made on a general basis and is subject to change without notice. The information provided in these commentaries may contain optimistic statements regarding future events or future financial performance of countries, markets or companies. You must make your own financial assessment of the relevance, accuracy and adequacy of the information provided in these commentaries.
Views and any strategies described in these commentaries may not be suitable for all investors. Opinions expressed herein may differ from the opinions expressed by other units of PSPL or its connected persons and associates. Any reference to or discussion of investment products or commodities in these commentaries is purely for illustrative purposes only and must not be construed as a recommendation, an offer or solicitation for the subscription, purchase or sale of the investment products or commodities mentioned.
About the author
MuMing Yong
ETF Specialist
Phillip Securities Pte Ltd
Mu Ming traded and invested for more than 8 years in various instruments including ETFs, Equities, Unit Trusts, Options, DLC, CFD, and ILP from the US, SG and HK market. He's a believer of personal finance, macroeconomics, and, technical analysis - so much so that he found himself analysing his social media engagement using trend lines and patterns.

 ETF Market Analysis: Oil & Hang Seng Set for January Gains
  Buffer ETFs — What Are They and How Do They Work?
  ETF Market Review: Most ETFs up in November; gold expected to extend recent gains
  Should You Invest Your Supplementary Retirement Scheme (SRS) Savings?


