Visualising Market Trends: A Statistical Approach to Market Sentiments November 15, 2024

As the saying goes “Sell in May and Go Away” [1]. The saying warns investors that the market usually underperforms from May to October. Moreover, the market’s performance in December generally tends to do well due to factors such as window dressing [2] and the pre-Christmas effect [3]. It can also be observed that during the Chinese New Year, that is usually celebrated within the months of January to February, Asian markets often perform slightly better, though with lower liquidity [4].
On 5 Aug 2024, stock markets around the world experienced a tank in prices (in accordance to the saying) but then recovered and rose in the following days, which contradicted the expectation. This highlights the importance of investors understanding market trends and implementing strategies to counter current and near future market conditions.
The Empirical Study
This article will explore the 5 largest stock markets in South East Asia (SEA) – Indonesia, Singapore, Thailand, Malaysia and the Philippines.
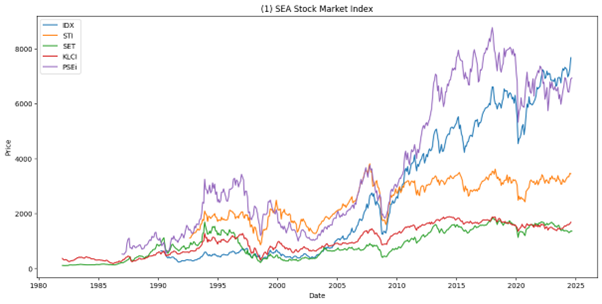 Data Source: TradingView.com
Referring to figure (1), there are several periods when stock markets tend to move in the same direction, notably the Asian bull run in 1993; the Asian Financial Crisis in 1997 ; the Global Financial Crisis in 2007-2008, and most recently, the COVID Pandemic from 2020 to 2023.
We can also assess the correlation between stock markets by measuring the closeness of their returns during these times. This approach helps investors to understand how markets respond similarly or differently during major events. [a].
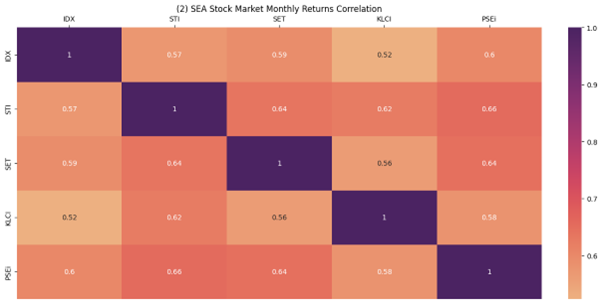
Based on figure(2) above, the monthly returns among the SEA stock markets are moderately correlated (~0.5 to ~0.6); which means that SEA stock markets tend to move in the same direction. This likely suggests that the movement of one market can potentially spillover to the other markets.
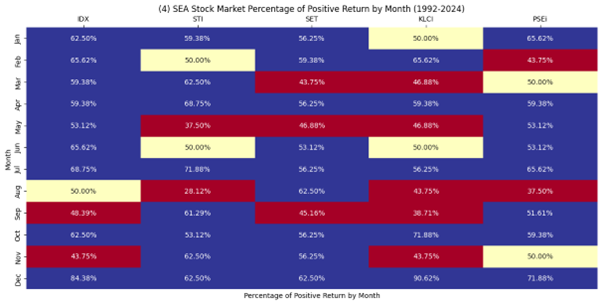
The returns could be grouped monthly to better illustrate how these patterns align with the market trends described in the quote:
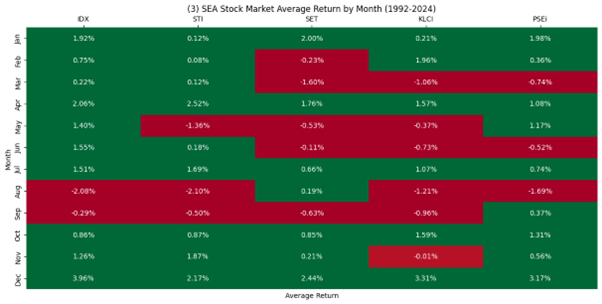

With reference to figure (3), the monthly average returns data shows that the stock markets generally underperform in May and June, then recover slightly in July only to weaken further in August and September. The period from October to November shows some recovery. The Christmas (December) and Chinese New Year (January/ February) effects can also be observed with a higher average return in their respective months.
(4) The percentage of positive returns by month shows the proportion of index’s monthly returns greater than 0 for a particular month, i.e., among all the Januarys from 1992 to 2024, 62.50% of the Januarys have a positive return. The similar effect can still be observed from May to October as well as the Christmas and Chinese New Year effect from December to January/ February.
Remarkably, the data also shows that March is a down month and April is an up month.
The Experimental Portfolio
Based on insights from the data, we can explore the hedging and speculative effects of CFDs [b]. The expectation is that the stock market index will deliver positive returns from October to February, and negative returns from March to September. The experiment below compares the return and drawdown of a portfolio when an investor hedges or speculates during these months.

The hedging strategy involves fully hedging between March and September, assuming poor stock market performance during this period. The speculative strategy, however, takes a short position on the stock market index between March to September, aiming to capture potential profits from the anticipated market downturn. The experiment is conducted on the STI and KLCI indices respectively.

There are several metrics that can be used to measure the performance of a portfolio other than profit. Measuring the drawdown of the portfolio is also useful for evaluating the risk associated with the portfolio’s strategy. For a simple buy-and-hold strategy, drawdown would always be zero as long as the index remains profitable. However, when tracking unrealised profits in a buy-and-hold approach, you may notice equity fluctuations. If the equity reaches a new high and then declines, there is an implied “loss” in equity because you could have taken profit at a higher equity level. Thus, to account for this “loss”, we record the highest equity achieved and measure any subsequent fall from that peak as a drawdown—known as high equity drawdown.
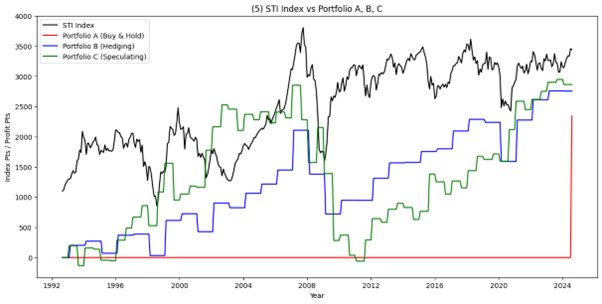

(5) The STI index portfolio results show that returns from the speculative portfolio yielded the highest returns, followed by the hedging and buy-and-hold portfolios. During the 2008 financial crisis, the speculative portfolio experienced a significant loss in profit, lowering its returns below the hedging portfolio. Notably, from 2008 to 2024, the index was ranging between 3000 to 3500, yet both the hedging and speculative portfolios continued to generate profits. In contrast, the buy-and-hold strategy would have struggled to recover from high equity losses during this ranging period. Both hedging and speculative portfolios also have a lower high equity drawdown than buy-and-hold portfolios.
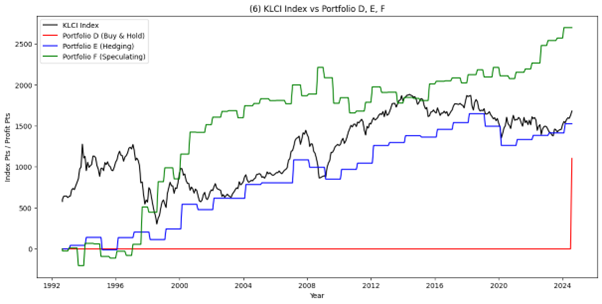

(6) The KLCI index portfolio results show that profit from speculative portfolios is the highest followed by hedging and the buy-and-hold portfolios. The impact of market sentiment was more pronounced in the KLCI than in the STI, as the speculative portfolio outperformed the hedging portfolio during the 2008 financial crisis. Since 2015, the buy-and-hold strategy would have reached a peak in high equity but struggled to recover thereafter. However, the hedging and speculative portfolios continued to yield profits even as the index declined. Once again, both hedging and speculative portfolios displayed a lower high equity drawdown than buy-and-hold portfolios.
Final Remarks
Pricing in the financial market is a complex process, influenced by numerous observable and unknown factors! This example demonstrates only basic market behaviour, providing investors with insights for planning ahead. Risk averse investors may choose to hedge for risk management while more aggressive investors may consider to go short as a trading strategy.
[a] Using returns helps avoid secular trends and spurious regressions, with returns assumed to be stationary for this study.
[b] This experimental portfolio reflects only the CFD Index’s closing/opening price movements, precisely mirroring the underlying stock market index, and excludes transaction costs, swaps, dividends, financing costs, and CFD-spot price convergence.
[c] Details of Portfolio Results:
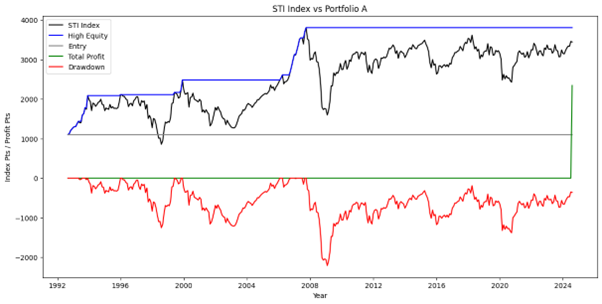
Portfolio A (Buy-and-Hold) – Profit is only realised at the end of the data. The index trends higher at the end of the data period but the portfolio experiences a high equity drawdown during 2008. Notably, post-2008 periods show continued drawdowns, as the index did not return to pre-2008 peak levels.
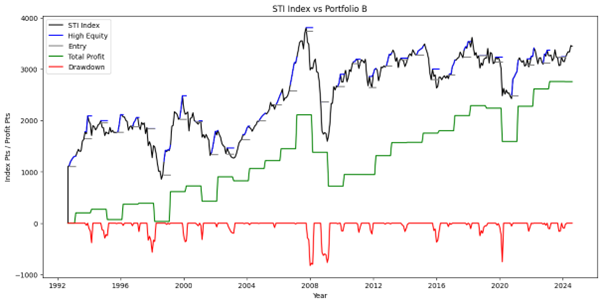
Portfolio B (Hedging) – Profit is realised at the end of every February. Positive returns from October to February outweigh the negative returns, resulting in overall growth.
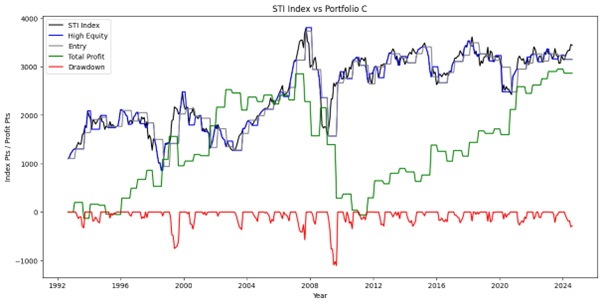
Portfolio C (Speculative) – Profit is realised at the end of every February and October. Shorting the index from March to October increases the returns of the portfolio by capitalising on market declines. The effect of the stock market crash in 2008 is also slightly mitigated as there was some profits gained from the short positions.
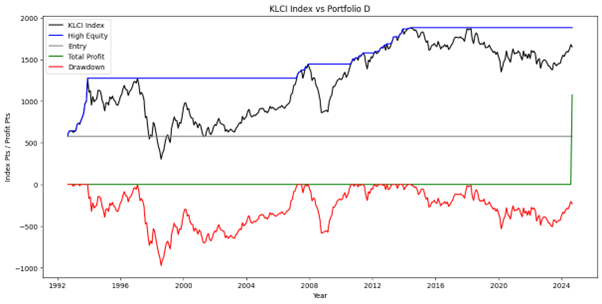
Portfolio D (Buy-and-Hold) – Profit is only realised at the end of the data. The index trends higher at the end of the data period but the portfolio experiences an increasing high equity drawdown post-2018.
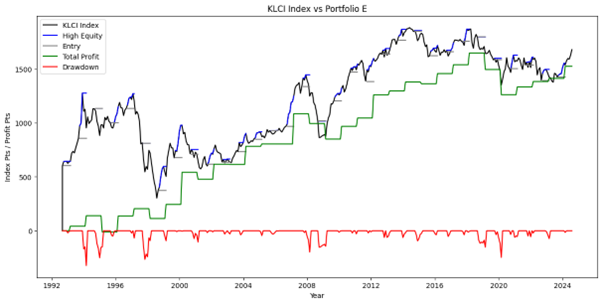
Portfolio E (Hedging) – Profit is realised at the end of each February. Similar to Portfolio B, positive returns from October to February have a stronger effect than the negative returns, leading to overall growth.
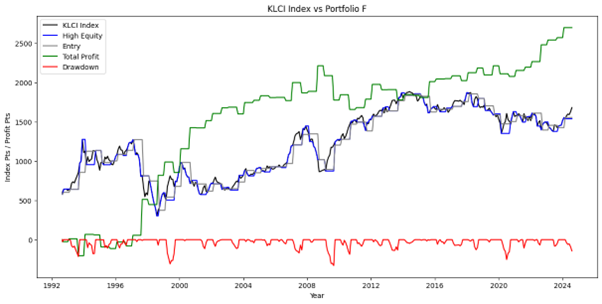
Portfolio F (Speculative) – Profit is realised at the end of February and October. Shorting from March to October significantly boosts returns by leveraging the index’s decline. From 1996 to 2004, the market followed the statement closely, resulting in substantial realised profits.
How to get started with POEMS
POEMS’ award-winning suite of trading platforms offers investors and traders more than 40,000 financial products across global exchanges.

With our newly launched POEMS Mobile 3 Trading App
Explore a myriad of useful features including TradingView chartings to conduct technical analysis with over 100 technical indicators available!
Take this opportunity to expand your trading portfolio with our wide range of products including Stocks, CFDs, ETFs, Unit Trusts and more across 15 global exchanges available for you anytime and anywhere to elevate you as a better trader using our POEMS Mobile 3 App!
For enquiries, please email us at cfd@phillip.com.sg.
Reference:
- [1] https://www.investopedia.com/terms/s/sell-in-may-and-go-away.asp#:~:text=%22Sell%20in%20May%20and%20go%20away%22%20is%20an%20adage%20referring,6.3%25%20from%20November%20to%20April.
- [2] https://www.nasdaq.com/glossary/w/window-dressing
- [3] https://www.cnbc.com/2018/12/21/the-santa-claus-rally–no-ho-ho-ho–.html
- [4] https://www.phillipcfd.com/traders-must-know-chinese-new-year-effects/
Disclaimer
These commentaries are intended for general circulation and do not have regard to the specific investment objectives, financial situation and particular needs of any person. Accordingly, no warranty whatsoever is given and no liability whatsoever is accepted for any loss arising whether directly or indirectly as a result of any person acting based on this information. You should seek advice from a financial adviser regarding the suitability of any investment product(s) mentioned herein, taking into account your specific investment objectives, financial situation or particular needs, before making a commitment to invest in such products.
Opinions expressed in these commentaries are subject to change without notice. Investments are subject to investment risks including the possible loss of the principal amount invested. The value of units in any fund and the income from them may fall as well as rise. Past performance figures as well as any projection or forecast used in these commentaries are not necessarily indicative of future or likely performance.
Phillip Securities Pte Ltd (PSPL), its directors, connected persons or employees may from time to time have an interest in the financial instruments mentioned in these commentaries.
The information contained in these commentaries has been obtained from public sources which PSPL has no reason to believe are unreliable and any analysis, forecasts, projections, expectations and opinions (collectively the “Research”) contained in these commentaries are based on such information and are expressions of belief only. PSPL has not verified this information and no representation or warranty, express or implied, is made that such information or Research is accurate, complete or verified or should be relied upon as such. Any such information or Research contained in these commentaries are subject to change, and PSPL shall not have any responsibility to maintain the information or Research made available or to supply any corrections, updates or releases in connection therewith. In no event will PSPL be liable for any special, indirect, incidental or consequential damages which may be incurred from the use of the information or Research made available, even if it has been advised of the possibility of such damages. The companies and their employees mentioned in these commentaries cannot be held liable for any errors, inaccuracies and/or omissions howsoever caused. Any opinion or advice herein is made on a general basis and is subject to change without notice. The information provided in these commentaries may contain optimistic statements regarding future events or future financial performance of countries, markets or companies. You must make your own financial assessment of the relevance, accuracy and adequacy of the information provided in these commentaries.
Views and any strategies described in these commentaries may not be suitable for all investors. Opinions expressed herein may differ from the opinions expressed by other units of PSPL or its connected persons and associates. Any reference to or discussion of investment products or commodities in these commentaries is purely for illustrative purposes only and must not be construed as a recommendation, an offer or solicitation for the subscription, purchase or sale of the investment products or commodities mentioned.
This advertisement has not been reviewed by the Monetary Authority of Singapore.
CFD Disclaimer
Investments are subject to investment risks. The risk of loss in leveraged trading can be substantial. You may sustain losses in excess of your initial funds and may be called upon to deposit additional margin funds at short notice. If the required funds are not provided within the prescribed time, your positions may be liquidated. The resulting deficits in your account are subject to penalty charges. The value of investments denominated in foreign currencies may diminish or increase due to changes in the rates of exchange. You should also be aware of the commissions and finance costs involved in trading leveraged products. This product may not be suitable for clients whose investment objective is preservation of capital and/or whose risk tolerance is low. Clients are advised to understand the nature and risks involved in margin trading.
You may wish to obtain advice from a qualified financial adviser, pursuant to a separate engagement, before making a commitment to purchase any of the investment products mentioned herein. In the event that you choose not to obtain advice from a qualified financial adviser, you should assess and consider whether the investment product is suitable for you before proceeding to invest and we do not offer any advice in this regard unless mandated to do so by way of a separate engagement. You are advised to read the trading account Terms & Conditions and Risk Disclosure Statement (available online at https://www.poems.com.sg/) before trading in this product.
Any CFD offered is not approved or endorsed by the issuer or originator of the underlying securities and the issuer or originator is not privy to the CFD contract.
This advertisement has not been reviewed by the Monetary Authority of Singapore.
This material is intended for general circulation only and does not take into account the specific investment objectives, financial situation or particular needs of any particular person. You should seek advice from a financial adviser regarding the suitability of the investment product, taking into account your specific investment objectives, financial situation or particular needs, before making a commitment to invest in such products.
About the author
Tan Peng Chien
Dealer
Contract for Differences
Peng Chien graduated from the University of London with a Bachelor’s Degree in Banking and Finance. As a dealer, it is essential that he keeps up with all aspects of the markets and therefore spends most of his time exploring new strategies and analyzing the financial markets.

 Mastering Stop-Loss Placement: A Guide to Profitability in Forex Trading
  Crude Realities: Understanding oil prices and how to trade them
  Gold at All-Time Highs: What’s Fuelling the 2025 Rally?
  Salesforce: A Steady Tech Leader in Volatile Times


