
FACEBOOK INC. - Capitalising on continued user growth
27 Sep 2021- PATMI is expected to grow CAGR 19% till FY22e, supported by growth in Family Monthly Active People and Family Average Revenue per Person.
- Expanding outside advertising into commerce and AR/VR verticals, payments & others category driven by commerce activity and VR device sales.
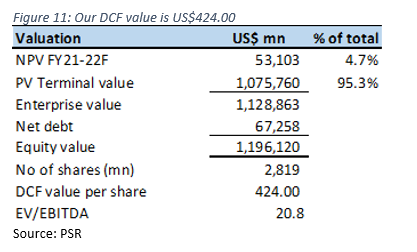
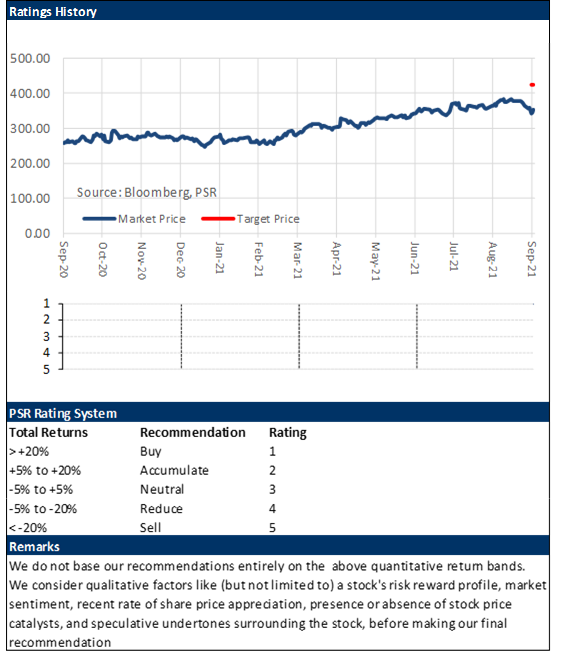
- Initiate coverage with a BUY recommendation and DCF target price (WACC 6.7%) of US$424.00.
Company Background
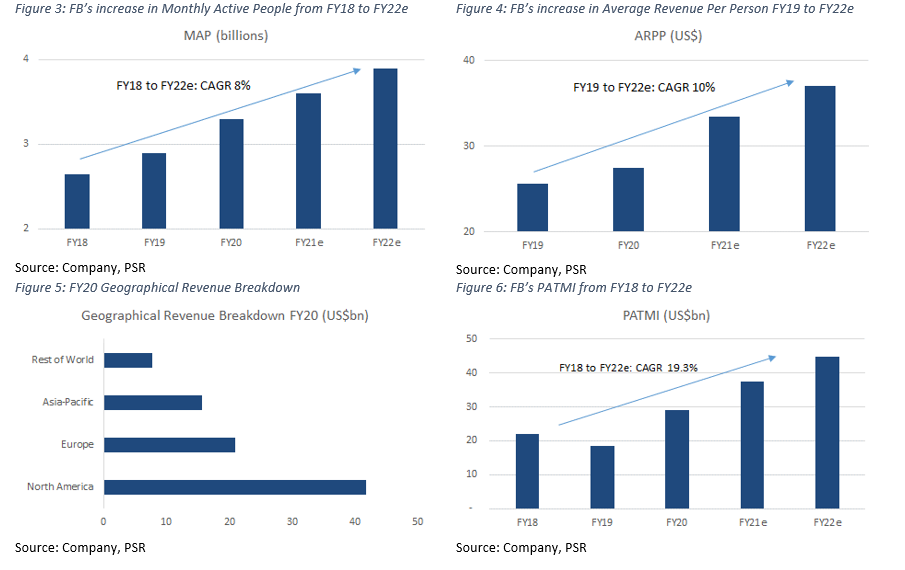
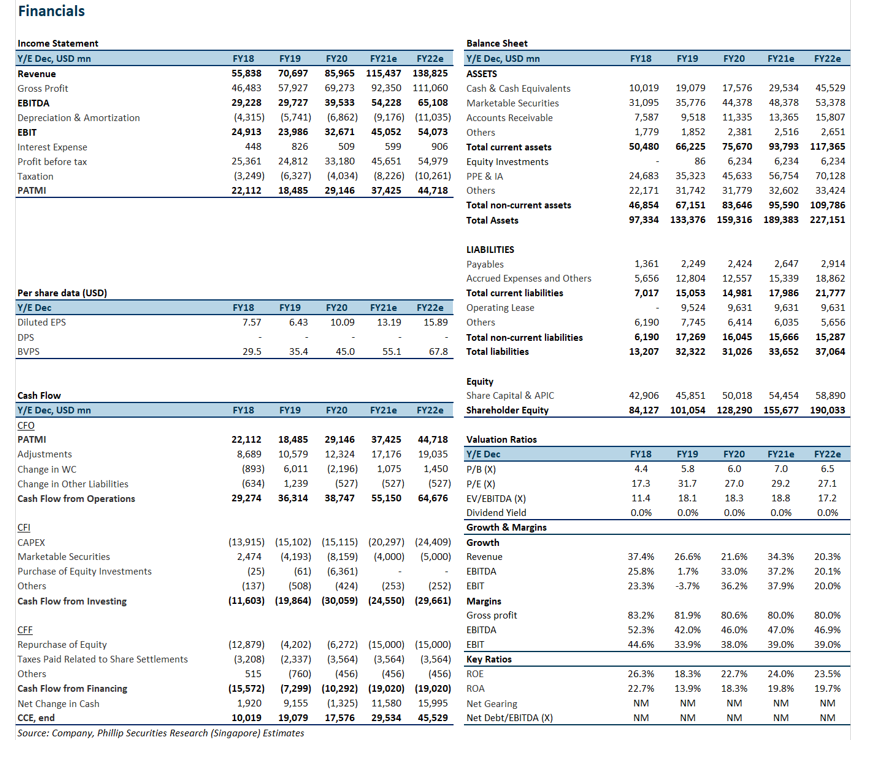
Founded in 2004, Facebook (FB) is the largest social-media company in the world, serving more than 3bn users and about 10m advertisers. Its portfolio includes Facebook, Instagram, Messenger, WhatsApp and Facebook Reality Labs (VR). FY20 revenue was a record US$86bn, with PATMI of US$29.1bn. Almost all FB’s US$86bn revenue in FY20 came from advertising, at 98% or US$84.2bn. Payments and Others made up 2%. Geographically, North America contributed 49% to revenue, Europe 24%, Asia-Pac 18% and the Rest of The World 9%.
Investment Merits
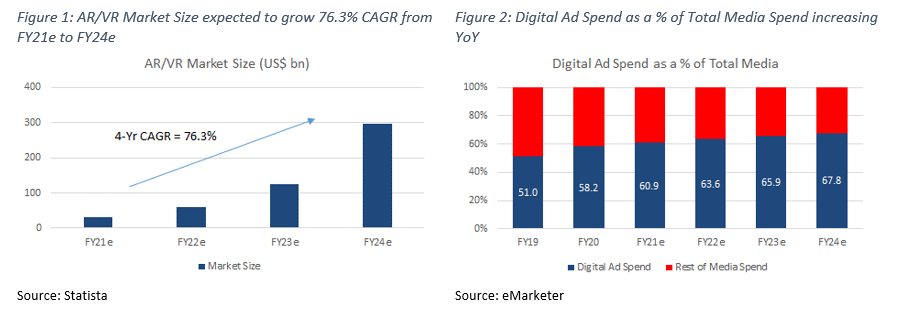
- Expanding user base and value to advertisers. FB’s Family Monthly Active People (MAP) was up 14% YoY in FY20, from 2.9bn to 3.3bn people. Family Average Revenue per Person (ARPP) was also up by 17% YoY, due to increases in digital ad spending. Worldwide digital ad spend as a percentage of total media ad spend is projected to increase from 58% in FY20 to 68% by FY24e, with dollar spend also projected to almost double from $378bn to $646bn in the same period. The strong growth in MAP and ARPP reflects FB’s ability to attract, retain and commercialise users on its platforms. We expect FB’s MAP growth rate to dip slightly in the later years, to around 8-10% YoY. In view of: 1) strong competition from other social-media platforms; and 2) FB’s already large share of active Internet users around the world. We expect ARPP to increase 22% YoY in FY21e, on the back of tailwinds from a recovering advertising market.
- Capitalising on commerce, AR/VR. FB plans to develop Shops into an all-in-one touch point for users to browse and transact without third-party diversions, similar to other e-commerce platforms. More than 200m small businesses around the world are currently estimated to be tapping FB’s technological reach and tools to promote their businesses – with this number growing each day. We view this as a huge opportunity for FB to develop a new revenue stream to complement its main advertising business. Revenue from payments & others was up 146% YoY Q1 FY21, and we expect continued growth on the back of increased commerce activity and usage of WhatsApp Pay. FB is also doubling down on AR/VR, touting its future potential as being more immersive products than current web browsers. Worldwide AR/VR market is projected to expand 10x over the next four years – from US$30bn to US$300bn, providing FB another large market opportunity to capture.
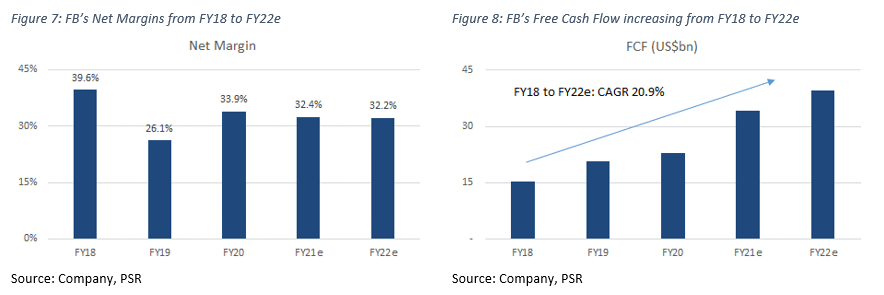
- High margins, high cash generation model. FB recorded net margins of 34% in FY20 – slightly below its 5-year average of 35%. Net margins backed by gross margins of 80% and low operating expenses on infrastructure, content & traffic costs. Largest cost item is R&D at 21% of revenue. FCF has been growing at a CAGR of 14% over the past three years despite the huge capital expenditure programmes.
We Initiate coverage with a BUY rating and target price of US$424.00 based on DCF valuation, with a WACC of 6.7% and terminal growth of 4%.
REVENUE
The bulk of FB’s US$86bn revenue in FY20 came from advertising, at 98% or US$84.2bn. Payments & others made up 2% or US$1.8bn. FB’s advertising revenue is generated from selling ad placements to marketers using an open bid system, allowing marketers to purchase ads at a price determined by supply and demand, with the added option for marketers to place these ads on any of FB’s family of platforms.
Geographically, North America contributed 49% to revenue, Europe 24%, Asia-Pac 18% and Rest of The World 9%. Even as growth rates of monthly average people in developed regions like North America and Europe start to slow down, we expect ad revenue from these two regions to increase 40+% YoY. This would be largely led by increased digital ad-spending in these regions.
We see the potential for growth from the monetisation of FB’s e-commerce products, Shops. Shops is a product to bring businesses and consumers together. It allows businesses to create a free to use an online store to display and sell merchandise to FB users, leveraging on connectivity tools such as Messenger and WhatsApp as support functions. FB is expected to use these products to generate additional revenue from 1) transactional fees; and/or 2) increased ad impressions and higher advertising prices associated with shopping directly on its platforms.
FB has also been actively developing a secondary revenue stream in the payment sector. It launched WhatsApp Pay in developing countries like India and Brazil in Q4 FY20, where its combined user base exceeds 500mn people. It wants to: 1) monetise it’s largely untapped free-to-use platform; and 2) develop its existing payment platform for future integration with its family of platforms. Revenue from payments & others was up 146% YoY Q1 FY21. Thanks to the company’s global user reach and a strong emphasis on growth in this revenue stream, we expect YoY growth to be maintained around 65% moving forward.
FB recorded gross profits of $69.2bn in FY20, with PATMI of $29.1bn. Revenue is expected to hit US$138bn by end-FY22e, largely due to increases in MAP. MAP is a key metric for FB as it leverages its user base to generate advertising revenue. FB recorded MAP of 3.3 billion people in FY20, and is expected to grow at a CAGR of 8% to 3.9 billion by FY22e. ARPP was US$27.51 for FY20, an 8% YoY growth, and is forecasted to hit US$37 by FY22e – CAGR 10%, on the back of increased worldwide ad spending. Worldwide digital ad-spending is expected to trend upwards as a result of behavioural shifts in advertising and marketing spending, which would benefit FB.
EXPENSES
Cost of sales grew at a 34.5% CAGR from FY16 to FY20, above revenue CAGR of 25.5%. Operating expenses include research and development (21.5% of revenue), sales and marketing (13.5%), and general and administrative (7.6%). Expenses have remained fairly stable over the last 5 years, except for general and administrative expense in FY19 which hit 14.8% of revenue – due to US$5bn FTC settlement. Depreciation and amortization for FY20 was US$6.9bn (8% of revenue), a 19.5% YoY increase from FY19. D&A expenses are expected to increase significantly over the next 2 years on the back of increased capital expenditure in tech infrastructure.
MARGINS
Gross margins hit 80% in FY20, slightly below the 5-year average of 84%. The high margins are attributed to its minimal overhead costs, mostly spent on facility and server depreciation, salaries and content & traffic acquisition costs.
Net margins in FY20 were 34%, up from 26% the previous year. Led by 37%/36% YoY drops in G&A expenses and tax. G&A expense decreased from US$10.5bn to US$6.60bn given the absence of a US$5bn Federal Trade Commission settlement in 2019. Cost of revenue, R&D expenses and G&A expenses are expected to increase due to business expansion, but net margins should remain stable at 32-33% due to increased revenue.
BALANCE SHEET
Assets: Cash, cash equivalents and marketable securities increased by about US$7bn YoY in FY20, largely due to increased purchases of marketable securities. Equity Investments increased US$6.1bn, following a US$5.8bn investment in Jio Platforms – a holding company for India’s largest mobile network provider. Plant Property Equipment & Intangible Assets rose US$10bn, reflecting continued capex on buildings and network equipment. We expect cash & cash equivalents to increase in FY21e from US$17.5bn to US$29.5bn, from operational cash flows and lower net marketable securities and purchases of equity investments. We also expect PPE & IA to increase significantly, in line with increased capex of US$20bn, up US$5bn YoY.
|
BUSINESS MODEL Facebook builds products that enable people to connect and share with friends and family through mobile devices, personal computers, VR headsets, and in-home devices. Through these products, Facebook enables people to share opinions, ideas, photos, videos, and other activities with a wide array of audiences. Their range of products includes Facebook, Instagram, Messenger, WhatsApp, and Facebook Reality Labs.
The bulk of revenue is generated from selling advertising placements to marketers, enabling marketers to reach people based on factors like age, gender, location, interests, behaviours, through targeted ads. Purchased ads can appear on a range of places including Facebook, Instagram, Messenger, and other third-party applications or websites.
|
|
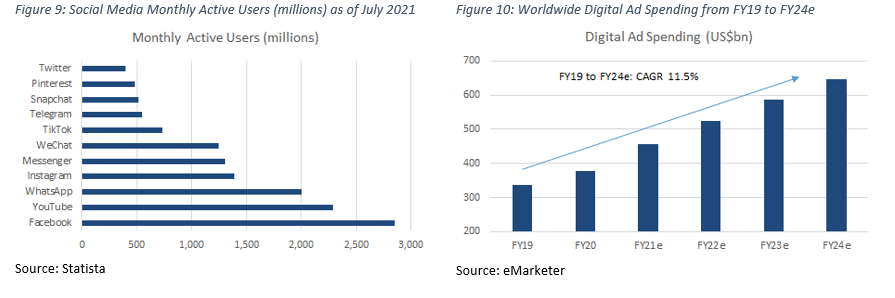
INDUSTRY The social media industry is largely dominated by Facebook and Google. Aside from WeChat, which is predominately used in China, Facebook and Google are the only companies with platforms exceeding one billion monthly active users – as of July 2021. However, competition to build and develop new and innovative tools within the social media industry is still very high, as companies look to continue attracting new and existing users onto its platforms.
According to eMarketer, worldwide digital ad spending is expected to increase from $335bn in FY19 to $645bn in FY24e, with a CAGR of 11.5%. We expect this trend of increased digital ad spending to provide tailwinds for the overall industry moving forward.
|
RISKS
- Antitrust battle with the US Federal Trade Commission. The FTC and 46 other states in the US filed a court complaint against FB in December 2020, for creating a social-media monopoly through its acquisition of Instagram, WhatsApp and smaller start-ups. The FTC’s ultimate goal is to force FB to unwind these acquisitions. The case is still ongoing.
- User data and privacy concerns. Concerns over data misuse by FB surfaced in 2018 when the company allegedly sold user data it obtained on its platform to a third-party data analytics firm, Cambridge Analytica, without consent from its users. When the dust settled in 2019, FB had to pay a record US$5bn settlement to the FTC.
- Changes in third-party privacy settings. In 2Q FY21, Apple rolled out a new feature on its iOS 14 aptly named “App Tracking Transparency”. With this feature, Apple users – many of whom regularly use FB, are given more control and transparency over who they provide their data to and what kind of data is provided. This could be a hurdle for FB as users would be able to restrict significant amounts of data provided to FB – reducing the effectiveness of its targeted advertisement campaigns. To counter this, FB plans to re-engineer algorithms used in its targeted ads to be more efficient using fewer data points.
- Biden’s corporate tax plan. Another risk for FB is President Biden’s proposed corporate tax rate hike from 21% to 28%. The President is also considering imposing a minimum tax rate of 15% on book income and a minimum 21% tax rate on companies’ foreign earnings to ensure profits in tax havens are taxed appropriately.
VALUATION
We initiate coverage on Facebook Inc. with a BUY rating and a price target of US$424.00. Our valuation is based on DCF valuation, using a 6.7% WACC and 4% terminal growth rate.
About the author

Jonathan Woo
Research Analyst
PSR
Jonathan covers the US technology sector focusing on internet companies. Formerly a national and professional athlete, he graduated from the University of Oregon with a Bachelor’s Degree in Social Sciences.


About the author
Jonathan Woo
Research Analyst
PSR
Jonathan covers the US technology sector focusing on internet companies. Formerly a national and professional athlete, he graduated from the University of Oregon with a Bachelor’s Degree in Social Sciences.
 Apr 19th - Things to Know Before the Opening Bell
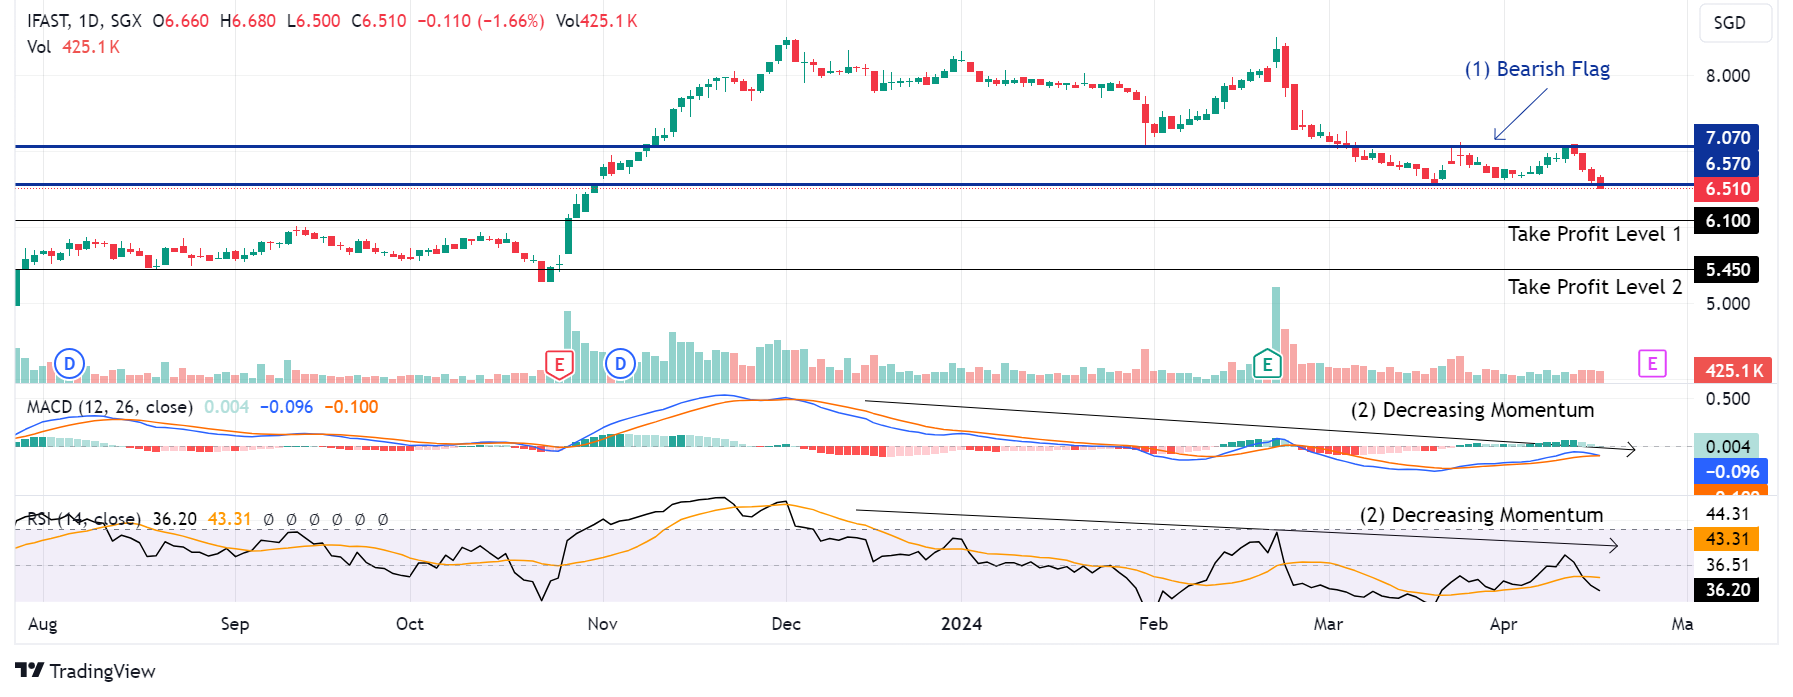 Trade of the Day - iFAST Corporation Ltd (SGX: AIY)
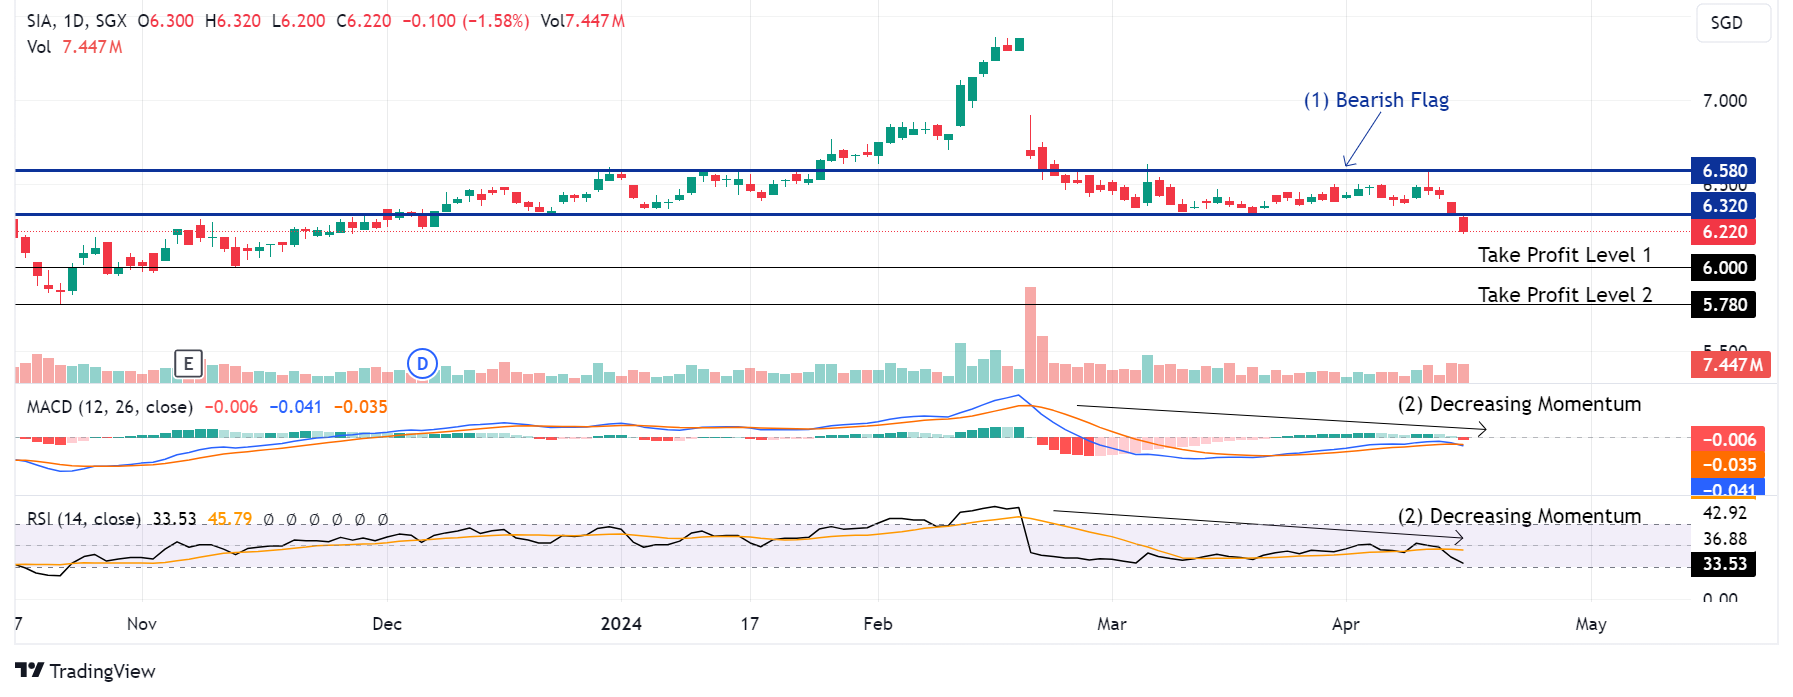 Trade of the Day - Singapore Airlines (SGX: C6L)
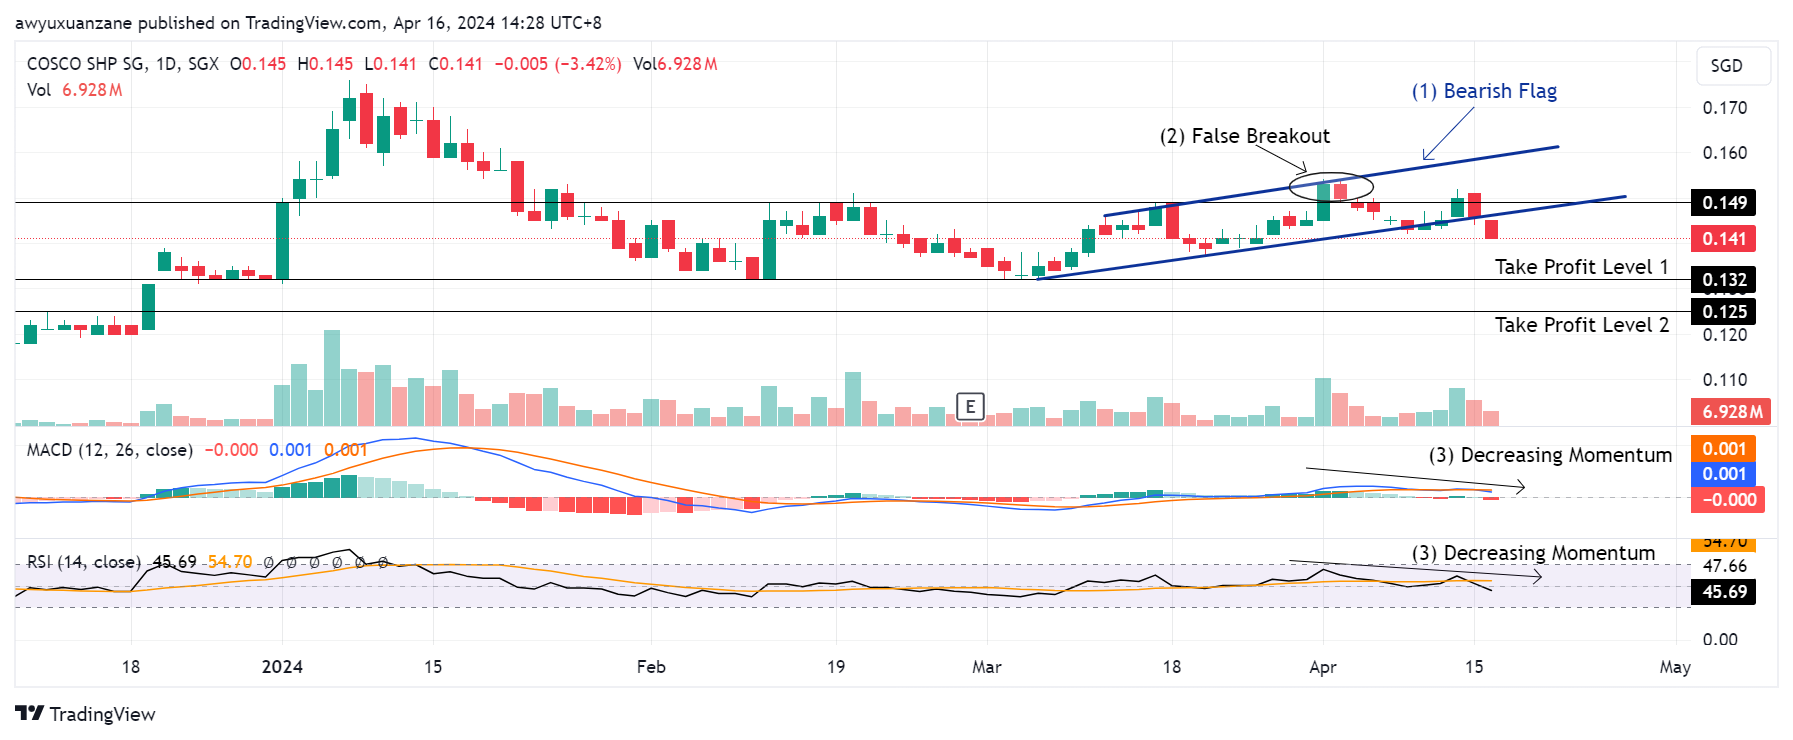 Trade of the Day - COSCO Shipping International (Singapore) Co Ltd (SGX: F83)