

Company Overview
Wells Fargo & Company is one of America’s largest financial institutions, operating across multiple segments including Consumer Banking, Corporate and Investment Banking (CIB), and Wealth and Investment Management (WIM). The bank has been navigating regulatory constraints through an asset cap removal, which has now enabled significant balance sheet expansion opportunities.
Strong Second Quarter Performance
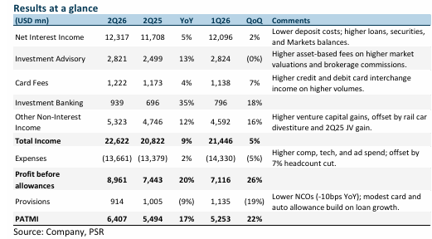
Wells Fargo reported impressive second quarter 2026 earnings of US$6.4 billion, representing a 17% year-on-year increase that slightly exceeded analyst estimates. The strong performance brought first-half earnings to 52% of the full-year forecast, demonstrating robust momentum. The bank achieved a return on tangible common equity (ROTCE) of 17.7%, up from 15.2% in the prior year quarter, whilst expenses rose only 2% despite significant business growth.
Comprehensive Revenue Growth Across All Segments
The bank delivered exceptional fee income growth, with non-interest income rising 13% year-on-year to US$10.3 billion. Investment advisory fees increased 13% on higher market valuations, whilst investment banking fees surged 35% as corporates returned to the debt and equity capital markets. Markets revenue grew 24%, supported by venture capital gains.
Every business segment contributed to growth, with CIB revenue up 16%, WIM growing 13% with client assets reaching US$2.4 trillion, and both Consumer Banking and Commercial Banking expanding 6%. Non-interest income now represents 46% of total revenue, up from 44% previously.
Balance Sheet Expansion Drives Net Interest Income
For the first time in a decade, Wells Fargo achieved double-digit balance sheet growth. Average loans expanded 12% year-on-year to US$1.03 trillion, whilst deposits grew by 10% to US$1.47 trillion. This growth occurred across both consumer and commercial businesses, with CIB average loans rising 26% as the bank redeployed capacity freed by the asset cap removal.
Net interest income rose 5% year-on-year to US$12.3 billion, marking the fourth consecutive quarter of growth. The bank maintained full-year NII guidance of approximately US$50 billion, with management indicating stronger growth expected in the second half.
Research Recommendation
Phillip Securities Research maintains a BUY rating with a higher target price of US$115, raised from US$98 previously. The upgrade reflects increased earnings estimates driven by higher NII, investment advisory, brokerage and investment banking forecasts, alongside lower provision estimates. The bank remains the top pick among major banks, offering unique growth opportunities through post-asset cap expansion at attractive valuations of 10.3 times forward price-to-earnings versus 12 times to 14 times for peers.
Frequently Asked Questions
Q: What was Wells Fargo's second quarter 2026 earnings performance?
A: Wells Fargo reported second quarter earnings of US$6.4 billion, up 17% year-on-year, slightly above estimates. First-half earnings reached 52% of the full-year forecast, with ROTCE improving to 17.7% from 15.2% previously.
Q: How did the bank's loan and deposit growth perform?
A: The bank achieved its first double-digit balance sheet growth in a decade, with average loans growing 12% year-on-year to US$1.03 trillion and deposits rising 10% to US$1.47 trillion across both consumer and commercial businesses.
Q: Which business segments contributed to revenue growth?
A: All segments delivered growth, with CIB revenue up 16%, WIM growing 13% with client assets reaching US$2.4 trillion, and both Consumer Banking and Commercial Banking expanding 6%. Non-interest income rose 13% to US$10.3 billion.
Q: What is Phillip Securities Research's investment recommendation?
A: Phillip Securities maintains a BUY rating with a raised target price of US$115, up from US$98. Wells Fargo remains their top pick among major banks due to unique growth opportunities and attractive valuations.
Q: How did net interest income perform and what is the outlook?
A: Net interest income rose 5% year-on-year to US$12.3 billion for the fourth consecutive quarter of growth. The bank maintained full-year NII guidance of approximately US$50 billion, with stronger growth expected in the second half.
Q: What drove the improvement in fee income?
A: Fee income growth was broad-based, with investment advisory fees up 13% on higher market valuations, investment banking fees surging 35% on corporate issuance recovery, markets revenue growing 24%, and venture capital gains providing additional support.
Q: How did credit quality and provisions trend?
A: Credit quality improved with provisions falling 9% year-on-year to US$914 million, and the net charge-off rate declining 10 basis points year-on-year to 0.34% on lower commercial and consumer losses.
Q: What makes Wells Fargo attractive compared to peers?
A: Wells Fargo offers a unique growth runway through post-asset cap balance sheet expansion that competitors like JPM and BAC lack, whilst trading at attractive valuations of 10.3 times forward P/E versus 12 times to 14 times for peers.
This article has been auto-generated using PhillipGPT. It is based on a report by a Phillip Securities Research analyst.
Disclaimer
These commentaries are intended for general circulation and do not have regard to the specific investment objectives, financial situation and particular needs of any person. Accordingly, no warranty whatsoever is given and no liability whatsoever is accepted for any loss arising whether directly or indirectly as a result of any person acting based on this information. You should seek advice from a financial adviser regarding the suitability of any investment product(s) mentioned herein, taking into account your specific investment objectives, financial situation or particular needs, before making a commitment to invest in such products.
Opinions expressed in these commentaries are subject to change without notice. Investments are subject to investment risks including the possible loss of the principal amount invested. The value of units in any fund and the income from them may fall as well as rise. Past performance figures as well as any projection or forecast used in these commentaries are not necessarily indicative of future or likely performance.
Phillip Securities Pte Ltd (PSPL), its directors, connected persons or employees may from time to time have an interest in the financial instruments mentioned in these commentaries.
The information contained in these commentaries has been obtained from public sources which PSPL has no reason to believe are unreliable and any analysis, forecasts, projections, expectations and opinions (collectively the “Research”) contained in these commentaries are based on such information and are expressions of belief only. PSPL has not verified this information and no representation or warranty, express or implied, is made that such information or Research is accurate, complete or verified or should be relied upon as such. Any such information or Research contained in these commentaries are subject to change, and PSPL shall not have any responsibility to maintain the information or Research made available or to supply any corrections, updates or releases in connection therewith. In no event will PSPL be liable for any special, indirect, incidental or consequential damages which may be incurred from the use of the information or Research made available, even if it has been advised of the possibility of such damages. The companies and their employees mentioned in these commentaries cannot be held liable for any errors, inaccuracies and/or omissions howsoever caused. Any opinion or advice herein is made on a general basis and is subject to change without notice. The information provided in these commentaries may contain optimistic statements regarding future events or future financial performance of countries, markets or companies. You must make your own financial assessment of the relevance, accuracy and adequacy of the information provided in these commentaries.
Views and any strategies described in these commentaries may not be suitable for all investors. Opinions expressed herein may differ from the opinions expressed by other units of PSPL or its connected persons and associates. Any reference to or discussion of investment products or commodities in these commentaries is purely for illustrative purposes only and must not be construed as a recommendation, an offer or solicitation for the subscription, purchase or sale of the investment products or commodities mentioned.
This advertisement has not been reviewed by the Monetary Authority of Singapore.