Beginner’s Guide to Investing: Part 2/2 June 4, 2020

For the past 2 months, the stock market has been unpredictable. We have seen large volatility and major corrections across global stock markets and indices. The decrease in demand for oil amid the COVID-19 pandemic has resulted in plunge in oil prices. Now, the question that investors are asking is: Where will market prices go from here?
In this article, we will use the basics of technical analysis and indicators to analyse different market patterns and prices.
Technical Analysis versus Fundamental Analysis
As touched on very briefly in Part 1 of this article, technical analysis is a method of analysing the future price movements using historical market prices, trends and market data. Technical analysis is most often deemployed to see the price action in the short-term trend, based on the demand and supply forces in the market. On other hand, fundamental analysis is used to evaluate a company’s long-term intrinsic value based on its financials.
Since technical analysis relies on the past data of the market and may not be reflective of market conditions going forward, it may or may not be suitable for investors who prefer to use fundamental analysis to evaluate a company, or intends to invest in a long-term horizon.
Technical analysis includes looking at price charts, moving averages and technical indicators. These indicators can range from simple to more complicated indicators. Today we will be looking at more basic indicators such as price charts, support and resistance.
Should you buy a stock at its support or resistance levels? How do you tell when it will continue its upward or downward trend?
Support levels are psychological price levels where market price stops falling and is ‘supported’ at that level, whereas resistance levels are psychological price levels where market prices are expected to stop rallying and is ‘resisted’ at that level.

Generally, in an upward trend, markets will tend to show some buying pressure at the support levels. If these key psychological support levels are broken, this can be a signal that the upward trend is over and market is entering a correction phase. Conversely, markets will tend to show some selling pressure at resistance levels. If some key psychological resistance levels are broken, this could in turn signal a bullish market that is poised for an upward movement.
How do you tell if a market has bottomed (or peaked)?
While there is no fool-proof way to confirm whether a market has bottomed/peaked, you can use technical indicators to further enhance your prediction.
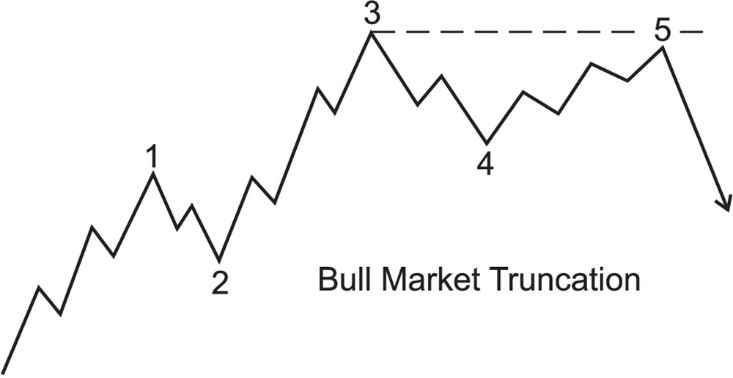
Price movements in market trends generally move in the form of waves. From a technical perspective, in a bull market, prices are pushed upwards before facing some form of correction downwards. Over time, when we start to see market prices narrowing, or when a series of equal or even lower peaks are formed, this can be a signal that the market is heavily resisted and is nearing its peak.

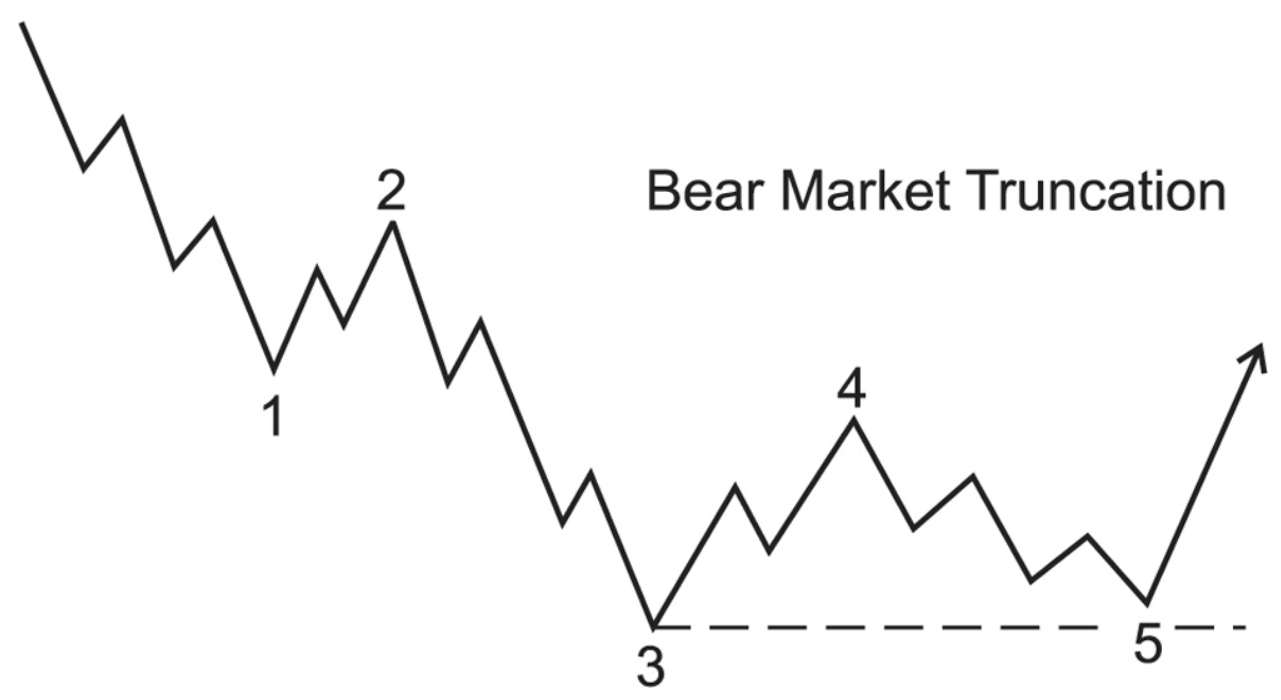
Similarly, for a downward trend in a bear market, a series of equal or higher lows will signal that market is heavily supported and could bottom out soon.

How do you spot a trend reversal?
When we see prices consolidating or trading within a small range of prices for extended periods of time, it may signal that it is difficult for the market sentiment to continue the same momentum.
Another reference that investors can use to spot trend reversals is to take note when prices drop below their key support levels or long-term moving average in a bull market and vice versa.
Ideally the best time to buy is when the price hits rock bottom, and sell when the price reaches the highest peak, but very few can consistently enter at the absolute lowest or exit at highest price. Hence the next best alternative in a market crash is to enter when you see a confirmation that your price has broken out of the previous resistance level and is now on an upward trend.
The bottom line is that there is no sure-fire way to precisely pinpoint when a trend reverses, but with a combination of technical and fundamental analysis tools, it is still possible for investors to enter and exit such they do not miss out the main bulk of price action in the long run. For long term investors, it is also important to consider the fair value of a company, whether it can continue sustaining future growth based on its underlying fundamentals.
Please refer to Part 1 of this article: https://www.poems.com.sg/market-journal/beginners-guide-to-investing-part-1-2/
Disclaimer
These commentaries are intended for general circulation. It does not have regard to the specific investment objectives, financial situation and particular needs of any person who may receive this document. Accordingly, no warranty whatsoever is given and no liability whatsoever is accepted for any loss arising whether directly or indirectly as a result of any person acting based on this information. Opinions expressed in these commentaries are subject to change without notice. Investments are subject to investment risks including the possible loss of the principal amount invested. The value of the units and the income from them may fall as well as rise. Past performance figures as well as any projection or forecast used in these commentaries are not necessarily indicative of future or likely performance. Phillip Securities Pte Ltd (PSPL), its directors, connected persons or employees may from time to time have an interest in the financial instruments mentioned in these commentaries. Investors may wish to seek advice from a financial adviser before investing. In the event that investors choose not to seek advice from a financial adviser, they should consider whether the investment is suitable for them.
The information contained in these commentaries has been obtained from public sources which PSPL has no reason to believe are unreliable and any analysis, forecasts, projections, expectations and opinions (collectively the “Research”) contained in these commentaries are based on such information and are expressions of belief only. PSPL has not verified this information and no representation or warranty, express or implied, is made that such information or Research is accurate, complete or verified or should be relied upon as such. Any such information or Research contained in these commentaries are subject to change, and PSPL shall not have any responsibility to maintain the information or Research made available or to supply any corrections, updates or releases in connection therewith. In no event will PSPL be liable for any special, indirect, incidental or consequential damages which may be incurred from the use of the information or Research made available, even if it has been advised of the possibility of such damages. The companies and their employees mentioned in these commentaries cannot be held liable for any errors, inaccuracies and/or omissions howsoever caused. Any opinion or advice herein is made on a general basis and is subject to change without notice. The information provided in these commentaries may contain optimistic statements regarding future events or future financial performance of countries, markets or companies. You must make your own financial assessment of the relevance, accuracy and adequacy of the information provided in these commentaries.
Views and any strategies described in these commentaries may not be suitable for all investors. Opinions expressed herein may differ from the opinions expressed by other units of PSPL or its connected persons and associates. Any reference to or discussion of investment products or commodities in these commentaries is purely for illustrative purposes only and must not be construed as a recommendation, an offer or solicitation for the subscription, purchase or sale of the investment products or commodities mentioned.
About the author
Chua Boon Siang
Equities Specialist
Boon Siang holds a Bachelor Degree of Social Science in Economics from National University of Singapore, with a specialization in monetary and financial economics. He is proficient in stock trading using Technical Analysis and has a good grasp of macroeconomics and fundamentals in the SGX market. Apart from providing dealing services, he also conducts training seminars to further introduce financial knowledge to the public.

 Back in Business: The Return of IPOs & Top Traded Counters in March 2024
  From $50 to $100: Unveiling the Impact of Inflation
  How to soar higher with Positive Carry!
  Why 2024 Offers A Small Window of Opportunity and How to Position Yourself to Capture It


