Investing in Indonesia – Things to Know May 2, 2019

2019 is slated to be a busy year, with a number of countries having held or scheduled to hold their elections. These countries include Thailand, Japan, Canada and Hong Kong. Indonesia, the country with the largest population in Southeast Asia, held its elections in April. With that as the backdrop, let us explore the investment climate of Indonesia and some notable companies.
Economic background
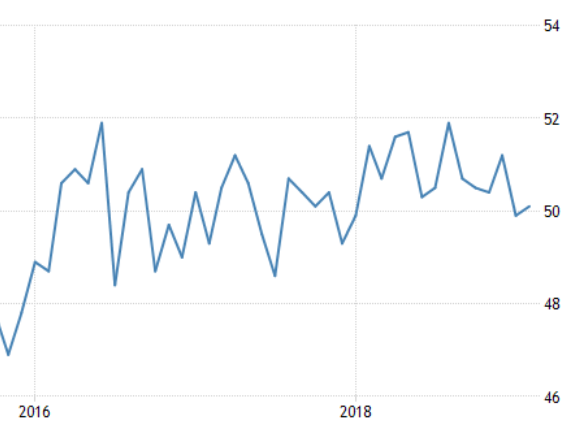
Indonesia’s average GDP growth has maintained at around 5 percent over the past few years. It is the second-best performing G20 economy, just behind China. This momentum of growth is expected to continue in 2019, as projected by the World Bank and International Monetary Fund (IMF), with an estimated growth rate of around 5.1%.1 Since the last quarter of 2015, the Indonesia Manufacturing Purchasing Managers’ Index (PMI) has been rising, surpassing the 50 mark on several occasions as seen below; indicating an expansion in the manufacturing sector.2
Image 1: Indonesia Manufacturing PMI
 (Source: Trading Economics)
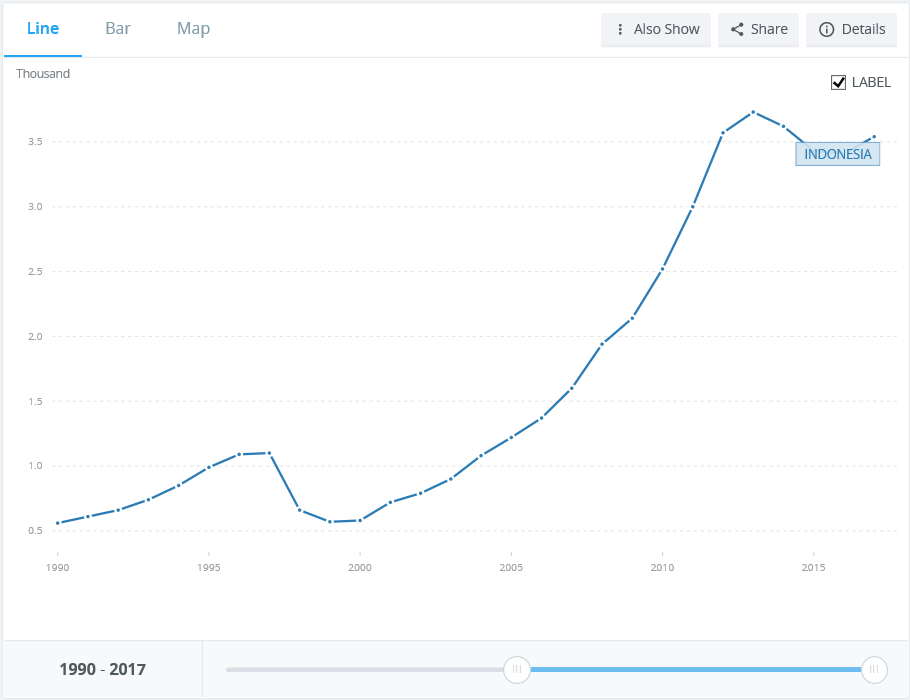
Aside from the PMI figures and the growth rate, Indonesia’s Gross National Income (GNI) has also improved by approximately 6 times since 1990, from USD 560 in 1997 to USD 3,540 in 2017 as seen below.3
Image 2: GNI Per capita (Current US$)
 (Source: World Bank Group)
Government Initiatives
The Indonesia government has been focusing on driving the manufacturing, infrastructure and services sectors to help spur the nation towards being a vibrant and competitive economy. During the 2008 recession, Indonesia performed relatively well, maintaining high growth during difficult times.
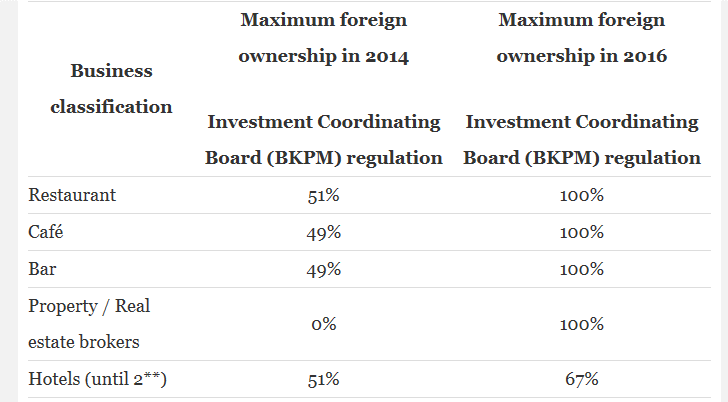
Beyond the macro-economic events, back at home, the investment climate seems to have taken a positive turn. In a bid to enforce and fight corruption activities, the government set up the United Nations Convention Against Corruption (UNCAC). This has in turn helped Indonesia improve their global ranking, with the effects of this move expected to continue for many years to come. Concurrently, the government has also eased up on its policy on foreign ownership of companies from 0% to 100%, depending on business classification as seen below. This will further improve the attractiveness of Indonesia as an investment destination.4
Image 3: Foreign ownership of Indonesia Companies based on Business Classification
 (Source: EMERHUB)
A key driver of a nation’s economy is its people. Indonesia has the world’s 4th largest population which is growing at a rate of roughly 3 million people each year. The nation is filled with a large proportion of young and fit working adults which is an excellent demographic trend to help propel Indonesia’s growth.
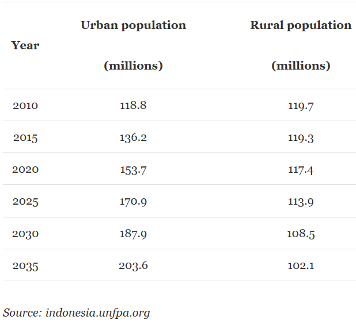
Indonesia is becoming an urbanised nation at a much faster pace compared to a decade ago as seen below. The younger generation of working adults are consuming more products and services than ever before. With this increase in spending, the economy is poised to grow at a faster pace.5
Image 4: Population Growth
Indonesia’s Jakarta Composite Index (JCI) Stock Market Performance
The JCI has achieved 32.65% total return over the past 4 years, from FY2014 to FY2018, outperforming other major indices as seen in Table 1. Through the many economic initiatives, Indonesia has become one of the fastest growing economies in Southeast Asia, elevating the country’s status as an investment destination.
Table 1: Major index performance from 2014 to 2018 (rebased in USD)
| Security | Price Change | Total Return | Difference |
| STI Index | -10.86% | 5.83% | -26.82% |
| JCI Index | 19.88% | 32.65% | – |
| HSI Index | 8.21% | 30.10% | -2.55% |
| SHSZ300 Index | 14.05% | 27% | -5.65% |
| SHCOMP Index | 3.99% | 16.49% | -16.15% |
| SZCOMP Index | 4.41% | 8.96% | -23.69% |
(Source: Bloomberg)
View entire list of Global Stock Market Indices performance that are tradable through POEMS
Stock Screening of Indonesia counters
After looking at the overview of the Indonesia economy and stock market performance, we have compiled a list of large market capitalisation Indonesian companies that might have the potential to ride Indonesia’s wave of growth in Table 2. We have also included Table 3 which shows top counters based on analysts’ recommendations.
Table 2: Top 10 Listed Companies by Market Capitalisation
| Ticker | Short Name | Market Cap (IDR) | Price (IDR) | Best Target Price (IDR) | Best Div Yield (%) | Total Buy call | Total Hold call | Total Sell call | P/E |
| BBCA IJ | BANK CENTRAL ASIA | 674.93T | 27375 | 28099 | 1.28 | 14 | 19 | 3 | 26.11 |
| BBRI IJ | BANK RAKYAT INDO | 510.65T | 4140 | 4293 | 3.17 | 26 | 10 | 0 | 15.64 |
| HMSP IJ | HM SAMPOERNA | 437.36T | 3760 | 4313 | 3.25 | 22 | 8 | 1 | 32.32 |
| TLKM IJ | TELEKOMUNIKASI | 389.32T | 3930 | 4366 | 4.24 | 27 | 7 | 0 | 21.10 |
| UNVR IJ | UNILEVER IND | 372.73T | 48850 | 46268 | 2.06 | 4 | 15 | 11 | 40.92 |
| BMRI IJ | BANK MANDIRI | 346.5T | 7425 | 8540 | 3.33 | 24 | 10 | 0 | 13.59 |
| ASII IJ | ASTRA INTERNATIOL | 294.52T | 7275 | 8622 | 3.43 | 26 | 6 | 1 | 11.68 |
| BBNI IJ | BANK NEGARA INDO | 175.30T | 9400 | 9961 | 3.22 | 25 | 8 | 1 | 11.68 |
| GGRM IJ | GUDANG GARAM | 159.31T | 82800 | 92555 | 3.12 | 26 | 3 | 3 | 20.45 |
| ICBP IJ | INDOFOOD CBP | 107.29T | 9200 | 10858 | 2.41 | 16 | 10 | 4 | 23.45 |
Table 3: Top listed counters by Analyst Recommendation
| Ticker | Short Name | Best Analyst Rating (5 highest score) | Total Analyst Recommendation | Market Cap | Price | Best Target Price | P/E | Total Return YTD |
| JPFA IJ | JAPFA COMFEED INDO | 5.00 | 20 | 28.14T | 2400 | 2761 | 12.13 | 11.63 |
| ANTM IJ | ANEKA TAMBANG | 4.93 | 14 | 23.19T | 965 | 1155 | 26.66 | 26.14 |
| WTON IJ | WIJAYA KARYA BETON | 4.79 | 14 | 4.9T | 565 | 642 | 10.48 | 50.27 |
| MAPI IJ | MITRA ADIPERKASA | 4.77 | 22 | 17.93T | 1080 | 1170 | 30.52 | 34.16 |
| EXCL IJ | XL AXIATA | 4.74 | 35 | 27.25T | 2550 | 3274 | – | 28.79 |
| PTPP IJ | PP PERSERO | 4.73 | 22 | 12.77T | 2060 | 2756 | 8.43 | 14.13 |
| WIKA IJ | WIJAYA KARYA | 4.70 | 23 | 16.82T | 1875 | 2306 | 12.41 | 13.29 |
| ERAA IJ | ERAJAYA SWASEMBADA | 4.69 | 13 | 6.41T | 2010 | 3130 | 7.80 | -8.64 |
| PWON IJ | PAKUWON JATI | 4.61 | 23 | 30.34T | 630 | 753 | 13.70 | 1.61 |
| UNTR IJ | UNITED TRACTORS | 4.61 | 28 | 97.36T | 26100 | 34679 | 8.74 | -4.57 |
(Source: Bloomberg)
Here are two Indonesia companies from the above 2 tables that are worth highlighting.
BANK RAKYAT INDO (BBRI)
Since its incorporation in 1895, BBRI has a network spanning 19 regional offices. The bank’s priority is to serve their key businesses in the micro, small and medium enterprise segments. They are poised to reinforce their leading position by developing new innovations in the industry.
BBRI is the second largest bank in Indonesia based on market capitalisation, with a low price to earnings ratio (P/E) of 15.64 as compared to their closest rival Bank Central Asia’s P/E of 26.11. BBRI generates almost 54% of their net income from micro and program business segments, one of the bank’s main pillars and also an area which the bank will continue to focus on.
In FY2018, the business performed well, recording a steady growth of 34.1% in their micro loan business, a key revenue driver, placing it well on track to achieve its long term growth plan. The main growth driver comes from the micro, consumer and small commercial businesses. Non-interest income from fee based and recovery income are also another highlight as it grew from 15.5% and 25% respectively. The bank also saw improvement in their nonperforming loan coverage ratio to above 200%, helping to bump up their net profit to 11.36% YOY with a stable ROA of 3.68% and a ROE of 20.49%.6
JAPFA Comfeed (JPFA)
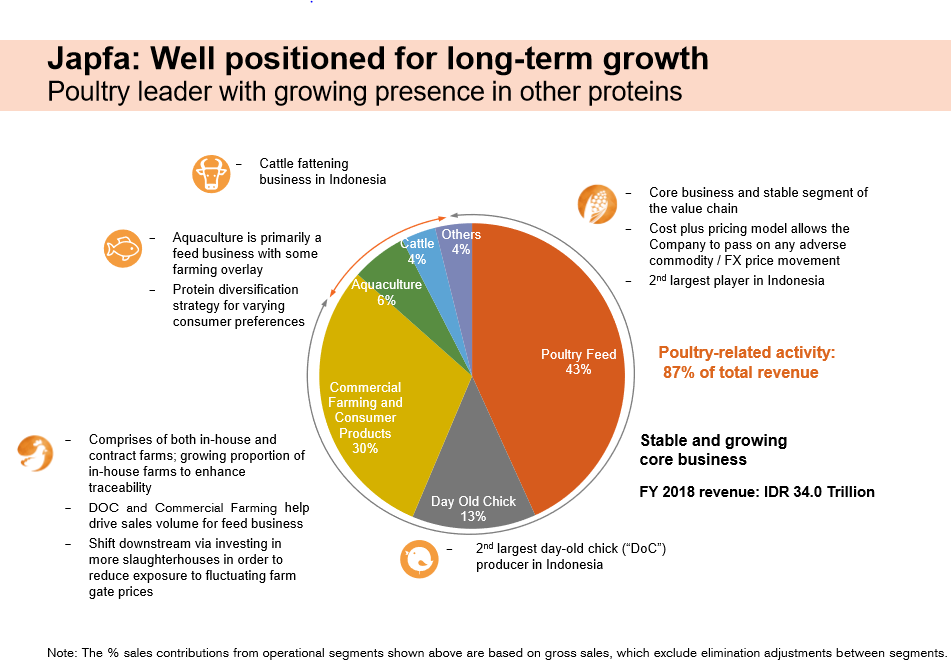
PT Japfa Comfeed Indonesia Tbk is an Indonesia-based company primarily engaged in manufacturing animal feed. The company is headquartered in Singapore, with operations in 5 growing Asia markets, namely Indonesia, Vietnam, Myanmar, China and India. It is the 2nd largest poultry and day-old-chick (DoC) player in Indonesia with its business classified into the following divisions: poultry feed, DoC, commercial farming and consumer products, aquaculture, cattle and others. The below shows an overview of Japfa’s business.
Image 5: Japfa Overview
 (Source: JPFA Annual Report)
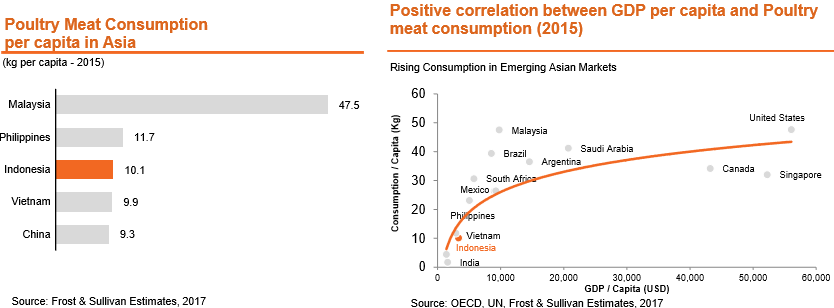
Indonesia’s GDP per capita is projected to grow for years to come. Based on image 6, as GDP per capita grows, protein, specifically poultry, stands to play a bigger role in consumer preference. Poultry is expected to become the “Meat-of-choice”, in turn increasing protein consumption from the country’s carbohydrate-heavy lifestyle. The potential increase in consumption of poultry, coupled with the fact that Indonesia currently has one of the lowest poultry consumption per capita in Asia, places JPFA in an excellent position to benefit from this shift in consumption.
Image 6: Poultry Consumption in Asia and Correlation between GDP per Capita and Poultry Consumption
Revenue increased 14.9%, mainly from poultry feed, of which sales volume increased approximately 6%. Breeding operations higher productivity, coupled with a lack of supply in Indonesia, created a win-win situation for JPFA as seen from the exceptionally strong profits recorded by the company in FY2018.7 Commercial farm operation and aquaculture feed similarly recorded growth in sales figures. FY2018 Profit After Tax (PAT) is at IDR 2,253billion, which is an increment of 116% from FY2017.8
 (Source: JPFA Annual Report)
With good economic projections, healthy demographic tailwinds and a stronghold in the industry following its exceptional performance growth in 2018, JPFA looks to have more good years to come.
Conclusion
With projections pointing to continued growth for Indonesia in 2019, investors can consider investing in the Indonesia Stock Market to take advantage of the growth potential, as well as to make it part of their portfolio diversification strategy.
Information is accurate as of 2 Apr 2019.
Reference:
- [1] https://www.indonesia-investments.com/news/todays-headlines/imf-cuts-outlook-for-economic-growth-in-indonesia-world/item8995?
- [2] https://tradingeconomics.com/indonesia/manufacturing-pmi
- [3] https://data.worldbank.org/indicator/NY.GNP.PCAP.CD?end=2017&locations=ID&start=2008
- [4] https://www.ethiscrowd.com/blog/7-reasons-invest-indonesia/
- [5] https://emerhub.com/indonesia/10-reasons-invest-indonesia/
- [6] http://www.ir-bri.com/financials.html
- [7] https://www.japfacomfeed.co.id/en/investors/investor-presentations – (Investor presentation FY2018)
- [8] https://www.japfacomfeed.co.id/en/investors/annual-reports
Disclaimer
All data presented are from Phillip CFD and accurate as of end February 2019. All foreign indices are represented in their respective local currencies.
These commentaries are intended for general circulation. It does not have regard to the specific investment objectives, financial situation and particular needs of any person who may receive this document. Accordingly, no warranty whatsoever is given and no liability whatsoever is accepted for any loss arising whether directly or indirectly as a result of any person acting based on this information. Opinions expressed in these commentaries are subject to change without notice. Investments are subject to investment risks including the possible loss of the principal amount invested. The value of the units and the income from them may fall as well as rise. Past performance figures as well as any projection or forecast used in these commentaries are not necessarily indicative of future or likely performance. Phillip Securities Pte Ltd (PSPL), its directors, connected persons or employees may from time to time have an interest in the financial instruments mentioned in these commentaries. Investors may wish to seek advice from a financial adviser before investing. In the event that investors choose not to seek advice from a financial adviser, they should consider whether the investment is suitable for them.
The information contained in these commentaries has been obtained from public sources which PSPL has no reason to believe are unreliable and any analysis, forecasts, projections, expectations and opinions (collectively the “Research”) contained in these commentaries are based on such information and are expressions of belief only. PSPL has not verified this information and no representation or warranty, express or implied, is made that such information or Research is accurate, complete or verified or should be relied upon as such. Any such information or Research contained in these commentaries are subject to change, and PSPL shall not have any responsibility to maintain the information or Research made available or to supply any corrections, updates or releases in connection therewith. In no event will PSPL be liable for any special, indirect, incidental or consequential damages which may be incurred from the use of the information or Research made available, even if it has been advised of the possibility of such damages. The companies and their employees mentioned in these commentaries cannot be held liable for any errors, inaccuracies and/or omissions howsoever caused. Any opinion or advice herein is made on a general basis and is subject to change without notice. The information provided in these commentaries may contain optimistic statements regarding future events or future financial performance of countries, markets or companies. You must make your own financial assessment of the relevance, accuracy and adequacy of the information provided in these commentaries.
Views and any strategies described in these commentaries may not be suitable for all investors. Opinions expressed herein may differ from the opinions expressed by other units of PSPL or its connected persons and associates. Any reference to or discussion of investment products or commodities in these commentaries is purely for illustrative purposes only and must not be construed as a recommendation, an offer or solicitation for the subscription, purchase or sale of the investment products or commodities mentioned.
About the author
Mr. Chen JinHui
Equity Dealer
Chen Jinhui deals in global market equities, which encompasses markets from Malaysia, Thailand, Indonesia, Hong Kong and more. He has 2.5 years of dealing experience and currently support traders, dealers and fund managers on dealing activities. He graduated with a Bachelor of Science in Finance from the Singapore Institute of Management.

 Back in Business: The Return of IPOs & Top Traded Counters in March 2024
  From $50 to $100: Unveiling the Impact of Inflation
  How to soar higher with Positive Carry!
  Why 2024 Offers A Small Window of Opportunity and How to Position Yourself to Capture It


