Navigating through the Coronavirus Outbreak with CFDs February 12, 2020

“A stock market decline is as routine as a January blizzard in Colorado. If you’re prepared, it can’t hurt you. A decline is a great opportunity to pick up the bargains left behind by investors who are fleeing the storm in panic”Peter Lynch
The World Health Organization (WHO) has declared a global health emergency over the coronavirus. As at 10 Feb 2020, Covid-19 has killed more than 900 people in China and infected thousands worldwide.1 Covid-19 has sent shockwaves through the financial markets. Hong Kong and Singapore, whose economies are highly dependent on trade and global fund flows, are bound to see their economies impacted negatively.

No one can predict when this outbreak will end or the magnitude that financial markets will be impacted. What we can do, however, is focus on the things we can control.
For example:
1. Investigate the market’s past behaviour during similar outbreaks of infectious diseases to anticipate magnitude of impact.
2. Understand which sectors will be impacted during an infectious disease outbreak.
3. Hedge our portfolio against black swan events and uncertainties.
In this article, we will be looking back in time to analyse how financial market reacted to similar outbreaks of infectious diseases. Secondly, we will be investigating which sectors and asset classes will be impacted during an infectious disease outbreak. Last but not least, we will be looking at how Contracts for Differences (CFDs) can be used for hedging in times of such uncertainties.
Infectious Epidemics and Past Market Performance
“History doesn’t repeat itself, but it often rhymes”
~ Mark Twain
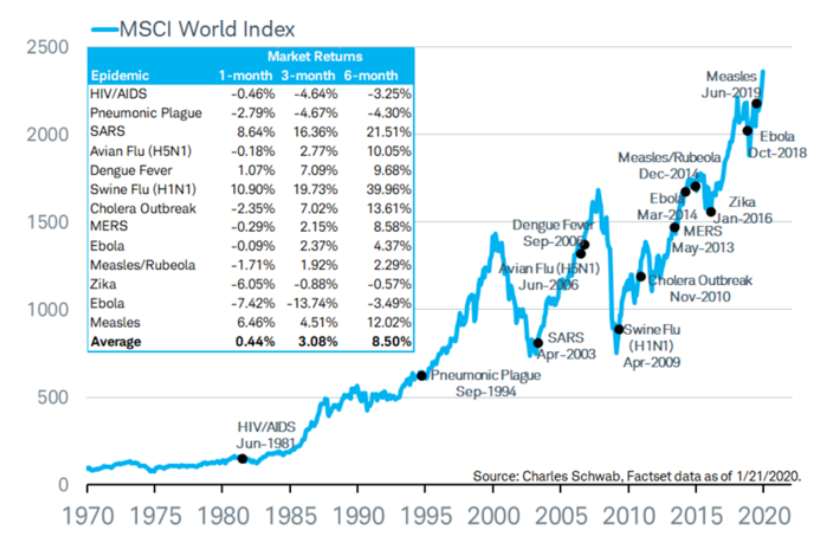
When attempting to analyse and investigate a particular event, it is ideal to look back into history to find out how markets reacted during that period in time. The good news is that historical data has shown that financial markets have been relatively resilient to past infectious epidemics. The MSCI World Index is a collection of 1655 counters from the world’s developed countries including Japan, Hong Kong and Singapore. From the MSCI World Index chart below, we can conclude that the global economy was relatively resilient to infectious epidemics. Approximately three months after the SARS epidemic, the MSCI returned to 16.36%.2

MCSI World Index2
In our opinion, the closest parallel to the Covid-19 was the SARS epidemic. According to data gathered from WHO and the Centres for Disease Control and Prevention, the SARS epidemic resulted in 8100 infected and 774 deaths. The fatality rate of SARS amounted to 9.5%.3 The fatality rate of Covid-19 ranges around 2%4 (Subjected to change) as of early February 2020.
Given the similarities between SARS epidemic and Covid-19’s outbreak, we decided to evaluate the impact that the SARS epidemic had on open economies such as Hong Kong and Singapore. The first case of SARS in China was reported on Saturday 16 November 2002. Therefore, we used Monday 18 November 2002 as the start date to analyse how the markets reacted to the SARS epidemic.5 Similar to the MSCI World Index, an initial 3-month decline was followed by a strong uptrend a year later.
| Start Date(18/11/2002) | 3 Months Return | 6 Months Return | 9 Months Return | 12 Months Return |
| Straits Times Index | -9.53% | 6.64% | 15.13% | 24.82% |
| Hang Seng Index | -7.24% | -8.00% | 5.09% | 23.02% |
Sectors Impacted
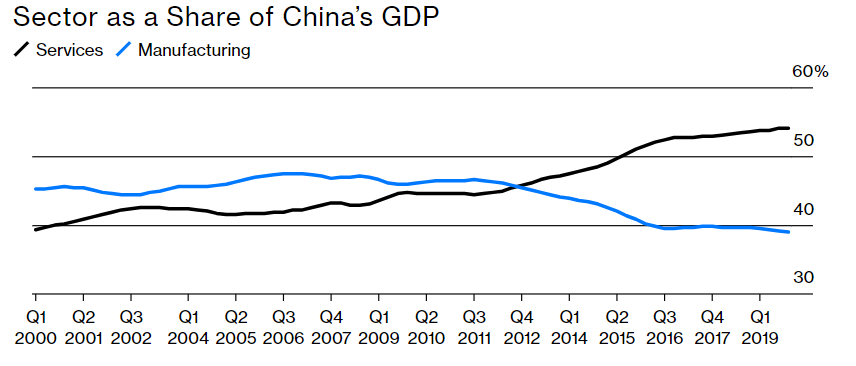
The Covid-19 Outbreak occurred near the time of Chinese New Year 2020, a rather untimely period where travelling and retail spending were generally at its peak. China’s GDP now amounts to 17% of the Global GDP as opposed to 4% in 2003. This infectious epidemic would put China GDP growth at 5.7%, and will be China’s lowest GDP growth in nearly three decades.6 During the SARS period in 2003, the service industry amounted to 42% of China’s GDP. As of 2019, the service industry amounted to 54% of China’s GDP. China’s GDP now amounts to 17% of the Global GDP as opposed to 4% in 2003.7

International Monetary Fund
In an event of an epidemic outbreak, industries such as tourism and its several economic and sub sectors such as transport, hospitality, and retail spending will feel the first brunt of impact. Below is a table of the counters and their respective industries that were affected.
| Name | Exchange | Contract Code | Industry | CFD Margin Requirement | Total Return (060120-060220) |
| CHINA SOUTHERN AIRLINES CO-H | HKSE | 1055 | Airlines | 30% | -20.77% |
| CHINA EASTERN AIRLINES CO-H | HKSE | 0670 | Airlines | 30% | -20.18% |
| SATS LTD | SGX | SATS | Airport Services | 10% | -12.21% |
| COMFORTDELGRO CORP LTD | SGX | CFD | Transportation | 10% | -9.32% |
| FAR EAST HOSPITALITY TRUST | SGX | FEHT | Hotel & Resort REITs | 20% | -8.67% |
| MALAYSIA AIRPORTS HLDGS BHD | KLSE | MAH | Airport Services | 20% | -8.20% |
| HAIDILAO INTERNATIONAL HOLDI | HKSE | 6862 | Consumer Services | 30% | -8.00% |
| SASSEUR REAL ESTATE INVESTMENT | SGX | SASUR | Retail REITs | 20% | -7.87% |
| MTR CORP | HKSE | 0066 | Transportation | 20% | -7.54% |
| EAGLE HOSPITALITY TRUST | SGX | EGHT | Hotel & Resort REITs | 20% | -7.27% |
| SIA | SGX | SIAA | Airlines | 10% | -4.77% |
| CHINA AIRCRAFT LEASING GROUP | HKSE | 1848 | Capital Goods | 40% | -3.95% |
| LENDLEASE GLOBAL COMMERCIAL | SGX | LREIT | Retail REITs | 10% | -4.77% |
| STARHILL GLOBAL REIT | SGX | CTM | Retail REITs | 20% | -0.51% |
| SPH REIT | SGX | SPHS | Retail REITs | 10% | 0.00% |
| CAPITALAND MALL TRUST | SGX | CTM | Retail REITs | 15% | 3.30% |
| CAPITALAND RETAIL CHINA TRUS | SGX | CRCT | Retail REITs | 20% | -4.403% |
| BHG RETAIL REIT | SGX | BHGR | Retail REITs | 20% | -5.109% |
| YTL HOSPITALITY REIT | KLSE | SRET | Hotel & Resort REITs | 30% | -5.109% |
| TRIP.COM | NASDAQ | TCOM | Travel Services | 20% | 0.09% |
| BOOKING.COM | NASDAQ | BKNG | Travel Services | 15% | -5.28% |
Data retrieved from Bloomberg, Total Returns over 1 month
During uncertainties, Gold and other precious metals are often favoured. However, not all industries will feel the brunt of the bear market. According to the table below, healthcare supplies and glove manufacturing counters have seen their counters appreciate.
| Name | Exchange | Contract Code | Industry | CFD Margin Requirement | total Return (060120-060220) |
| UG HEALTHCARE CORP LTD | SGX | UGHC | Health Care Supplies | 50% | 64.234% |
| QT VASCULAR LTD | SGX | QTVC | Health Care Supplies | 70% | 33.333% |
| MEDTECS INTERNATIONAL CORP | SGX | MIC | Health Care Supplies | 100% | 152.5% |
| SUPERMAX CORP BHD | KLSE | SUM | Health Care Supplies | 30% | 25.55% |
| TOP GLOVE CORP | KLSE | TOG | Health Care Supplies | 30% | 20.99% |
| RIVERSTONE HOLDINGS | SGX | RVS | Health Care Supplies | 20% | 6.11% |
| HARTALEGA HOLDINGS | KLSE | HTH | Health Care Supplies | 20% | 6.11% |
| RAFFLES MEDICAL | SGX | RAFSP | Health Care Supplies | 20% | 0.98% |
| COMFORT GLOVE | KLSE | IRC | Commodity Chemicals | 20% | 12.26% |
| HARTALEGA HOLDINGS | KLSE | HTH | Health Care Supplies | 20% | 6.11% |
Data retrieved from Bloomberg, Total Returns over 1 month
If one believes that the information factored into certain counters affected is temporary and reflects something shorter than his holding period, it may be wise to long and value cost average into these respective counters with strong balance sheets and free cash flow stability.
However, if one believes the uptrend in certain counters was due to a knee-jerk reaction or that the down trend is going to continue, it may be ideal to short these counters. CFDs are popular tools used for short selling as they have no contract expiry date and can bypass the need of share borrowing. Check out our guide on CFD short selling here!
Hedge Your Portfolio against Rising Uncertainty
“The Markets generally are unpredictable, so that one has to have different scenarios. The idea that you can actually predict what’s going to happen contradicts my way of looking at the Market”
~ George Soros
Contrary to popular opinion, Contracts for Differences (CFDs) are not restricted to technical traders. Long term investors can utilise CFDs to hedge their positions against unforeseen events and uncertainties.
One can use CFDs as a hedge in these 2 possible scenarios:
1) When the price of your existing positions has already moved/is moving against you.
2) When you anticipate future gains in your existing positions to be marginal due to increasingly negative market sentiment.
A practical application of CFD Indices for most buy and hold investors is hedging. This is an alternative to using a CFD to short sell each individual counter which they are currently holding. CFD indices generally have minimal commission fees and low margin requirements.
CFD Trading Example

George is a long-term investor with a $100,000 portfolio of stocks. Assuming most of George’s stock holdings are components of Index X. Assuming George’s portfolio has a beta of 1.5, the value to hedge would be:
$100,000 * 1.5 = $150,000
1 Contract value of Index X = $3300
Amount of Index X Contracts: $150,000/$3300 = 45
Assuming Index X has a margin requirement of 5%, and has an exposure of $1 per point. Therefore, George will be required to deposit $7425 (5/100*3300*30) for 45 contacts with a $148,500 short exposure.
A decline in the value of George’s equity portfolio would have been potentially offset by the gains in his short index position. This scenario is ideal for people seeking capital preservation for their nest egg as opposed to speculation.
Summary
“Mr Market’s job is to provide you with prices. Your job is to decide whether it is to your advantage to act on them. You do not have to trade with him just because he constantly begs you.”~ Benjamin Graham
Truth be told, no one has a crystal ball that can predict when an infectious epidemic will come, or when it will end. In my opinion, the best way to deal with such events is to learn from history and focus on what you can control. You can control your emotions and the price you pay. I sincerely hope that you have found value in this article. For more information on CFD trading, be sure to visit our website. Till next time, folks!
References:
- [1] https://www.aljazeera.com/news/2020/01/timeline-china-coronavirus-spread-200126061554884.html
- [2] https://www.schwab.com/resource-center/insights/content/will-virus-outbreak-lead-to-market-breakdown
- [3] https://www.cdc.gov/sars/about/fs-sars.html
- [4] https://www.worldometers.info/coronavirus/coronavirus-death-rate/
- [5] https://www.cdc.gov/about/history/sars/timeline.htm
- [6] https://www.straitstimes.com/business/economy/chinas-economy-will-grow-at-57-in-2020-oxford-economics-says
- [7] https://www.bloomberg.com/news/articles/2020-01-31/the-coronavirus-is-more-dangerous-for-the-economy-than-sars
Disclaimer
These commentaries are intended for general circulation. It does not have regard to the specific investment objectives, financial situation and particular needs of any person who may receive this document. Accordingly, no warranty whatsoever is given and no liability whatsoever is accepted for any loss arising whether directly or indirectly as a result of any person acting based on this information. Opinions expressed in these commentaries are subject to change without notice. Investments are subject to investment risks including the possible loss of the principal amount invested. The value of the units and the income from them may fall as well as rise. Past performance figures as well as any projection or forecast used in these commentaries are not necessarily indicative of future or likely performance. Phillip Securities Pte Ltd (PSPL), its directors, connected persons or employees may from time to time have an interest in the financial instruments mentioned in these commentaries. Investors may wish to seek advice from a financial adviser before investing. In the event that investors choose not to seek advice from a financial adviser, they should consider whether the investment is suitable for them.
The information contained in these commentaries has been obtained from public sources which PSPL has no reason to believe are unreliable and any analysis, forecasts, projections, expectations and opinions (collectively the “Research”) contained in these commentaries are based on such information and are expressions of belief only. PSPL has not verified this information and no representation or warranty, express or implied, is made that such information or Research is accurate, complete or verified or should be relied upon as such. Any such information or Research contained in these commentaries are subject to change, and PSPL shall not have any responsibility to maintain the information or Research made available or to supply any corrections, updates or releases in connection therewith. In no event will PSPL be liable for any special, indirect, incidental or consequential damages which may be incurred from the use of the information or Research made available, even if it has been advised of the possibility of such damages. The companies and their employees mentioned in these commentaries cannot be held liable for any errors, inaccuracies and/or omissions howsoever caused. Any opinion or advice herein is made on a general basis and is subject to change without notice. The information provided in these commentaries may contain optimistic statements regarding future events or future financial performance of countries, markets or companies. You must make your own financial assessment of the relevance, accuracy and adequacy of the information provided in these commentaries.
Views and any strategies described in these commentaries may not be suitable for all investors. Opinions expressed herein may differ from the opinions expressed by other units of PSPL or its connected persons and associates. Any reference to or discussion of investment products or commodities in these commentaries is purely for illustrative purposes only and must not be construed as a recommendation, an offer or solicitation for the subscription, purchase or sale of the investment products or commodities mentioned.
About the author
Jay Lin
Dealer
Jay graduated from the National University of Singapore with a Bachelor’s Degree in Electrical Engineering, specialising in Power Engineering. He is also an aspiring CFA Charter Holder.In his free time, he loves to analyse and experiment with factor based investing and smart beta portfolio’s using machine learning.

 Singapore Equities Hit New Highs in Record Nine-Month Rally
  OUE REIT Posts Strong Performance as Prime CBD Assets Drive Growth
  Tesla Faces Delivery Challenges as EV Tax Credits Are Removed
  Reddit Inc.: Transforming Community Engagement into Revenue Growth


