Singapore Bank Stocks Present Promising Prospects August 29, 2022

As of now, the prices of electricity, fuel, vegetables, hotels and flights to name a few, are rising and just like interest rates.
Factors such as the Russia-Ukraine conflict, constant lockdowns in China, disrupted production chains and a persistent power crunch have all unsettled the delicate balance between supply and demand, causing prices to soar.
Let us look at the cost of money and what influences it.
Central banks are public institutions that are tasked with managing the currency of a country. They control interest rates, which directly affects the price of a currency. Generally, central banks have exclusive powers to issue banknotes and coins, control foreign reserves and provide emergency support to fortify the well-being of a financial system.
Commercial banks on the other hand, are the ones we go to when we want to open an account or apply for a loan. Commercial banks borrow money from the central bank to fund their financial needs. When a commercial bank returns what it has borrowed from the central bank, the commercial bank is required to pay an interest rate.
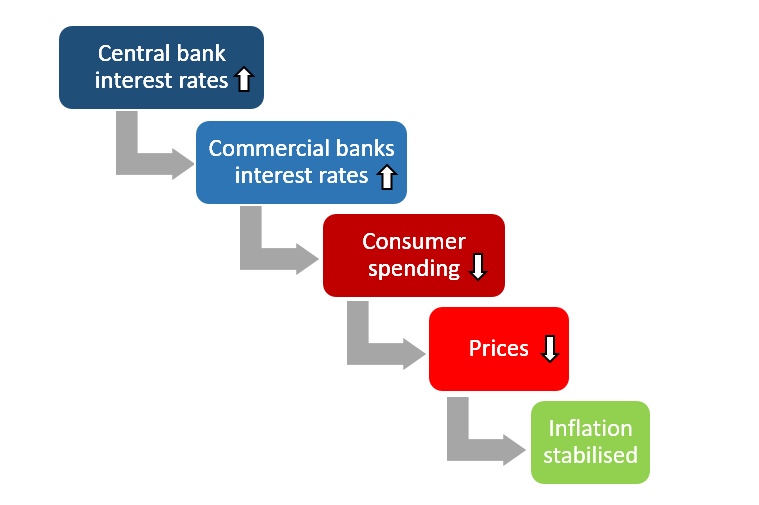
The reason why central banks hike interest rates relates to a strategy to supress spending, which could then supress inflation.
If central banks charge higher rates to commercial banks, commercial banks then increase their interest rates for loans offered to businesses and households, leading to higher costs of personal debt, car loans, mortgages and credit card borrowings. The higher costs deters consumer spending across the economy. Keeping demand for goods and services low will eventually result in the decline of prices. That is the strategy1 behind the interest rate hikes.

Now that we have clarified this concept, let’s look at what this means for our local banks and their investors.
Rising interest rates should allow Singapore’s banks to expand their margins, boosting their earnings as a slowing economy dampers credit growth. As Singapore is one of the APAC markets with the largest pass-through of higher US interest rates into local lending yields, the current Fed interest rate of 2.25% to 2.50% relatively strengthens our local banks’ gains2.
All 3 local banks recorded net interest margin (NIM) improvements across the board, leading to an increase in net interest income (NII) during the 2QFY2022 ended June3.
NIM is a measurement comparing the net interest income a financial firm gains from credit products like mortgages and loans, with outgoing interest it pays holders of savings accounts and certificates of deposits (CDs). NIM is also a profitability indicator that gauges the likelihood of an investment firm or bank thriving in the long run4.
For 2QFY2022, DBS reported NIMs of 1.58%, resulting in a 0.12 percentage point increase Quarter-on-Quarter (QoQ) and 0.13 percentage point increase Year-on-Year (YoY). UOB on the other hand reported NIMs of 1.67%, which equates to a 0.09% percentage point increase QoQ and 0.11% percentage point increase YoY. OCBC saw the biggest gains as it reported NIMs of 1.71%, which amounted to a 0.16 percentage point hike QoQ and 0.13 percentage point increase YoY. If this is anything to go by, it places the banks in a favourable position while the rest of the world struggles with the pressures of rising interest rates5.
While analysts suggest that NIM growth momentum is expected to continue into the second half of the year, loan growth might depress because of macro conditions slowing down, and funding costs will gradually increase.
Phillip Securities Research analyst Glenn Thum said in a recent report that the rise in net interest income from higher rates should more than offset the slower loan growth6.
DBS
In the report, he said that DBS’ 2Q22 earnings saw NII rising by 17% YoY and 12% QoQ on the back of an increase in NIMs and loan growth of 7% YoY stemming from trade and non-trade loans. However, housing and wealth management loans continue to be hampered by weaker market sentiment. Deposits also rose 9% YoY and 1% QoQ, which shows that business momentum is healthy and should be able to counterpoise economic uncertainties from macroeconomic factors7.
OCBC
On OCBC, Thum said that it reported similar positive results as its banking counterparts in Singapore. For 2Q22, OCBC reported NII growing 16% YoY and 13% QoQ, led by loan growth of 8% YoY and NIMs rising by 0.13 percentage points YoY. NIMs rose as asset yields overcame higher funding costs amid the rapidly rising interest rate environment. Separately, he said the management was optimistic about continued economic growth, albeit at a slower pace going by the current economic environment. He added that the management said that the bank sees its NIM guidance reaching 1.70% for FY22e which relates to a 15-20 Basis Points (bps) increase from the previous estimates, and the bank expects to end 2022 with an exit NIM of 1.80%. He said that the management also stated that FY22e NII can increase by 11% resulting in an increase in FY22e profit after taxation and minority interests (PATMI) by 10% if rate hikes reach 100bps this year8.
Don’t forget to check out Phillip Securities Research Analysts reports here:
https://www.stocksbnb.com/reports/dbs-group-holdings-ltd-higher-net-interest-income-support-profits/
https://www.stocksbnb.com/reports/oversea-chinese-banking-corp-ltd-growth-in-nims-lifts-profits/
UOB
In a similar vein, UOB reported solid earnings for 2Q22 as well. UOB reported NII increasing by 11% QoQ and 18% YoY, and NIMs rising by 11bps QoQ with loans growing steadily at 8%. All 3 Singapore banks reported negative results in wealth and fund management fees9.
Winner
When you compare 2Q22 results across the 3 Singapore banks, OCBC emerged as the winner, topping the list on financials; loan growth and NIMs; cost-to-Income ratio, valuation and dividend yield.
For 2Q22, OCBC’s Total Income YoY percentage growth reached 11.9% compared with 5.7% (DBS) and 11.8% (UOB). Net profit YoY percentage growth for OCBC was 27.7%, compared with 6.6% (DBS) and 11.0% (UOB).
The 2Q22 cost-to-Income ratio was 43.5% (OCBC), 43.7% (DBS) and 43.8% (UOB).
In terms of valuation, OCBC has a price-to-book (P/B) ratio of 1.08 compared with 1.58 (DBS) and 1.17 (UOB). Net asset value as of 30 June 2022 was 11.37 (OCBC), 20.78 (DBS) and 23.81 (UOB). And OCBC had a trailing dividend yield of 4.6%, compared with 4.3% for DBS and UOB10.
2 factors that differentiate Singapore Bank Stocks
Loan profiles
In the context of loans, DBS has a portfolio that is heavily weighted toward Singapore and China, whereas UOB maintains the largest loan concentration in Singapore, occupying 51% of their portfolio and the remaining spread across Southeast Asia and China. As for, OCBC, it has a portfolio that registers the lowest concentration in Singapore, with only 43% focused on Singapore and the remainder in China and other Southeast Asian countries.
Global events that might impact Singapore banks
Considering the COVID-19 lockdowns in China, investors have to take into account each bank’s’ exposure to China before evaluating their prospects for end FY22. With reports of slowing growth and economic uncertainties, the banks’ vulnerability to China could result in a downturn11.
Conclusion
All 3 banks have recorded strong earnings for 2Q22 and are expected benefit from rapidly rising interest rates. Chicago Fed President Charles Evans recently signalled that due to consumer prices remaining unchanged in July, inflation is “unacceptably” high and stated that the Fed would likely need to lift its policy rate to 3.25%-3.5% this year and to 3.75%-4% by the end of 202312.
If this happens, banks stocks stand to benefit.
Reference:
- [1] https://www.euronews.com/my-europe/2022/08/08/why-do-central-banks-raise-interest-rates-to-curb-inflation
- [2] https://www.businesstimes.com.sg/banking-finance/rising-us-rates-to-boost-singapore-bank-earnings-towards-pre-covid-levels
- [3] https://www.theedgesingapore.com/capital/brokers-calls/analysts-remain-overweight-singapore-banking-sector-due-nim-improvement
- [4] https://www.investopedia.com/terms/n/netinterestmargin.asp
- [5] https://thesmartinvestor.com.sg/dbs-uob-or-ocbc-which-of-the-3-banks-is-the-most-attractive/
- [6] https://www.spglobal.com/marketintelligence/en/news-insights/blog/japan-ma-q1-22
- [7] https://www.stocksbnb.com/reports/dbs-group-holdings-ltd-higher-net-interest-income-support-profits/
- [8] https://www.stocksbnb.com/reports/oversea-chinese-banking-corp-ltd-growth-in-nims-lifts-profits/
- [9] https://www.uobgroup.com/investor-relations/assets/pdfs/investor/financial/2022/newsrelease-2q-2022-results.pdf
- [10] https://thesmartinvestor.com.sg/dbs-uob-or-ocbc-which-of-the-3-banks-is-the-most-attractive/
- [11] https://www.drwealth.com/singapore-bank-stocks-to-buy/
- [12] https://www.reuters.com/markets/us/feds-evans-sees-rates-rising-325-35-by-year-end-2022-08-10/
Disclaimer
These commentaries are intended for general circulation. It does not have regard to the specific investment objectives, financial situation and particular needs of any person who may receive this document. Accordingly, no warranty whatsoever is given and no liability whatsoever is accepted for any loss arising whether directly or indirectly as a result of any person acting based on this information. Opinions expressed in these commentaries are subject to change without notice. Investments are subject to investment risks including the possible loss of the principal amount invested. The value of the units and the income from them may fall as well as rise. Past performance figures as well as any projection or forecast used in these commentaries are not necessarily indicative of future or likely performance. Phillip Securities Pte Ltd (PSPL), its directors, connected persons or employees may from time to time have an interest in the financial instruments mentioned in these commentaries. Investors may wish to seek advice from a financial adviser before investing. In the event that investors choose not to seek advice from a financial adviser, they should consider whether the investment is suitable for them.
The information contained in these commentaries has been obtained from public sources which PSPL has no reason to believe are unreliable and any analysis, forecasts, projections, expectations and opinions (collectively the “Research”) contained in these commentaries are based on such information and are expressions of belief only. PSPL has not verified this information and no representation or warranty, express or implied, is made that such information or Research is accurate, complete or verified or should be relied upon as such. Any such information or Research contained in these commentaries are subject to change, and PSPL shall not have any responsibility to maintain the information or Research made available or to supply any corrections, updates or releases in connection therewith. In no event will PSPL be liable for any special, indirect, incidental or consequential damages which may be incurred from the use of the information or Research made available, even if it has been advised of the possibility of such damages. The companies and their employees mentioned in these commentaries cannot be held liable for any errors, inaccuracies and/or omissions howsoever caused. Any opinion or advice herein is made on a general basis and is subject to change without notice. The information provided in these commentaries may contain optimistic statements regarding future events or future financial performance of countries, markets or companies. You must make your own financial assessment of the relevance, accuracy and adequacy of the information provided in these commentaries.
Views and any strategies described in these commentaries may not be suitable for all investors. Opinions expressed herein may differ from the opinions expressed by other units of PSPL or its connected persons and associates. Any reference to or discussion of investment products or commodities in these commentaries is purely for illustrative purposes only and must not be construed as a recommendation, an offer or solicitation for the subscription, purchase or sale of the investment products or commodities mentioned.
About the author
Shamir Thair
Shamir Thair is a Content and Community Executive with POEMS Marketing.

 Back in Business: The Return of IPOs & Top Traded Counters in March 2024
  From $50 to $100: Unveiling the Impact of Inflation
  How to soar higher with Positive Carry!
  Why 2024 Offers A Small Window of Opportunity and How to Position Yourself to Capture It


