Top traded counters in March 2023 April 24, 2023
Start trading on POEMS! Open a free account here!
Events to note – At a glance:
- Fall of Silicon Valley Bank and Signature Bank
- 11 major US banks deposited US$30 billion in First Republic Bank
- March’s FOMC announced a 25 bps interest rate hike
- UBS acquired Credit Suisse for more than 3 billion Swiss francs
- Sea Limited turns profitable for the first time ever
The three US major indices – Dow Jones, S&P 500 and NASDAQ shook off the banking contagion fear and managed to inch up positive in March.
| NASDAQ | DOW JONES | S&P 500 | |
| Month Open | 11,447.58 | 32,656.37 | 3,963.34 | Month Close | 12,221.91 | 33,274.16 | 4,109.32 | Monthly return | 6.76% | 1.89% | 3.68% |
Fed chairman, Jerome Powell, caught the market by surprise at the beginning of March with his hawkish outlook1. “If the totality of the data were to indicate that faster tightening is warranted, we would be prepared to increase the pace of rate hikes” Powell shared. His comments implied two things: one, the terminal federal funds rate’s peak or terminal level would likely be higher than what Fed officials had previously predicted, two, the change from a larger to smaller increase in January may not persist in March’s FOMC if inflation figures remained strong.
Shortly after, the rising interest rate environment claimed its first victim: Silicon Valley Bank2(SVB). The main cause of its fall was due to the losses from the banks’ investment in long-dated bonds3 that made depositors question the financial health of SVB. This doubt ultimately led to a bank run. Regulators had to take over the bank and put it under receivership. The collapse of SVB was the largest bank failure since the 2008 Financial Crisis, where even President Joe Biden stepped in to reassure depositors that their money was safely insured by the Deposit Insurance Fund4.
The contagion fear from SVB triggered the fall of Signature Bank, which marked the third largest bank failure just 2 days after the collapse of SVB5. After the fall of SVB, contagion fear caused depositors to focus on banks that had a similar background of large proportions of unsecured deposits.
With 70% of its deposits unsecured, First Republic Bank (FRC.US) was ranked the third highest in terms of unsecured deposits amongst the medium-sized banks, behind SVB6. FRC.US closed at US$115 on 8 March 2023 and on 16 March 2023 the share traded below US$20. To prevent FRC.US from collapsing, 11 banks deposited a total of US$ 30 billion in FRC.US; including Bank of America (BAC.US), JPMorgan Chase (JPM.US) and Goldman Sachs (GS.US) etc7. These deposits have to be held within the bank for 120 days, showing the confidence America’s largest banks have for the FRC.US.
Europe’s banking nation- Switzerland had its fair share of banking issues. One of the Switzerland-headquartered banks, Credit Suisse (CS) was in a dire state while UBS was pressured by the regulators to acquire CS. Swiss authorities were concerned about whether CS’s failure could become a new point of global stress due to its strong global presence. Ultimately, UBS acquired CS for more than 3 billion Swiss francs8. More than 9 billion Swiss francs were given to UBS by the Swiss government to cover any deal-related losses, while more than 100 billion Swiss francs in liquidity was given to UBS by the Swiss National Bank to aid in the acquisition.
The FOMC held in March was a difficult one owing to the trouble in the banking sector. The Fed had to choose between raising rates to combat inflation or taking a time-out because of the banking crisis. Ultimately, they decided on a 25-basis point hike9. The Fed expressed concern about the banking crisis and indicated that the hikes were nearing an end but said that the fight against inflation was not yet over. Powell further added that tightening of credit conditions might be possible due to the recent banking events. However it might be good to also bear in mind that the banking events may have caused the Fed to soften its tone; Powell believes that “the US banking system is sound and resilient”.
Here are some ETFs to consider:
iShares U.S. Financials ETF (NYSE-ARCA: IYF.US)
IYF is an ETF that seeks to track the investment results of an index composed of US Equities in the financial sector10. The index consists primarily of companies in diversified financials; banks and insurance. IYF commenced on 22 May 2000 with an expense ratio of 0.39%. IYF’s 10-year performance as of 31 December 2022 is 11.36%.
IYF opened at US$78.67 and dropped 9.57% to close at US$71.14 in March.
Technical analysis
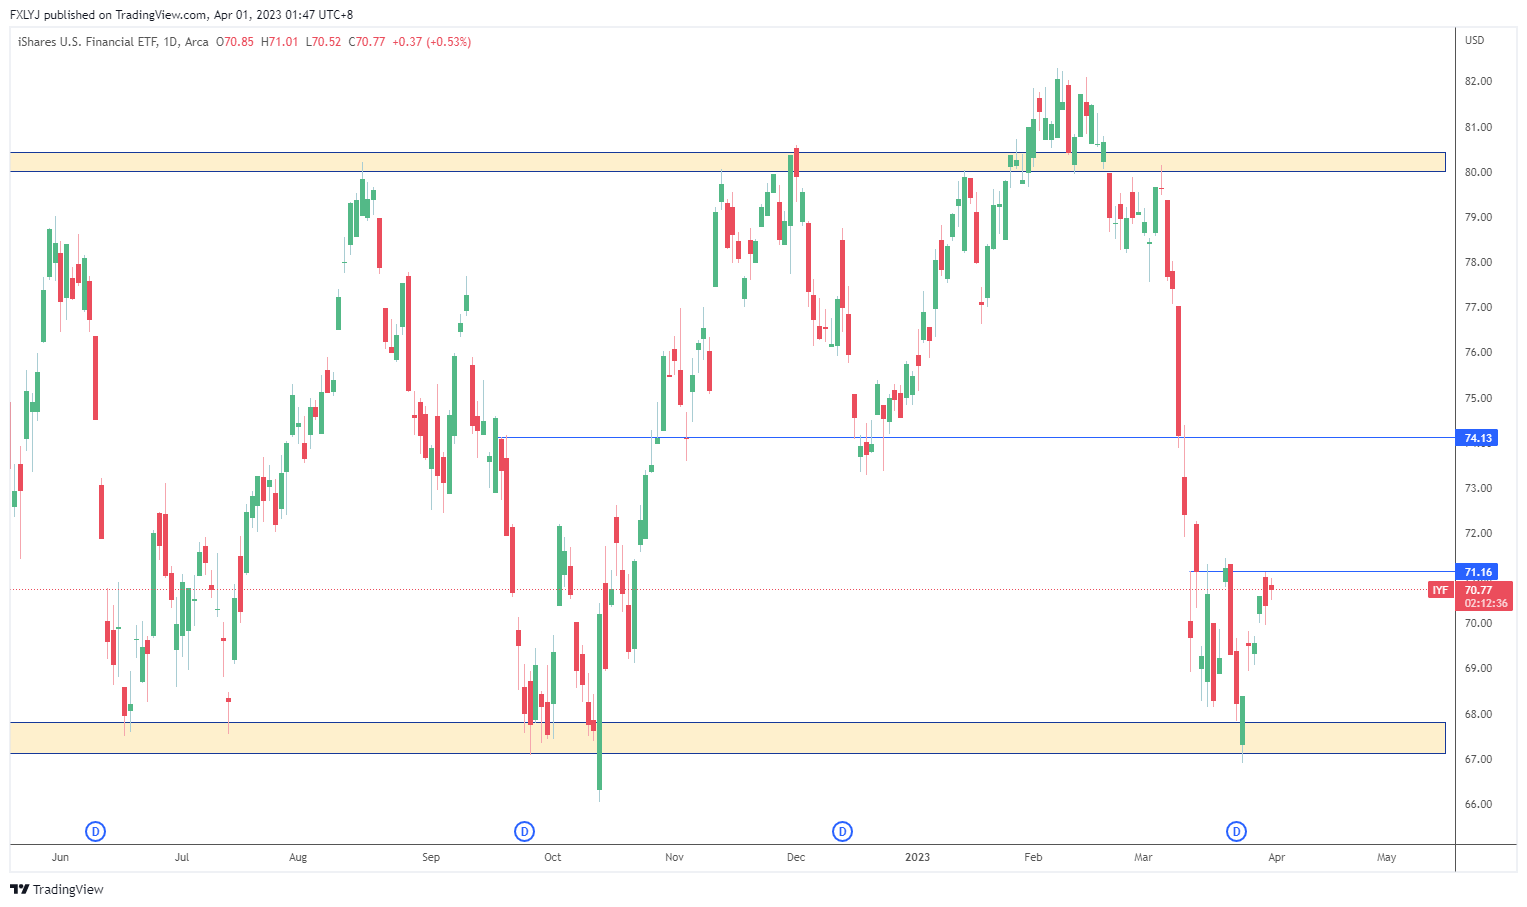
Status: Neutral
Support: 67.00 – 68.00
Resistance: 74.15
Range-bound
SPDR S&P Bank ETF (NYSE-ARCA: KBE.US)
KBE is an ETF that seeks to provide investment results that correspond generally to the total return performance of the S&P® Banks Select Industry Index11. The index consists primarily of companies from the regional banks, thrifts & mortgage finance, diversified banks, other diversified financial services and asset management & custody banks. KBE commenced on 8 November 2005 with an expense ratio of 0.35%. KBE’s 10-year performance as of 31 December 2022 is 8.83%.
KBE opened at US$48.01 and dropped 22.79% to close at US$37.07 in March.
Technical analysis
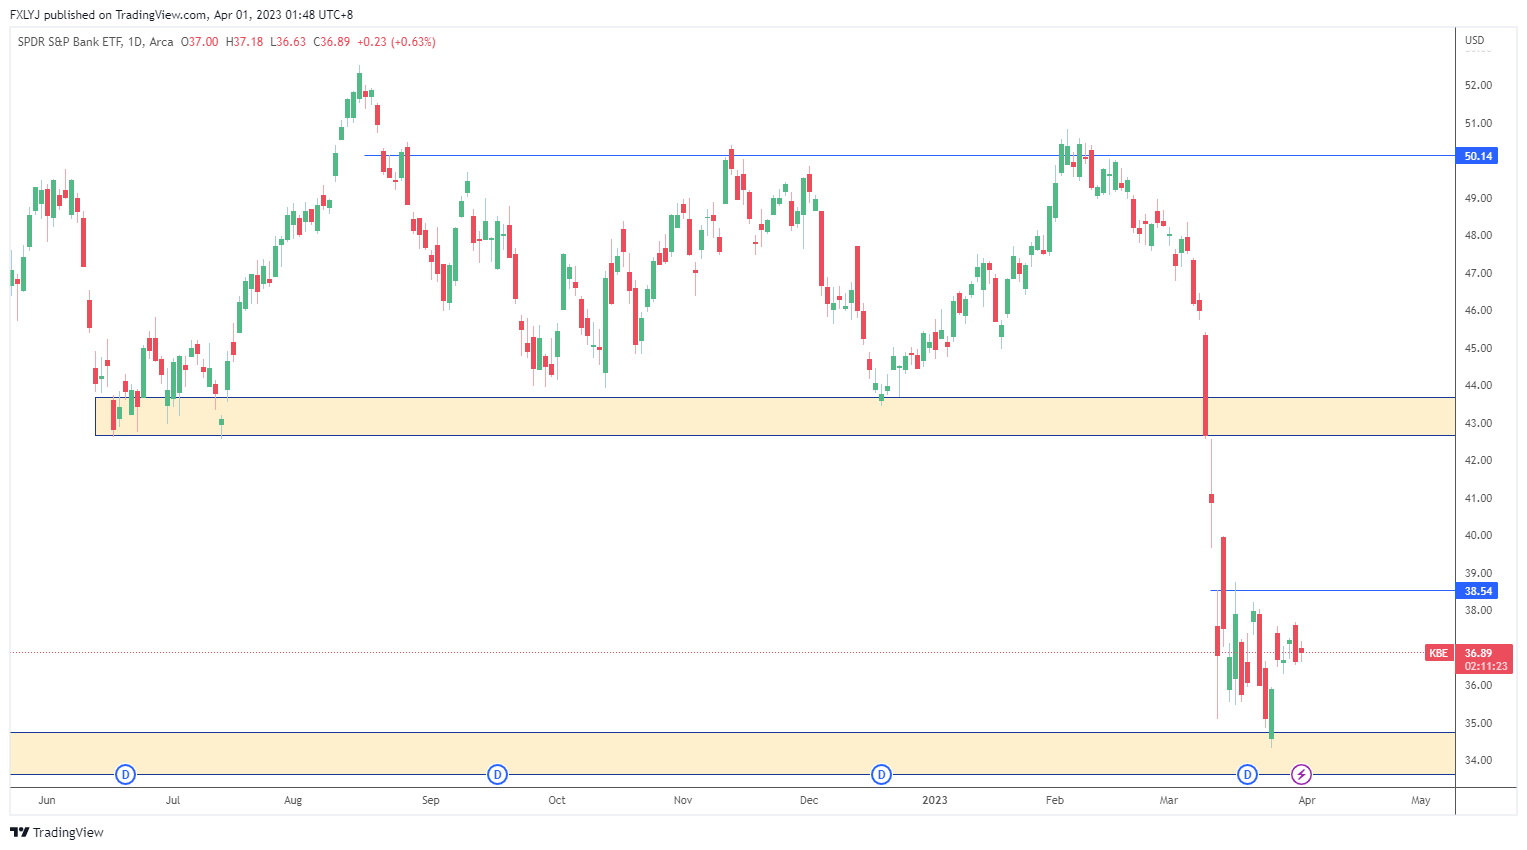
Status: Neutral
Support: 33.85 – 34.80
Resistance: 43.00
Bearishness slowing down, range-bound at the moment
Here are some of the more popular US stocks – not ranked in any order – traded by our POEMS customers in February 2023.
Nio Inc (NYSE: NIO)
NIO reported earnings that missed estimates despite an increase in total vehicle delivery and revenue for 2022 Q4 as compared to 2021 Q4. EPS and revenue of -RMB3.07(- US$0.44) and RMB16.06 billion (US$2.33 billion) both missed estimates of -RMB1.8 (-US$0.16) and RMB 17.47 billion (US$ 2.53 billion).12
The reason for the disappointing earnings despite a 60% increase in vehicle deliveries and 62.2% increase in total revenue from the same quarter a year ago, was largely due to an increase in cost of sales and operating expenses of 88.3% and 117.7% respectively, from the same quarter a year ago.
For the next quarter, the company expects deliveries of vehicles to be between 31,000 and 33,000 vehicles, representing an increase of approximately 20.3% to 28.1% from the same quarter in 2022 and total revenues to be between RMB10.93 billion (US$1.58 billion) and RMB11.54 billion (US$1.67 billion), representing an increase of approximately 10.2% to 16.5% from the same quarter in 202213.
In March, NIO opened at US$9.34 and gained 12.53% to close at US$10.51.
Technical analysis
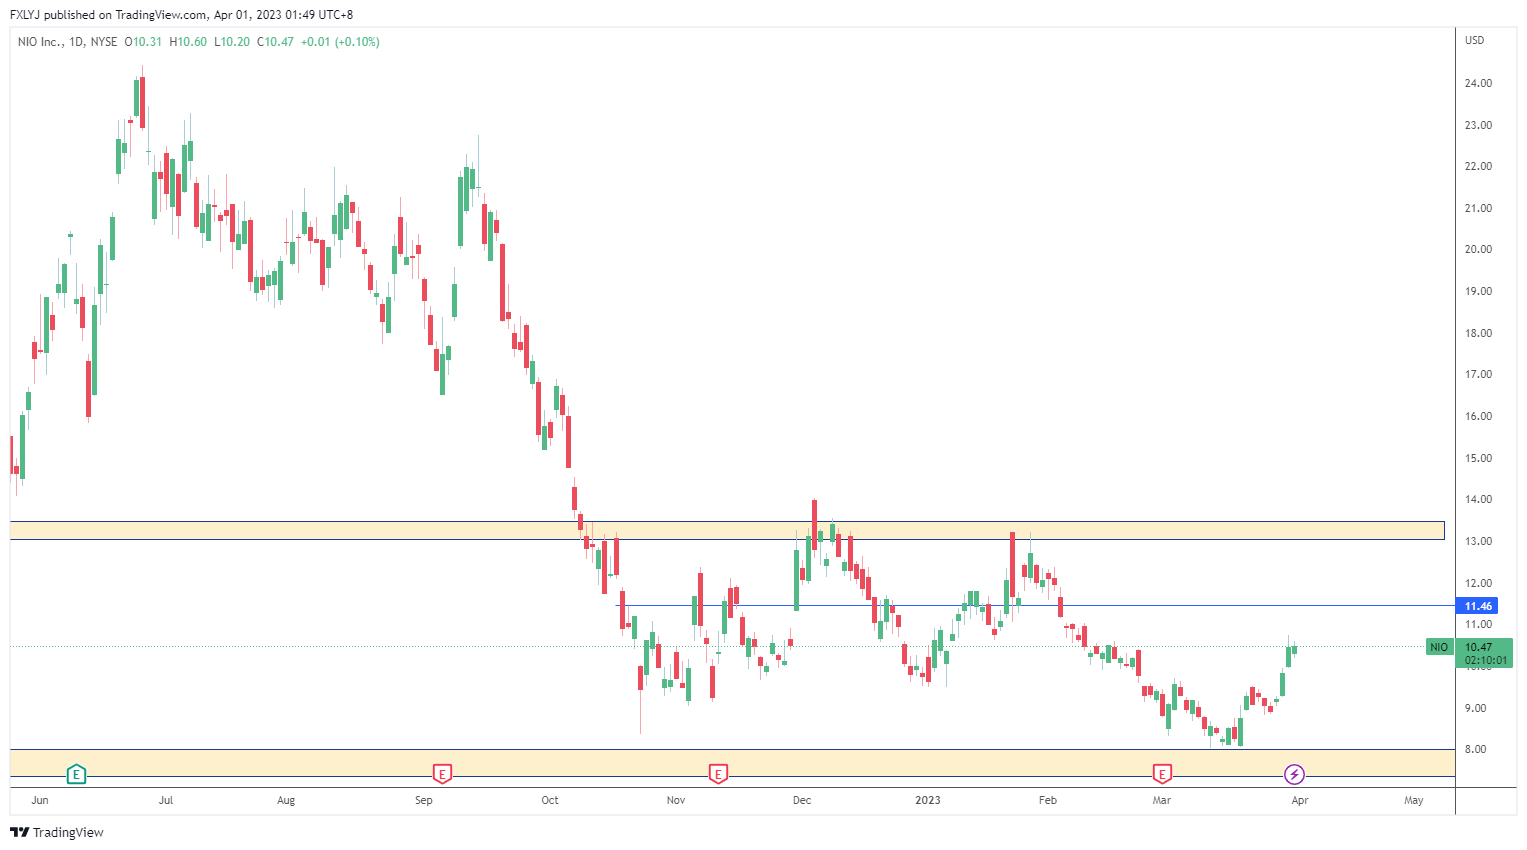
Status: Neutral
Support: 8.00
Resistance: 11.50
Range-bound
Crowdstrike Holdings Inc (NASDAQ: CRWD)
CRWD reported earnings that beat estimates in March 2023. EPS of US$0.47 exceeded estimates of US$0.43. Revenue was reported at US$637 million, higher than estimates of US$625 million14.
The reported revenue represents a 48% increase, compared to US$431 million from the same quarter a year ago. Annual Recurring Revenue (ARR) increased 48% year-over-year and grew to US$2.56 billion as of 31 January 2023, of which US$221.7 million was net new ARR added in the quarter.
For the upcoming quarter guidance, the firm expects total revenue to be US$674.9 million – US$678.2 million and Non-GAAP net income per share to be US$0.50 – US$ 0.5115.
In March, CRWD opened at US$120.23 and gained 14.16% to close at US$137.26.
Technical analysis
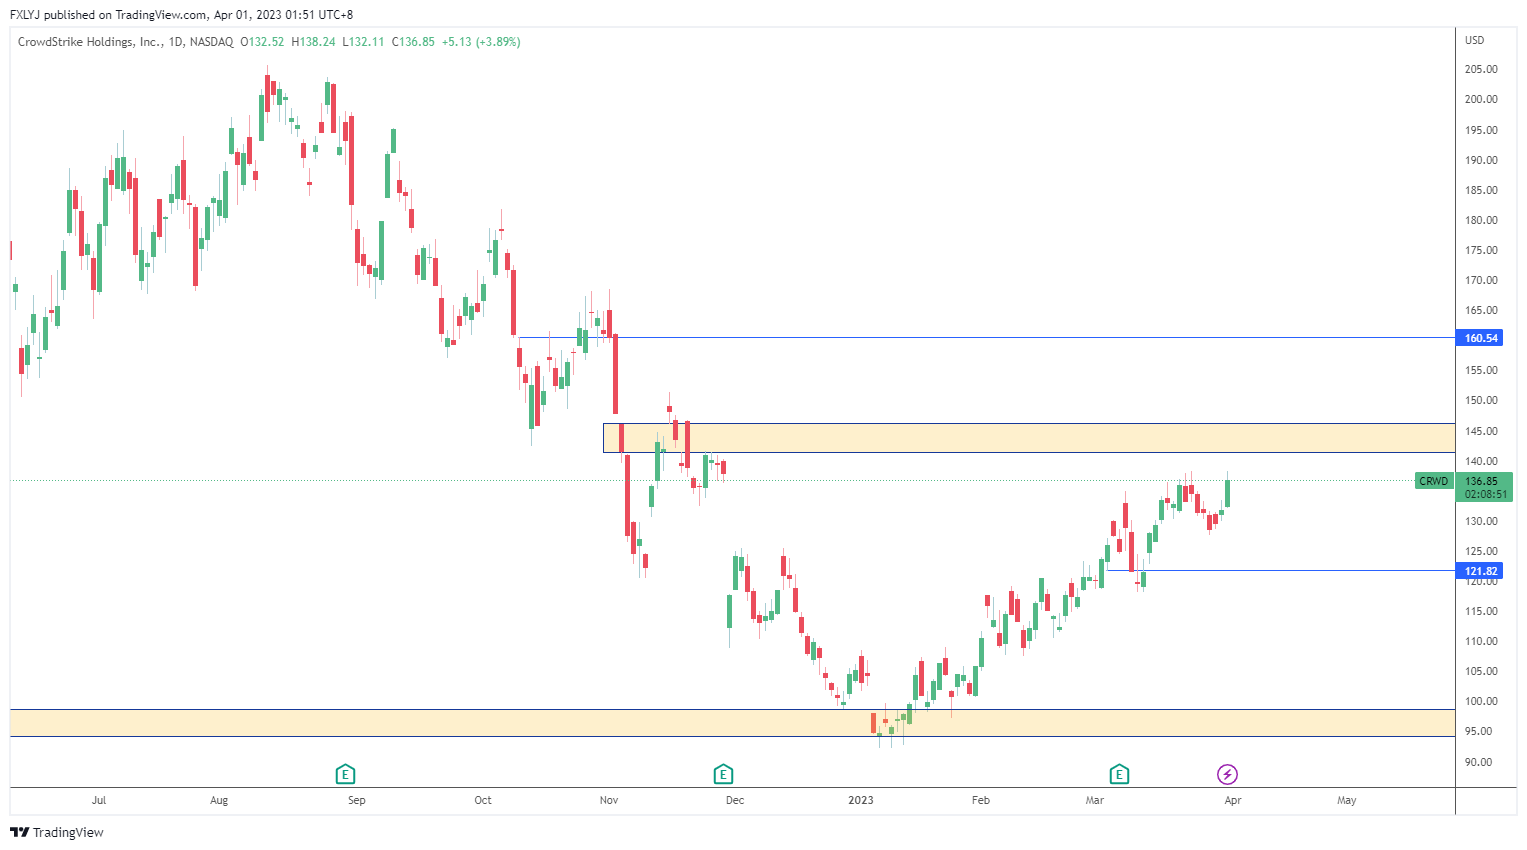
Status: Neutral
Support: 100.00
Resistance: 147.00
Price should continue ranging in the current levels.
TDCX Inc (NYSE:TDCX)
In March 2023, TDCX reported a 19.6% revenue growth for the full year 2022. The full year total revenue was reported at US$493.9 million compared to US$412.9 million. Their Q4 results: EPS was reported at US$0.13, while revenue was reported at US$131.4 million, representing a 14.2% growth from the same quarter a year ago at US$115.1 million.
For the full year of 2023, the firm expects revenue growth of 3-8% year-over-year and adjusted EBITDA margin to be approximately 25-29%.16 TDXC opened at US$12.61 and dropped 29.42% to close at US$8.90 in March 2023.
Referring to this Phillip Research report dated 13 March 2023, the recommendation for TDCX:Accumulate.
Technical analysis
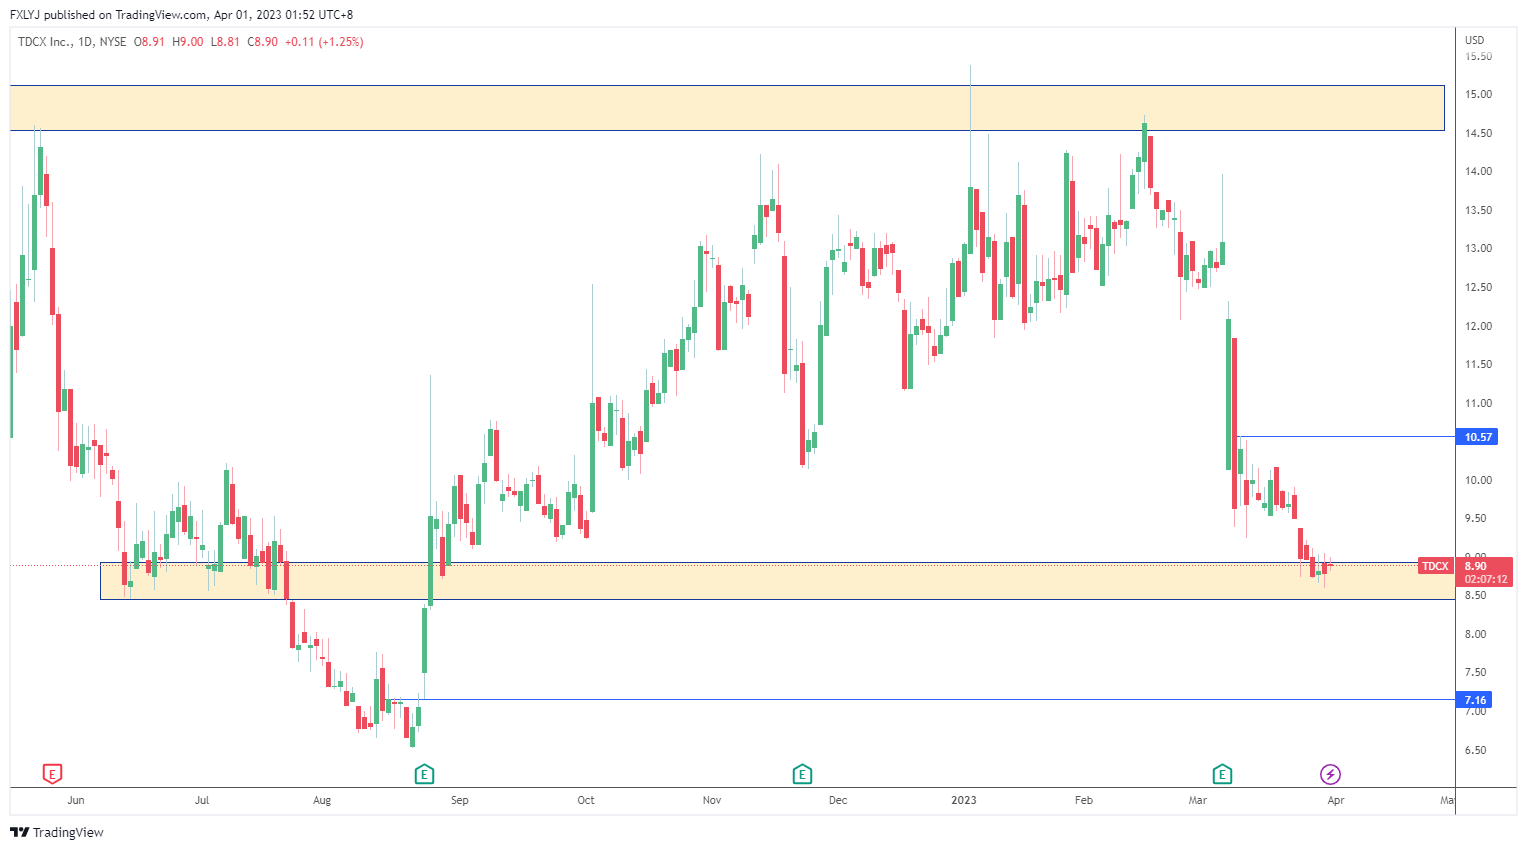
Status: Neutral
Support: 8.50
Resistance: 10.57
Range-bound
SEA Limited (NYSE: SE)
SE turned profitable for the first time ever and beat estimates by a far mile for the quarter. EPS of US$0.72 and revenue of US$3.45 billion, beats estimates of -US$0.64 and US$3.06 billion respectively.17 The positive results were partly due to a US$746 million reduction in sales and marketing expenses as well as a US$157 million decrease in cost to obtain revenue in the quarter.18
The firm expects their market outlook in the long run to remain strong due to its demographic features, with a young growing population deepening digital penetration vis-a-vis offline retail and also economic growth potential in their region. At the same time, efforts to reduce the cost structure of their ecosystem and strengthen their ability to serve users with better user experience will allow them to capture a larger share of the pie in the long run.19 In March 2023, SE opened at US$64.01 and gained 35.21% to close at US$86.55.
Referring to this Phillip Research report dated 9 March 2023, the recommendation for SE is a Buy.
Technical analysis
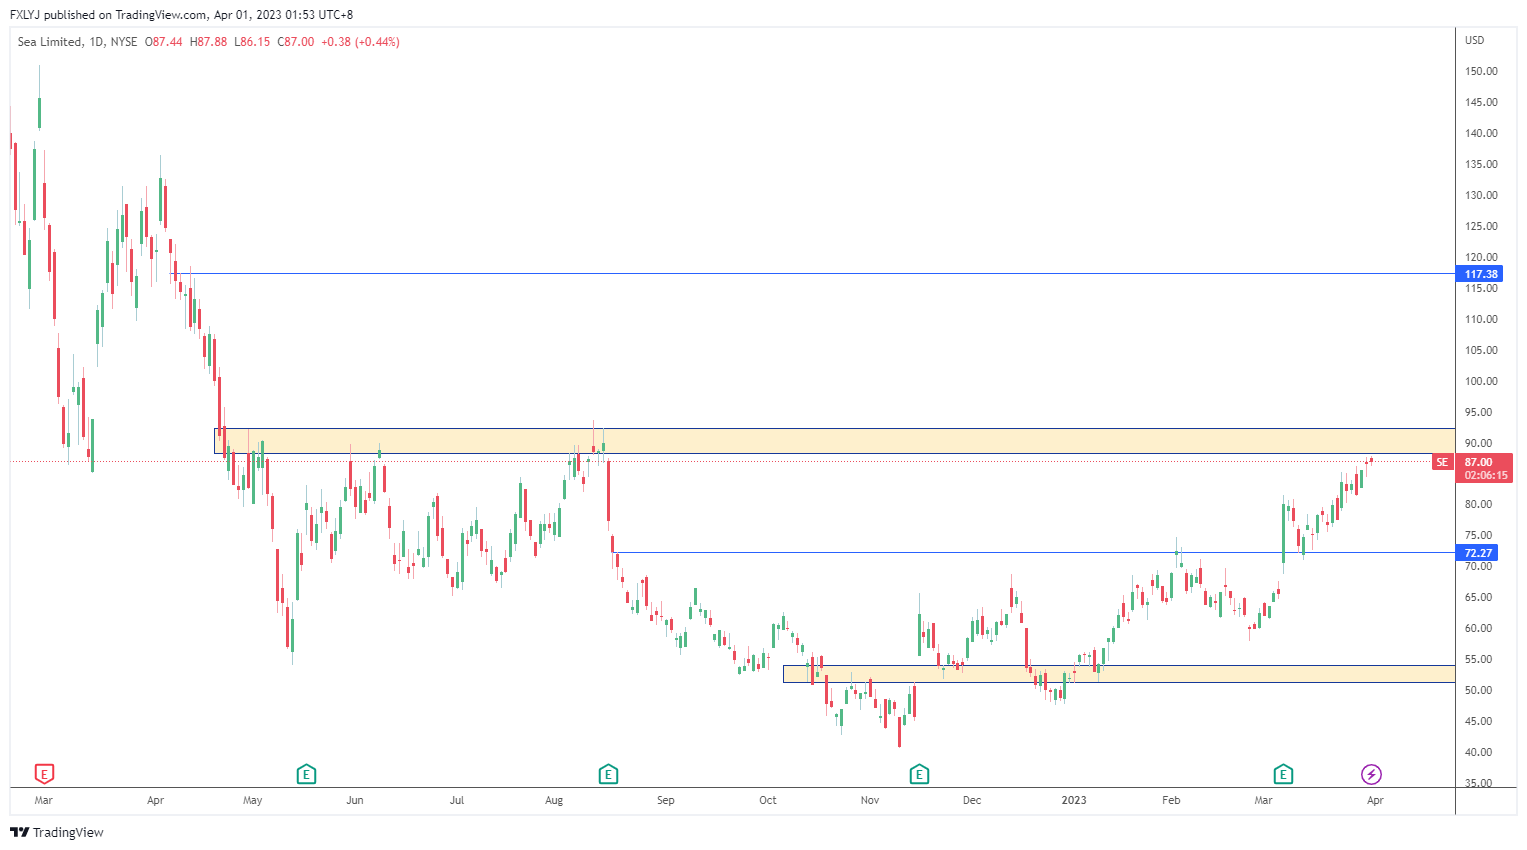
Status: Neutral
Support: 72.30
Resistance: 94.00
Range-bound
Salesforce Inc (NYSE: CRM)
CRM shares soared 16% in extended trading after reported earnings that beat estimates in March. EPS of US$1.68 beat estimates of US$1.36, revenue of US$8.38 billion were higher than estimates of US$7.99 billion.
For the fiscal first quarter, the company called for adjusted earnings in the range of US$1.60 to US$1.61 per share and revenue of US$8.16 billion to US$8.18 billion, higher than the estimates of US$1.32 and US$8.05 billion respectively. For the full 2024 fiscal year, the company called for adjusted earnings of US$7.12 to US$7.14 and revenue of US$34.5 billion to US$34.7 billion, higher than the estimates of US$5.84 and US$34.03 billion respectively.
The company will also be expanding its share buyback program to US$20 billion after announcing its first repurchasing commitment last year.20 In March 2023, CRM opened at US$197.49 and gained 1.16% to close at US$199.78.
Referring to this Phillip Research report dated 7 March 2023, the recommendation for CRM: Buy.
Technical analysis
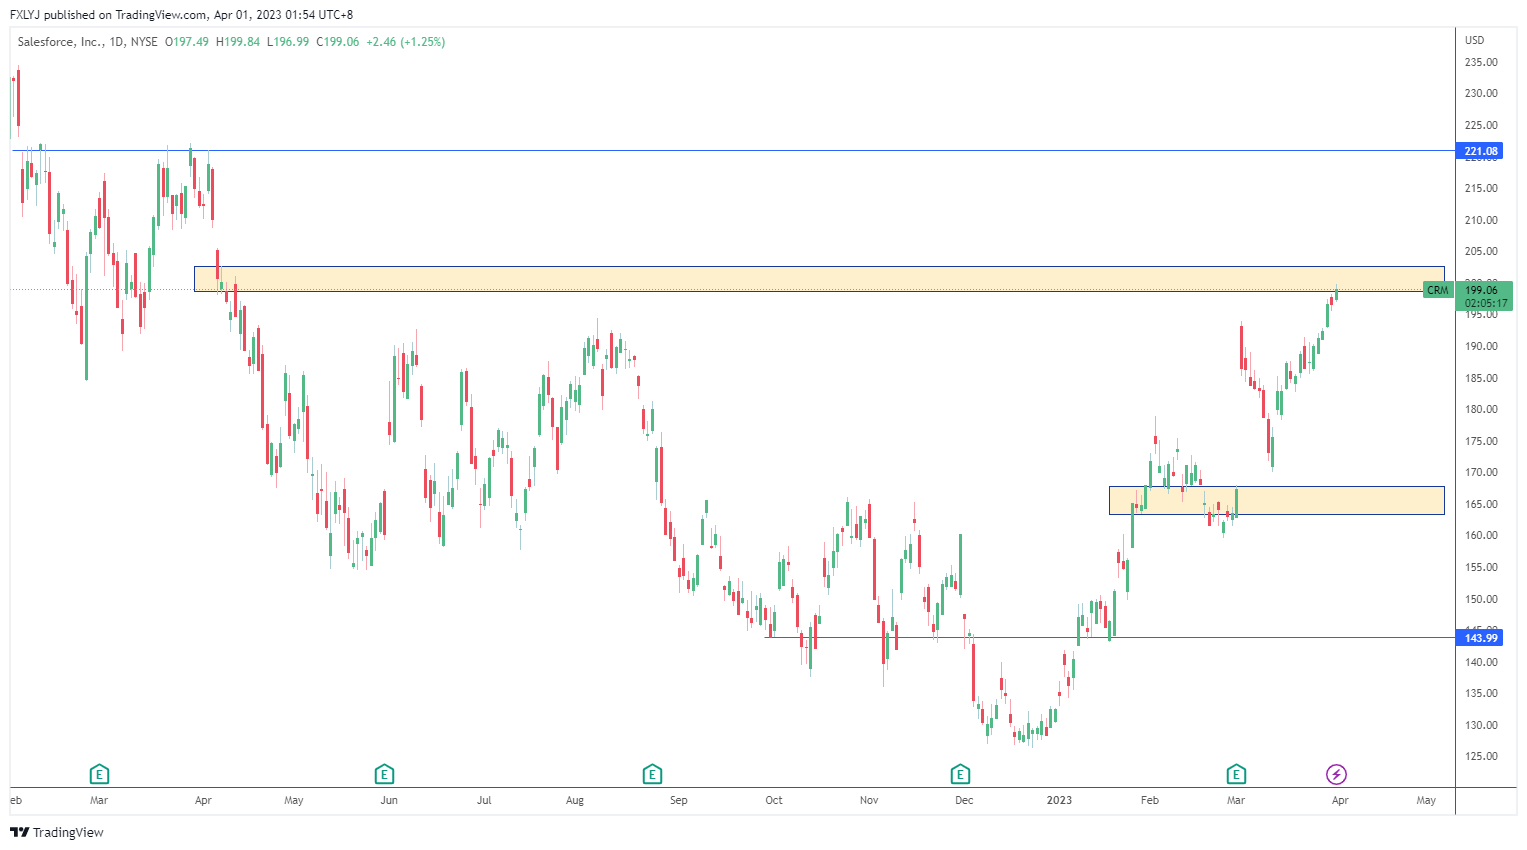
Status: Neutral
Support: 165.00
Resistance: 221.10
Range-bound and price has to stay above 205.00 for more bullishness
CONCLUSION
Towards the end of the month, banking fears seem to have subsided generally even with the potential lacklustre performance of smaller banks. Deposits are flowing out of regional banks and into bigger banks. This will have long lasting repercussions for the regional banks. Banks generally make use of deposits for loan outs. With lower levels of deposits, lending levels will likely fall respectively. With a lower lending capacity, the profitability of banks will take a hit and businesses that require loans will face greater scrutiny as banks will not be as liberal in their lending standards as they were before.
Bloomberg analysts’ recommendations
The table below shows the consensus ratings and average ratings of all analysts updated on Bloomberg in the last 12 months. Consensus ratings have been computed by standardising analysts’ ratings from a scale of 1 (Strong Sell) to 5 (Strong Buy). The table also shows a number of analysts’ recommendations to buy, hold or sell the stocks, as well as their average target prices.
| Security | Consensus Rating | BUY | HOLD | SELL | 12 Mth Target Price (US$) |
| Crowdstrike Holdings Inc (NASDAQ: CRWD) | 4.77 | 43 (89.6%) | 5 (10.4%) | 0 | 167.68 |
| Salesforce Inc (NYSE: CRM) | 4.52 | 44 (78.6%) | 11 (19.6%) | 1 (1.8%) | 225.61 |
| SEA Limited (NYSE: SE) | 4.41 | 29 (74.4%) | 9 (23.1%) | 1 (2.6%) | 95.84 |
| Nio Inc (NYSE: NIO) | 4.40 | 26 (74.3%) | 8 (22.9%) | 1 (2.9%) | 14.69 |
| TDCX Inc (NYSE:TDCX) | 3.83 | 3 (50%) | 3 (50%) | 0 | 3.83 |
As of: 31 April 2023
Get yourself educated! Join our free webinar here!

With our newly launched POEMS Mobile 3 Trading App
Explore a myriad of useful features including TradingView chartings to conduct technical analysis with over 100 technical indicators available!
Take this opportunity to expand your trading portfolio with our wide range of products including Stocks, CFDs, ETFs, Unit Trusts and more across 15 global exchanges available for you anytime and anywhere to elevate you as a better trader using our POEMS Mobile 3 App!
Reference:
- [1] “Fed may need more aggressive interest rate hikes, Powell says.” 7 Mar. 2023
- [2] “The rise and fall of Silicon Valley Bank: Timeline of tech lender’s ….” 14 Mar. 2023,
- [3] Goldman Sachs bought the SVB bonds whose $1.8 billion loss set off the startup lender’s meltdown” 5 April 2023
- [4] “‘That’s how capitalism works,’ Biden says of SVB, Signature Bank ….” 13 Mar. 2023
- [5] “Why regulators seized Signature Bank in third-biggest bank failure in U.S. history” 5 Apr. 2023
- [6] “First Republic shares dive on contagion fear, dragging U.S. regional ….” 14 Mar. 2023
- [7] “Wall Street rides to the rescue as 11 banks pledge First Republic ….” 17 Mar. 2023
- [8] “UBS Agrees to Buy Credit Suisse for More Than $3 Billion – WSJ.” 19 Mar. 2023
- [9] “Fed rate hike decision March 2023: – CNBC.” 23 Mar. 2023
- [10] “iyf-ishares-u-s-financials-etf-fund-fact-sheet-en-us.pdf.”
- [11] “Fact Sheet:SPDR® S&P® Bank ETF, Dec2022 – SSGA.” 8 Nov. 2005
- [12] “Nio A ADR (NIO) Earnings Dates & Reports – Investing.com.”
- [13] “NIO Inc. Reports Unaudited Fourth Quarter and Full Year 2022 ….” 1 Mar. 2023
- [14] “Stocks moving big after hours: CRWD, SFIX, CRCT – CNBC.” 7 Mar. 2023
- [15] “CrowdStrike Reports Fourth Quarter and Fiscal Year 2023 Financial ….”
- [16] “TDCX Reports 19.6% Revenue Growth for Full Year 2022.” 7 Mar. 2023
- [17] “Sea (SE) Earnings Dates & Reports – Investing.com.”
- [18] “Singapore’s Sea Group turns profitable for the first time – CNBC.” 8 Mar. 2023
- [19] “Sea Limited (SE) Q4 2022 Earnings Call Transcript – The Motley Fool.” 7 Mar. 2023
- [20] “Salesforce shares jump 16% on better-than-expected forecast – CNBC.” 1 Mar. 2023
Disclaimer
These commentaries are intended for general circulation. It does not have regard to the specific investment objectives, financial situation and particular needs of any person who may receive this document. Accordingly, no warranty whatsoever is given and no liability whatsoever is accepted for any loss arising whether directly or indirectly as a result of any person acting based on this information. Opinions expressed in these commentaries are subject to change without notice. Investments are subject to investment risks including the possible loss of the principal amount invested. The value of the units and the income from them may fall as well as rise. Past performance figures as well as any projection or forecast used in these commentaries are not necessarily indicative of future or likely performance. Phillip Securities Pte Ltd (PSPL), its directors, connected persons or employees may from time to time have an interest in the financial instruments mentioned in these commentaries. Investors may wish to seek advice from a financial adviser before investing. In the event that investors choose not to seek advice from a financial adviser, they should consider whether the investment is suitable for them.
The information contained in these commentaries has been obtained from public sources which PSPL has no reason to believe are unreliable and any analysis, forecasts, projections, expectations and opinions (collectively the “Research”) contained in these commentaries are based on such information and are expressions of belief only. PSPL has not verified this information and no representation or warranty, express or implied, is made that such information or Research is accurate, complete or verified or should be relied upon as such. Any such information or Research contained in these commentaries are subject to change, and PSPL shall not have any responsibility to maintain the information or Research made available or to supply any corrections, updates or releases in connection therewith. In no event will PSPL be liable for any special, indirect, incidental or consequential damages which may be incurred from the use of the information or Research made available, even if it has been advised of the possibility of such damages. The companies and their employees mentioned in these commentaries cannot be held liable for any errors, inaccuracies and/or omissions howsoever caused. Any opinion or advice herein is made on a general basis and is subject to change without notice. The information provided in these commentaries may contain optimistic statements regarding future events or future financial performance of countries, markets or companies. You must make your own financial assessment of the relevance, accuracy and adequacy of the information provided in these commentaries.
Views and any strategies described in these commentaries may not be suitable for all investors. Opinions expressed herein may differ from the opinions expressed by other units of PSPL or its connected persons and associates. Any reference to or discussion of investment products or commodities in these commentaries is purely for illustrative purposes only and must not be construed as a recommendation, an offer or solicitation for the subscription, purchase or sale of the investment products or commodities mentioned.
About the author
Global Markets Desk US Dealing Team
The Global Markets Desk US Dealing team specialise in handling the US Markets in the Global Markets Desk.
Their responsibilities and capabilities extend from managing and taking orders from clients trading in the US market, to content generation, Technical Analysis and providing educational content to POEMS clients.

 Back in Business: The Return of IPOs & Top Traded Counters in March 2024
  From $50 to $100: Unveiling the Impact of Inflation
  How to soar higher with Positive Carry!
  Why 2024 Offers A Small Window of Opportunity and How to Position Yourself to Capture It


