

DAILY MORNING NOTE | 2 March 2026
Recent Podcasts:
Advanced Micro Devices Inc. – Clear Instinct GPU roadmap, strong CPU demand
Netflix Inc. – Content, ads, and scale drive the next leg of growth
The Walt Disney Company – Streaming Turns Profitable
Trade of The Day
ETF Monthly: February 2026 – US Treasury Bonds, Gold and Oil to extend gains in March
Analyst: Zane Aw
- Review of asset classes performance in February – Performance across the ETFs was mixed. The top gainers were the ETFs tracking Oil (XOP) and Gold (GLDM), which were up 9.6% and 8.4% respectively. On the other hand, the top loser was the ETF tracking Bitcoin (BITO), which tumbled 21.8%.
- For their current trends, US Treasury Bonds, Gold, Oil and Singapore Equities are in an uptrend. Meanwhile, the S&P 500 and Hang Seng Index are in a range consolidation. On the other hand, Bitcoin is in a downtrend.
- Heading into March, we expect gains for the ETFs tracking the US Treasury Bonds, Oil, and Gold. On the other hand, ETFs tracking the S&P 500 and Hang Seng Index are likely to pull back. Meanwhile, the ETFs tracking Bitcoin and Singapore Equities are likely to remain rangebound.
Trades Initiated in Past Week

Week 10 equity strategy – The strikes on Iran could roil energy markets. Movement of oil and chemicals in the Straits of Hormuz will be at risk. The Straits carry 33% of global fertilisers, 32% methanol, 30% crude oil, 20% LNG and NGLs. At risk are also major oil facilities in Saudi Arabia (Abqaiq and Al Jubail processing, Ras Tanura port), the UAE’s Fujairah bunkering hub, and Qatar’s Ras Laffan LNG Port. Kharg Island, which handles 80-90% of Iran’s oil exports, has so far not been attacked. Our base case is that the Straits will not be blocked or will not be for long period of time. It will only negatively impact Iran’s major customer, China. Israel and the US are less reliant on the Straits for their energy needs. Attacks on Iran could continue to further dismantle its armed capabilities. However, any major destruction of Kharg Island could precipitate a more aggressive retaliation from Iran to target oil facilities around the region. We do not expect the US to commit ground forces and worsening of the situation.
In terms of our strategy, any sell-off we view as a Buying opportunity. The transmission of the conflict to hurting global economies is higher oil prices. With mid-term elections, the US administration will be especially sensitive to rising oil prices and the fuelling the affordability issue in the US. Heightened conflicts will result in the rise of defence spending. ST Engineering is looking to double its international sales this year, with the Middle East as its major market. It is penetrating new markets with a multi-decade track record, quality production through automation, localisation abilities, and neutrality. Competition has also narrowed as capacity tightens, and the supply chain’s diversification has become more critical.
Paul Chew
Head Of Research
paulchewkl@phillip.com.sg
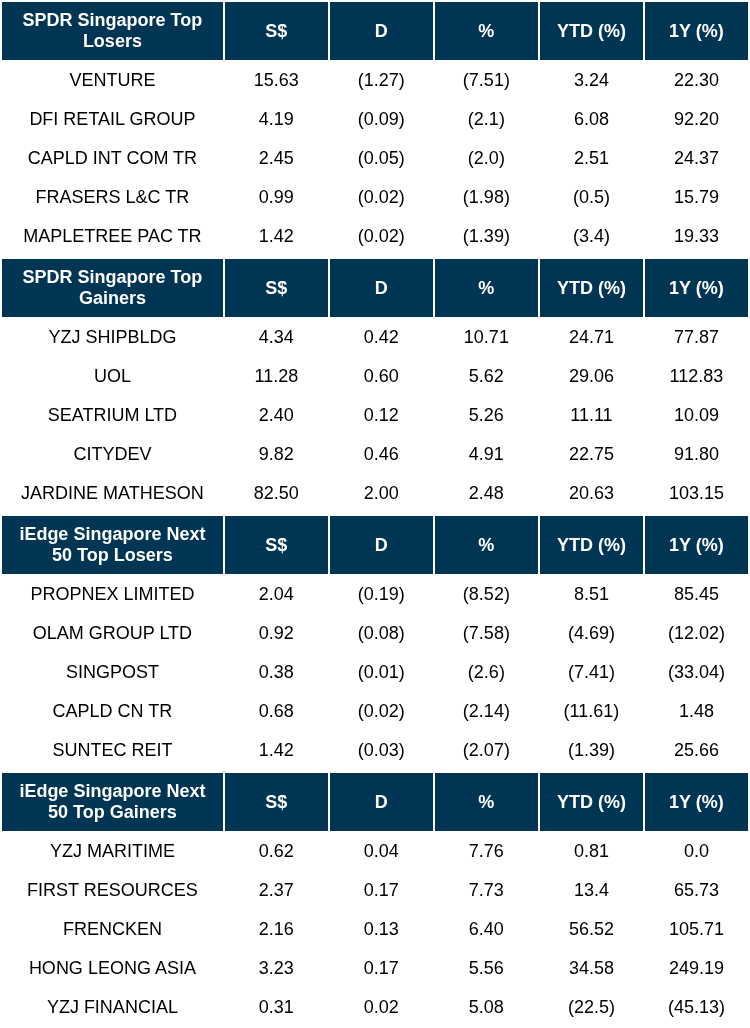
Shares on the Singapore bourse closed higher on Friday (Feb 27) amid mixed regional trading. The local benchmark gained 0.6 per cent or 30.69 points to finish at 4,995.07. Meanwhile, the iEdge Singapore Next 50 Index lost 0.8 per cent or 12.59 points to 1,505.20. Across the broader market, gainers edged out losers 349 to 237, after two billion securities worth S$3.2 billion changed hands.
U.S. stocks were lower after the close on Friday, as losses in the Financials, Technology and Consumer Goods sectors led shares lower. Dow Jones Industrial Average fell 1.05%, while the S&P 500 index lost 0.43%, and the NASDAQ Composite index declined 0.92%.
Singapore Technical Highlights
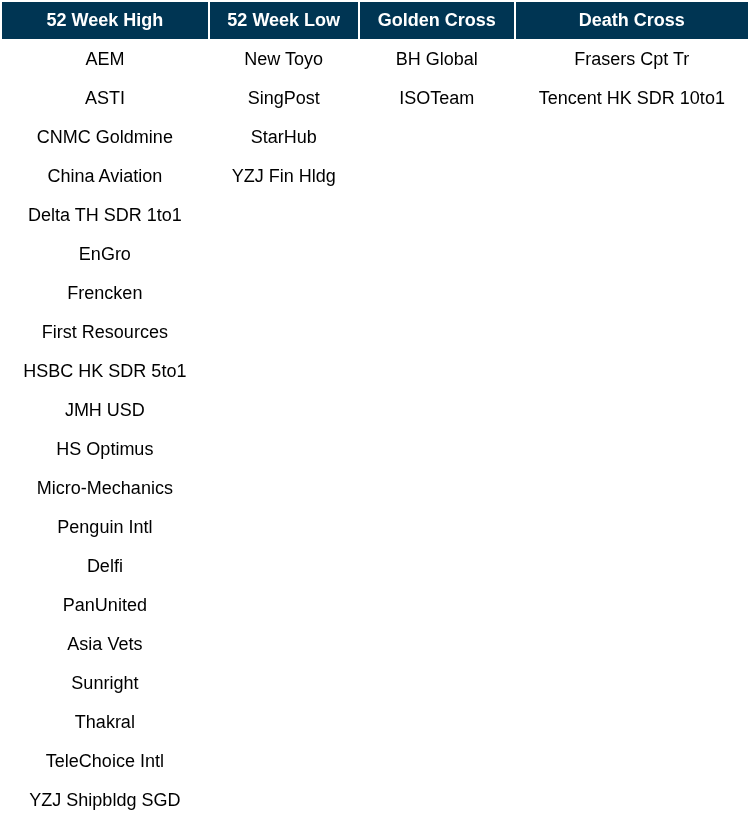
TOP 5 GAINERS & LOSERS
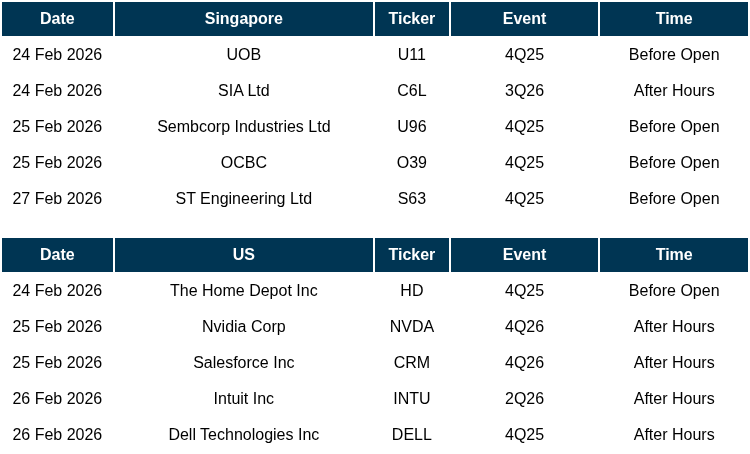
Events Of The Week
SG
UOB Kay Hian posted a net profit of S$140.1 million for its second half ended Dec 31, a 27 per cent increase from the S$110.3 million recorded in the previous corresponding period. This brought its full-year earnings for 2025 to S$239.4 million, from S$224.2 million the previous year.
Yangzijiang Maritime posted a 1 per cent dip in net profit to US$66.2 million for the second half of FY2025, from US$66.9 million in the prior corresponding period. This came as higher operating and listing-related expenses, as well as allowances for finance lease receivables, weighed on earnings.
Far East Orchard’s net profit fell 15.5 per cent to S$34.4 million for the six months ended Dec 31, 2025, due to lower net fair-value gains and higher finance costs.
Banyan Group has reported a 7 per cent decline in net profit to S$33.5 million for the second half ended Dec 31, 2025, from S$35.9 million in the corresponding period a year ago.
BHG Retail Reit on Friday (Feb 27) reported a 72 per cent decline in distribution per unit (DPU) for the second half of 2025, alongside lower net property income (NPI).
Seatrium has successfully delivered a US$475 million wind turbine installation vessel to Maersk Offshore Wind to facilitate the development of a wind farm.
Nordic Group has reported a 9% YoY improvement in earnings to $19.0 million for FY2025, ended Dec 31, 2025. Revenue saw a slight dip of 3% YoY to $158.4 million in FY2025, mainly due to lower revenue contribution from the project services (PS) segment as fewer projects were undertaken in 2HFY2025.
ASTI Holdings has reported revenue was up 11.8% YoY to $36.9 million, driven by higher revenue from the backend equipment solution & technologies segment following increased orders from customers. Gross profit margin improved 15.4 percentage points from 11.5% in FY2024 to 26.9% in FY2025, due to higher revenue and lower direct fixed costs.
International Cement Group has reported net profit attributable to shareholders of $60.0 million in FY2025 ended Dec 31, 2025, up from just $135,000 a year ago. For FY2025, revenue grew by 47% YoY to $378.8 million, driven by higher selling prices and increased sales volumes from its Kazakhstan operations amid strong market demand.
Haw Par Corporation reported a YoY increase of 16.3% in net profit to $265.5 million on the back of a 27% YoY leap in dividend income to $189 million for FY2025 ended Dec 31. Revenue from core operations (healthcare, leisure and property) declined YoY by 6.1% to around $230 million, with gross profit declining 4% to $ 128.8 million.
ComfortDelGro has reported record revenue of $5.06 billion for the FY2025 ended Dec 31, 2025, 13% higher YoY. This also marks the first time the group’s topline has crossed the $5 million mark. Earnings also rose by 9.4% YoY to $230.3 million.
Tuan Sing has reported net profit attributable to shareholders of $32.1 million in FY2025 ended Dec 31, 2025. The significant jump in net profit attributable to shareholders was due to the $51.2 million in value uplift across its Singapore and Australian portfolio. The value uplift came from the completion of enhancement works at Dunearn Village in Singapore and revaluation of its Melbourne property at 121-131 Collins Street, which houses the 550-room Grand Hyatt Melbourne.
ISDN Holdings has reported 2HFY2025 earnings of $5.5 million, an increase of 15.4% over the year-earlier period. Even so, its full-year 2025 earnings of $6.8 million was 20.7% lower YoY as it had booked non-recurring, non-cash, revaluation of long-dated receivables related to its renewable energy business.
UMS Integration has reported 4QYF2025 earnings of $11 million, similar to the year-earlier quarter. This brings its full-year earnings to $41.6 million, a slight increase of 2%. Revenue in the same period was up 4% to $251.1 million.
Attika Group has reported higher earnings of $3.4 million in FY2025, ended Dec 31, despite a 32.4% YoY decline in revenue to $37.5 million in the same period. The lower revenue recorded was primarily due to the high base effect from the completion of a significant corporate office project in FY2024.
Sheng Siong announced earnings have increased by 8.7% YoY to $149.5 million from $137.5 million in 31 Dec 2025.
IREIT Global has reported a distribution per unit (DPU) of €0.3 cents for 2HFY2025, down 59.6% YoY. On a full year basis (FY2025), DPU declined at a lower rate of 42.6% YoY to €1.09 cents.
Frasers Property is paying $391.9 million, or $2,577 psf ppr for the rear plot of The Centrepoint, which will complete its full ownership of the Orchard Road property. The developer can thus maximize the potential of this site, with an eye on “national plans” to rejuvenate the Orchard Road precinct.
US
Dell Technologies shares surged more than 18% shortly after the open on Friday after the group posted better-than-expected fourth-quarter earnings that benefited from an accelerating corporate pivot toward artificial intelligence infrastructure.
Paramount Skydance Corp. has paid the $2.8 billion breakup fee owed to Netflix Inc. after the streaming company dropped its planned deal to buy parts of Warner Bros. Discovery Inc.
CoreWeave Inc fell by the most in more than six months after reporting a bigger-than-expected loss and boosting capital expenditures, spurring concerns about the company over spending on infrastructure.
OpenAI announced Friday an $110 billion investment round at a $730 billion pre-money valuation, with SoftBank Group Corp contributing $30 billion, Nvidia investing $30 billion, and Amazon committing $50 billion.
L3 Technologies Inc. of Londonderry, New Hampshire, has been awarded a $465,993,977 firm-fixed-price contract by the U.S. Department of War for the development, production and testing of the Binocular Night Observation Device.
Source: SGX Masnet, Bloomberg, Channel NewsAsia, Reuters, CNBC, WSJ, The Business Times, The Edge Singapore, PSR
RESEARCH REPORTS
Nvidia Corporation – De-risked valuations, rapid AI momentum
Recommendation: BUY; TP US$220; Last close: US$177; Analyst Yik Ban Chong (Ben)
- 4Q26 revenue was within our expectations, while PATMI exceeded our expectations. FY26 revenue/adj. PATMI were at 101%/107% of our FY26e forecasts. 4Q26 data centre revenue spiked 75% YoY, the highest since 4Q25, driven by Blackwell GPU ramp.
- 4Q26 networking revenue surged 263% YoY to US$11bn, highest increase since 1Q25. Growth was driven by strong demand for NVL72 scale-up switches designed into the Blackwell GB200/GB300 systems. We estimate the amount of AI tokens generated in 2025 has increased 14x YoY, driven by the use of reasoning AI models.
- We upgrade to BUY (prev. ACCUMULATE). We raise our DCF-derived TP to US$220 (prev. US$200) as we roll forward our model, increasing our FY27e revenue/PATMI by 12%/4% respectively. WACC is unchanged at 7.5%. We reduced our growth rate assumption to 4.2% (prev. 4.5%) due to reduced growth visibility beyond 2027e. Nvidia is trading at a one-year forward PE of 24x, a 13% discount to peers’ average of 28x.
Sembcorp Industries Ltd – Pending acquisition to drown out softness
Recommendation: ACCUMULATE; TP S$7.00; Last close: S$6.12; Analyst Paul Chew
- FY25 revenue and adj. PATMI were within expectations at 94% and 95%. 2H25 adj. PATMI declined 2.5% YoY to S$512mn. Earnings faced multiple pressure points, including lower electricity spreads, imported power losses, a drop in gas trading margins, and widening curtailment in China. The acquisition of 20% stake in Senoko in June offset some of the weakness. FY25 dividend per share raised 9% to 23 cents.
- The pressure on earnings is expected to persist in FY26. Electricity contracts are being renewed at 50% lower spreads. Senoko will be impacted severely. UK power is facing weak demand and a maintenance shutdown. China’s renewables are facing rising curtailment, plus the removal of VAT refund. The build-up of renewable capacity in India remains the only source of growth.
- We lowered our FY26e revenue and adjusted EBITDA by 14% to account for the declining electricity and gas margins. Our target price is nudged lower to $7.00 (prev. S$7.10). The EV/EBITDA is raised to 10x from 9x, in line with peer performance. We downgrade our recommendation from BUY to ACCUMULATE. The pending S$4.8bn acquisition of Alinta Energy will drown out the underlying weakness in Singapore’s power operations. The listing of India’s renewable energy portfolio is another positive driver of the share price.
SG Bonds – Week 10: SGS yields flat WoW
Analyst Phillip Research Team
- UST yields declined across the curve over the week. 2Y down 2 bps to 3.40%, the 10Y lower by 14 bps to 3.97%, and the 30Y falling 12 bps to 4.64 %, lowest in 2026.
- SGS yields were broadly stable over the week, with the 2Y rising 3bps WoW, while the 5Y declined 4bps and the 10Y remained largely unchanged.
- Looking ahead, markets are pricing only around a 3% probability of a 25bps rate cut in March, with the first full 25bps easing now shifting to July from June. Domestically, SGS yields are expected to remain broadly range-bound at current levels.
SIA – Passengers soar, cargo tumbles, Air India lingers
Recommendation: NEUTRAL; TP S$7.00; Last close: S$7.18; Analyst Hashim Osman
- 3Q26/9M26 adj. PATMI (ex-associates & divestment gain) / with associates & divestment gain increased 25.8%/0.9% YoY to S$683mn/S$1,296mn, forming 67%/127% of our adj. FY26e estimates. Passenger yield increased 1.9% due to high passenger traffic demand, which outpaced capacity additions of 2.9%. This was offset by a weakening cargo segment, with revenues falling 5.4%. Associate losses deepened as a full quarter of Air India’s losses were recognised, compounded by increased provisions made due to labour law changes in India.
- 3Q26 passengers carried rose 6.3% YoY to 10.8mn, with demand outpacing capacity growth and driving yields up 1.9pp to 10.9%. Scoot’s operating profit surged 160% to S$48mn on strong regional travel demand, new route additions, and potential traffic redirect from Chinese airlines which cut nearly 60% of airline capacity to Japan.
- We maintain NEUTRAL with higher TP of S$7.00 (prev: S$6.04). The P/B multiple has been raised from 1.2x to 1.3x to trade in line with peers. SIA’s core passenger business remains resilient, with strong yield momentum and regional travel demand. Cargo underperformance is transitory, with recovery expected as external headwinds ease. However, Air India may continue to weigh on group earnings near term.
ST Engineering Ltd – Escalating defence tailwinds
Recommendation: BUY; TP S$13.00; Last close: S$9.97; Analyst Paul Chew
- FY25 results were within expectations. Revenue/adj. PATMI were 97%/99% of our FY25e forecast. Headline earnings were a decline of 34% YoY to S$462mn due to S$667mn impairment of iDirect. FY25 adj. PATMI was up 21% to S$850mn.
- 2H25 earnings grew 23% YoY to S$448mn, supported by 25% and 15% jump in commercial aerospace (CA) and defence (DPS) operating earnings, respectively. Engine MRO and nacelle production were the key drivers of CA’s growth. Operating leverage and product mix also expanded margins, especially for DPS.
- We raised our FY26e earnings by 11% to S$1.0bn. Orders expected to be delivered in FY26e are projected to grow at a 12.5% rate (FY25: +11.4%). We increased our DCF target price to S$13.00 (prev. S$8.20), as we revise up our terminal growth rate assumptions. Our recommendation is raised from NEUTRAL to BUY. Defence spending globally is undergoing a major structural uplift. Geopolitical alliances are fracturing and threats re-emerging. ST Engineering is looking to double its international defence sales. It is penetrating new markets with its track record, automation, localisation and neutrality. The higher valuations are supported by multi-year visibility into growth, scarcity and high ROEs of 33%.
Venture Corporation Ltd – Bottom in sight
Recommendation: ACCUMULATE; TP S$16.80; Last close: S$15.63; Analyst Paul Chew
- FY25 results were within expectations. Revenue/PATMI were 101%/99% of our FY25e forecast. 2H25 PAMI declined 6% YoY to S$114mn, dragged down by a similar 6% fall in revenue. The pace of contraction in 4Q25 revenue was slower at 3% YoY. FY25 dividend of 80 cents was 5 cents higher due to the interim special announced earlier.
- Venture’s guidance reflected a more positive trajectory. There were more identifiable product initiatives to accelerate the growth momentum into 2026. The areas of growth were consumer lifestyle, semiconductors and network equipment in data centres.
- We upgrade the recommendation to ACCUMULATE from NEUTRAL. We inch up our FY26e PATMI by 3% to S$256mn. The target price is raised to S$16.80 (prev. S$13.00). Our target PE ratio is increased to 19x from 15x, toward the higher quartile of the 5-year average. We expect earnings to recover in FY26. The major driver will be the new generation consumer lifestyle product launch in 2H26. down by 1% on account of lower interest rates and foreign exchange. Global rollout of data centres will benefit its networking, communications, instrumentation and semiconductor divisions. The dividend yield of 5.1% (or S$230mn payout) is backed by free cash flows of S$200-300mn p.a. and net cash balance sheet of S$1.28bn.
Salesforce Inc – Platform Cloud Growth Strengthens
Recommendation: BUY (Maintained), Last done: US$194, TP: US$253, Analyst: Alif Fahmi
- FY26 revenue met our expectations, while earnings were ahead. FY26 revenue/adj. PATMI were at 100%/109% of our forecasts. Adj. EPS came in at US$3.81, ahead of the US$3.03 guidance.
- We expect group revenue to rise 10% YoY in FY27e, led by Platform Cloud growth of 22%, offsetting weakness in Commerce and Analytics Clouds. We think the opportunity lies in upselling to customers with higher AWU per token, driving high value at low cost. Margins could expand as token costs fall and AI models are commoditised. Current RPO is expected to rise 14% YoY (from 12% in 1Q26), with reacceleration likely and supported by larger deal wins. The company authorised a US$50bn share buyback for FY27e and beyond (27% of the US$183bn market cap).
- We maintain a BUY recommendation with a TP of US$253 (prev. US$382). FY27e estimates revenue is up 1% on Platform Cloud growth, while adj. PATMI rises 10% from strong Q4 results. WACC raised to 9.9% (prev. 8.4%) due to higher Beta. Terminal growth cut to 5.5% (prev. 6%) due to competition from AI model providers, which could enable enterprises to bypass Salesforce and reduce premium SKU adoption. We think Salesforce is less affected by AI disruption, with three AI monetization levers 1) premium AI SKUs with embedded AI and unlimited agentic access, 2) seat expansion in core clouds as agentic AI scales, and 3) consumption credits for customer-facing agents.
Market Journal articles powered by PhillipGPT
Singapore Budget 2026 Signals Strategic AI Pivot, Equity Boost
DBS Group Holdings Ltd Upgraded to Accumulate Despite Earnings Decline
Elite UK REIT Shows Strong Performance with Successful Lease Regearing
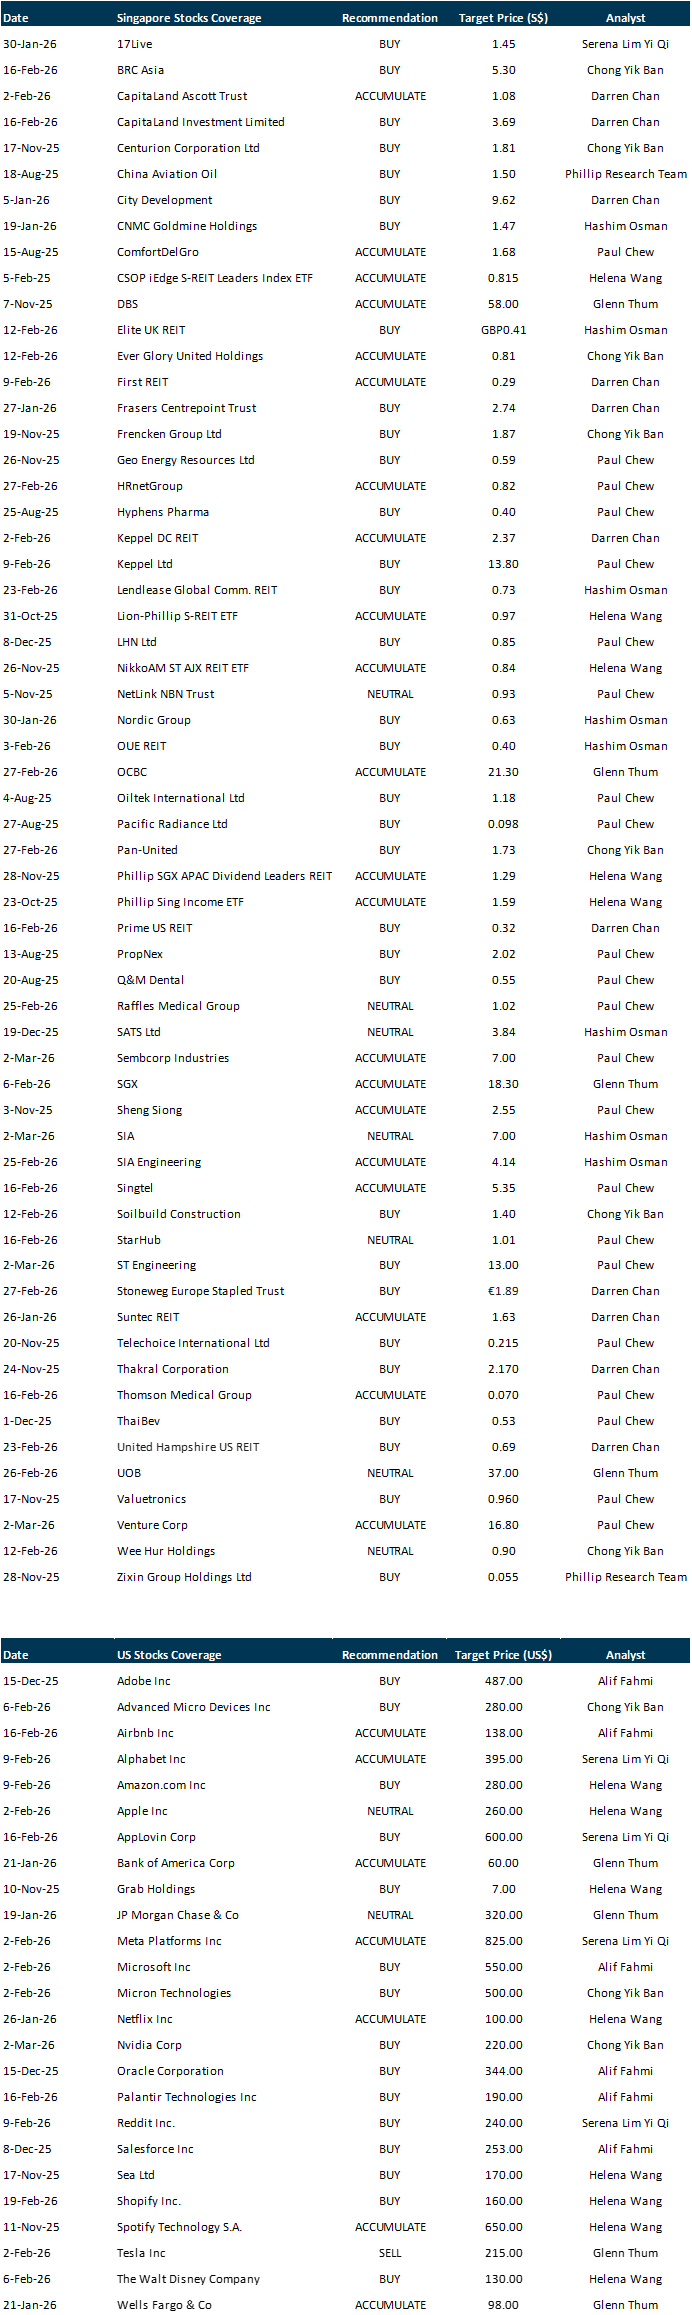
PSR Stocks Coverage
For more information, please visit:
Upcoming Webinars
Corporate Insights by Attika Group
Date & Time: 3 March 26 | 12PM-1PM
Register: poems-20260303-139953
Corporate Insights by LMS Compliance
Date & Time: 4 March 26 | 12PM-1PM
Register: poems-20260304-139955
Corporate Insights by OUE REIT
Date & Time: 5 March 26 | 12PM-1PM
Register: poems-20260212-138119
Corporate Insights by Lendlease REIT
Date & Time: 10 March 26 | 12:30PM-1:30PM
Register: poems-20260310-138683
Corporate Insights by Ever Glory
Date & Time: 13 March 26 | 12PM-1PM
Register: poems-20260313-140475
POEMS Podcast:


Research Videos
Weekly Market Outlook: ABNB, Reddit, SPOT, Grab, DBS, LREIT, CLI, TMG, Mag7, SG Weekly & More!
Date: 23 Feb 2026Click here for more on Market Outlook.
Sign up for our webinars here, and be among the first to receive economy and market updates.
PHILLIP RESEARCH IN 3 MINS
Join our Singapore Equity Research Community on POEMS Mobile 3 App for the latest research reports, market updates, insights and more

Disclaimer
The information contained in this email and/or its attachment(s) is provided to you for information only and is not intended to or nor will it create/induce the creation of any binding legal relations. The information or opinions provided in this email do not constitute an investment advice, an offer or solicitation to subscribe for, purchase or sell the e investment product(s) mentioned herein. It does not have any regard to your specific investment objectives, financial situation and any of your particular needs. Accordingly, no warranty whatsoever is given and no liability whatsoever is accepted for any loss arising whether directly or indirectly as a result of this information. Investments are subject to investment risks including possible loss of the principal amount invested. The value of the product and the income from them may fall as well as rise. You may wish to seek advice from an independent financial adviser before making a commitment to purchase or investing in the investment product(s) mentioned herein. In the event that you choose not to do so, you should consider whether the investment product(s) mentioned herein is suitable for you. PhillipCapital and any of its members will not, in any event, be liable to you for any direct/indirect or any other damages of any kind arising from or in connection with your reliance on any information in and/or materials attached to this email. The information and/or materials provided 揳s is?without warranty of any kind, either express or implied. In particular, no warranty regarding accuracy or fitness for a purpose is given in connection with such information and materials.
Confidentiality Note
This e-mail and its attachment(s) may contain privileged or confidential information, which is intended only for the use of the recipient(s) named above. If you have received this message in error, please notify the sender immediately and delete all copies of it. If you are not the intended recipient, you must not read, use, copy, store, disseminate and/or disclose to any person this email and any of its attachment(s). PhillipCapital and its members will not accept legal responsibility for the contents of this message. Thank you for your cooperation.

Follow our Socials