
Oversea-Chinese Banking Corp Ltd – Higher-than-expected allowances
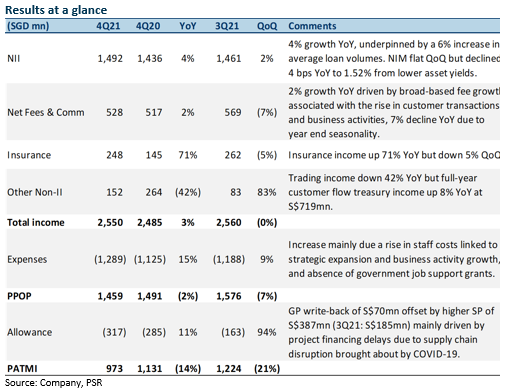
28 Feb 2022- FY21 earnings of S$4.86bn met our estimates despite higher-than-expected allowances which were offset by higher net interest income. 4Q21 DPS rose 12% to 28 cents.
- Management guidance is single-digit loans growth, stable NIMs and lower credit costs for FY22e.
- Maintain BUY with an unchanged target price of S$14.22. We raise FY22e earnings by 13% as we increase NII and fee income estimates for FY22e. We assume 1.28x FY22e P/BV and ROE estimate of 9.3% in our GGM valuation. Catalysts include lower provisions and higher interest income as economic conditions improve. A 100bps rise in interest rates can raise NIM by 0.18% and PATMI by 10%. OCBC is our preferred pick amongst the three banks due to attractive valuations, upside in dividend from the 15% CET 1 buffer and lower provisioning as Indonesia and Malaysian economies recover.
The Positives
+ Fee income grew 2% YoY. Fee and commission income grew 2% YoY but fell 7% QoQ due to year-end seasonality. Full-year fee income grew 12% YoY to a record S$2.25bn from broad-based fee growth on the back of higher transaction volumes and customer activities, particularly from wealth management income which made up 37% (S$3.92bn) of the Group’s income in FY21. The Group’s FY21 assets under management (AUM) rose 7% YoY to record high S$258bn. FY21 insurance income grew 63% to S$1.14bn, driven by favourable financial market conditions and higher operating profit from Great Eastern Holdings’ insurance business.
+ Net interest income grew 4% YoY. NII grew 4% YoY and 2% QoQ led by loan growth of 8% YoY and 2% QoQ while NIMs remained flat QoQ at 1.52%. Loan growth was broad-based across both corporate and consumer segments, with the majority of the increase coming from Singapore, Greater China, and the Group’s international network. OCBC has guided mid- to high single-digit loan growth for FY22e.
The Negatives
– SPs increased 109% QoQ. SPs of S$387mn were made during the quarter, which is 109% higher than 3Q21’s SPs of S$185mn. This increase was mainly driven by project financing delays due to supply chain disruption brought about by COVID-19. Management said that they are located mainly in Greater China and do not pose a systemic risk. However, OCBC was able to write back GPs of S$70mn during the quarter mainly due to downgrade of accounts to ECL stage 3 allowances, and refresh of the macroeconomic variables in the ECL model. Total NPAs rose by 2% QoQ and 8% YoY to S$4.3bn, but the group NPL ratio was stable at 1.5%. OCBC has guided credit costs of 20-25bps for FY22e compared with FY21’s credit costs of 29bps.
– Malaysia and Indonesia NPLs up QoQ. NPLs in Malaysia were up 8% QoQ to S$1.47bn while NPLs in Indonesia were up 17.5% QoQ to S$1.21bn in 4Q21. The increase was mainly due to loan moratorium extensions in both countries and the introduction of the PEMULIH relief package in Malaysia, where some loans under support were classified as NPLs. Nonetheless, management said that the increased NPLs in the two countries are customer- related and cover a broad spectrum of loans and are not trend-related.
Outlook
Loan growth: Loans grew 8% YoY in 4Q21 to S$290bn, meeting the bank’s guidance of a high single-digit increase for FY21e. Management sees further lending opportunities in the wholesale segment and sustainable financing. Green and sustainable finance was up 66% YoY to S$23.3bn and now forms 8% of its loan book. Mortgage pipelines in Singapore and Hong Kong are also healthy, with more drawdowns expected in FY22.
China: OCBC’s total exposure to mainland China remains at 11% of Group loans, with onshore exposure at S$7bn and offshore exposure at S$25bn. Nonetheless, customers include mainly top state-owned enterprises, large local corporates, as well as OCBC’s network customers. Less than one-third of the Group’s Mainland China onshore exposure (S$2bn) are corporate real estate loans, largely lending to the bank’s network customers. NPL ratio for non-bank Mainland China loans increased to 0.8% from 0.5% in the previous quarter due to project financing delays mentioned above.
NIM: Management has guided stable NIMs of 1.5-1.55% for FY22e. Nonetheless, it said that based on historical data, a 100bps increase in rates would lead to a 18bps increase in NIMs. Assuming rate hikes totalling 100bps this year, based on our calculations, our FY22e NII can climb S$725mn (or 11%) resulting in an increase in our FY22e PATMI by 10%.
About the author

Glenn Thum
Research Analyst
PSR
Glenn covers the Banking and Finance sector. He has had 3 years of experience as a Credit Analyst in a Bank, where he prepared credit proposals by conducting consistent critical analysis on the business, market, country and financial information. Glenn graduated with a Bachelor of Business Management from the University of Queensland with a double major in International Business and Human Resources.


About the author
Glenn Thum
Research Analyst
PSR
Glenn covers the Banking and Finance sector. He has had 3 years of experience as a Credit Analyst in a Bank, where he prepared credit proposals by conducting consistent critical analysis on the business, market, country and financial information. Glenn graduated with a Bachelor of Business Management from the University of Queensland with a double major in International Business and Human Resources.
 Keppel DC REIT - DXC settlement offers partial relief from uncollected rents
 Apr 19th - Things to Know Before the Opening Bell
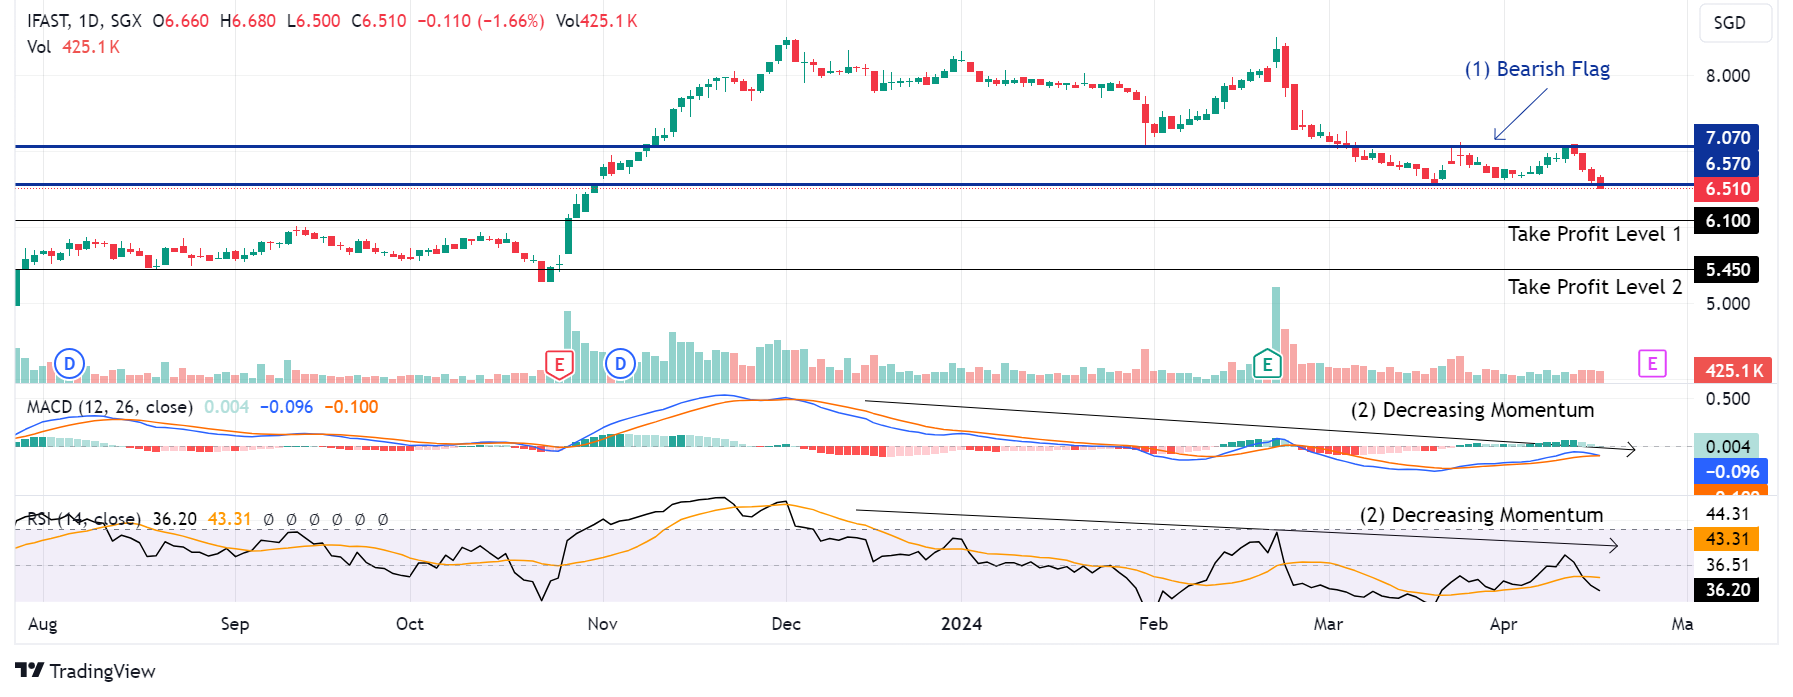 Trade of the Day - iFAST Corporation Ltd (SGX: AIY)