
Japan-Weekly Strategy Report “A Major SQ Anomaly Once More, Normalisation From Continuous Significant Interest Rate Hikes at the ECB”
21 Mar 2023Report type: Weekly Strategy
A Major SQ Anomaly Once More, Normalisation From Continuous Significant Interest Rate Hikes at the ECB
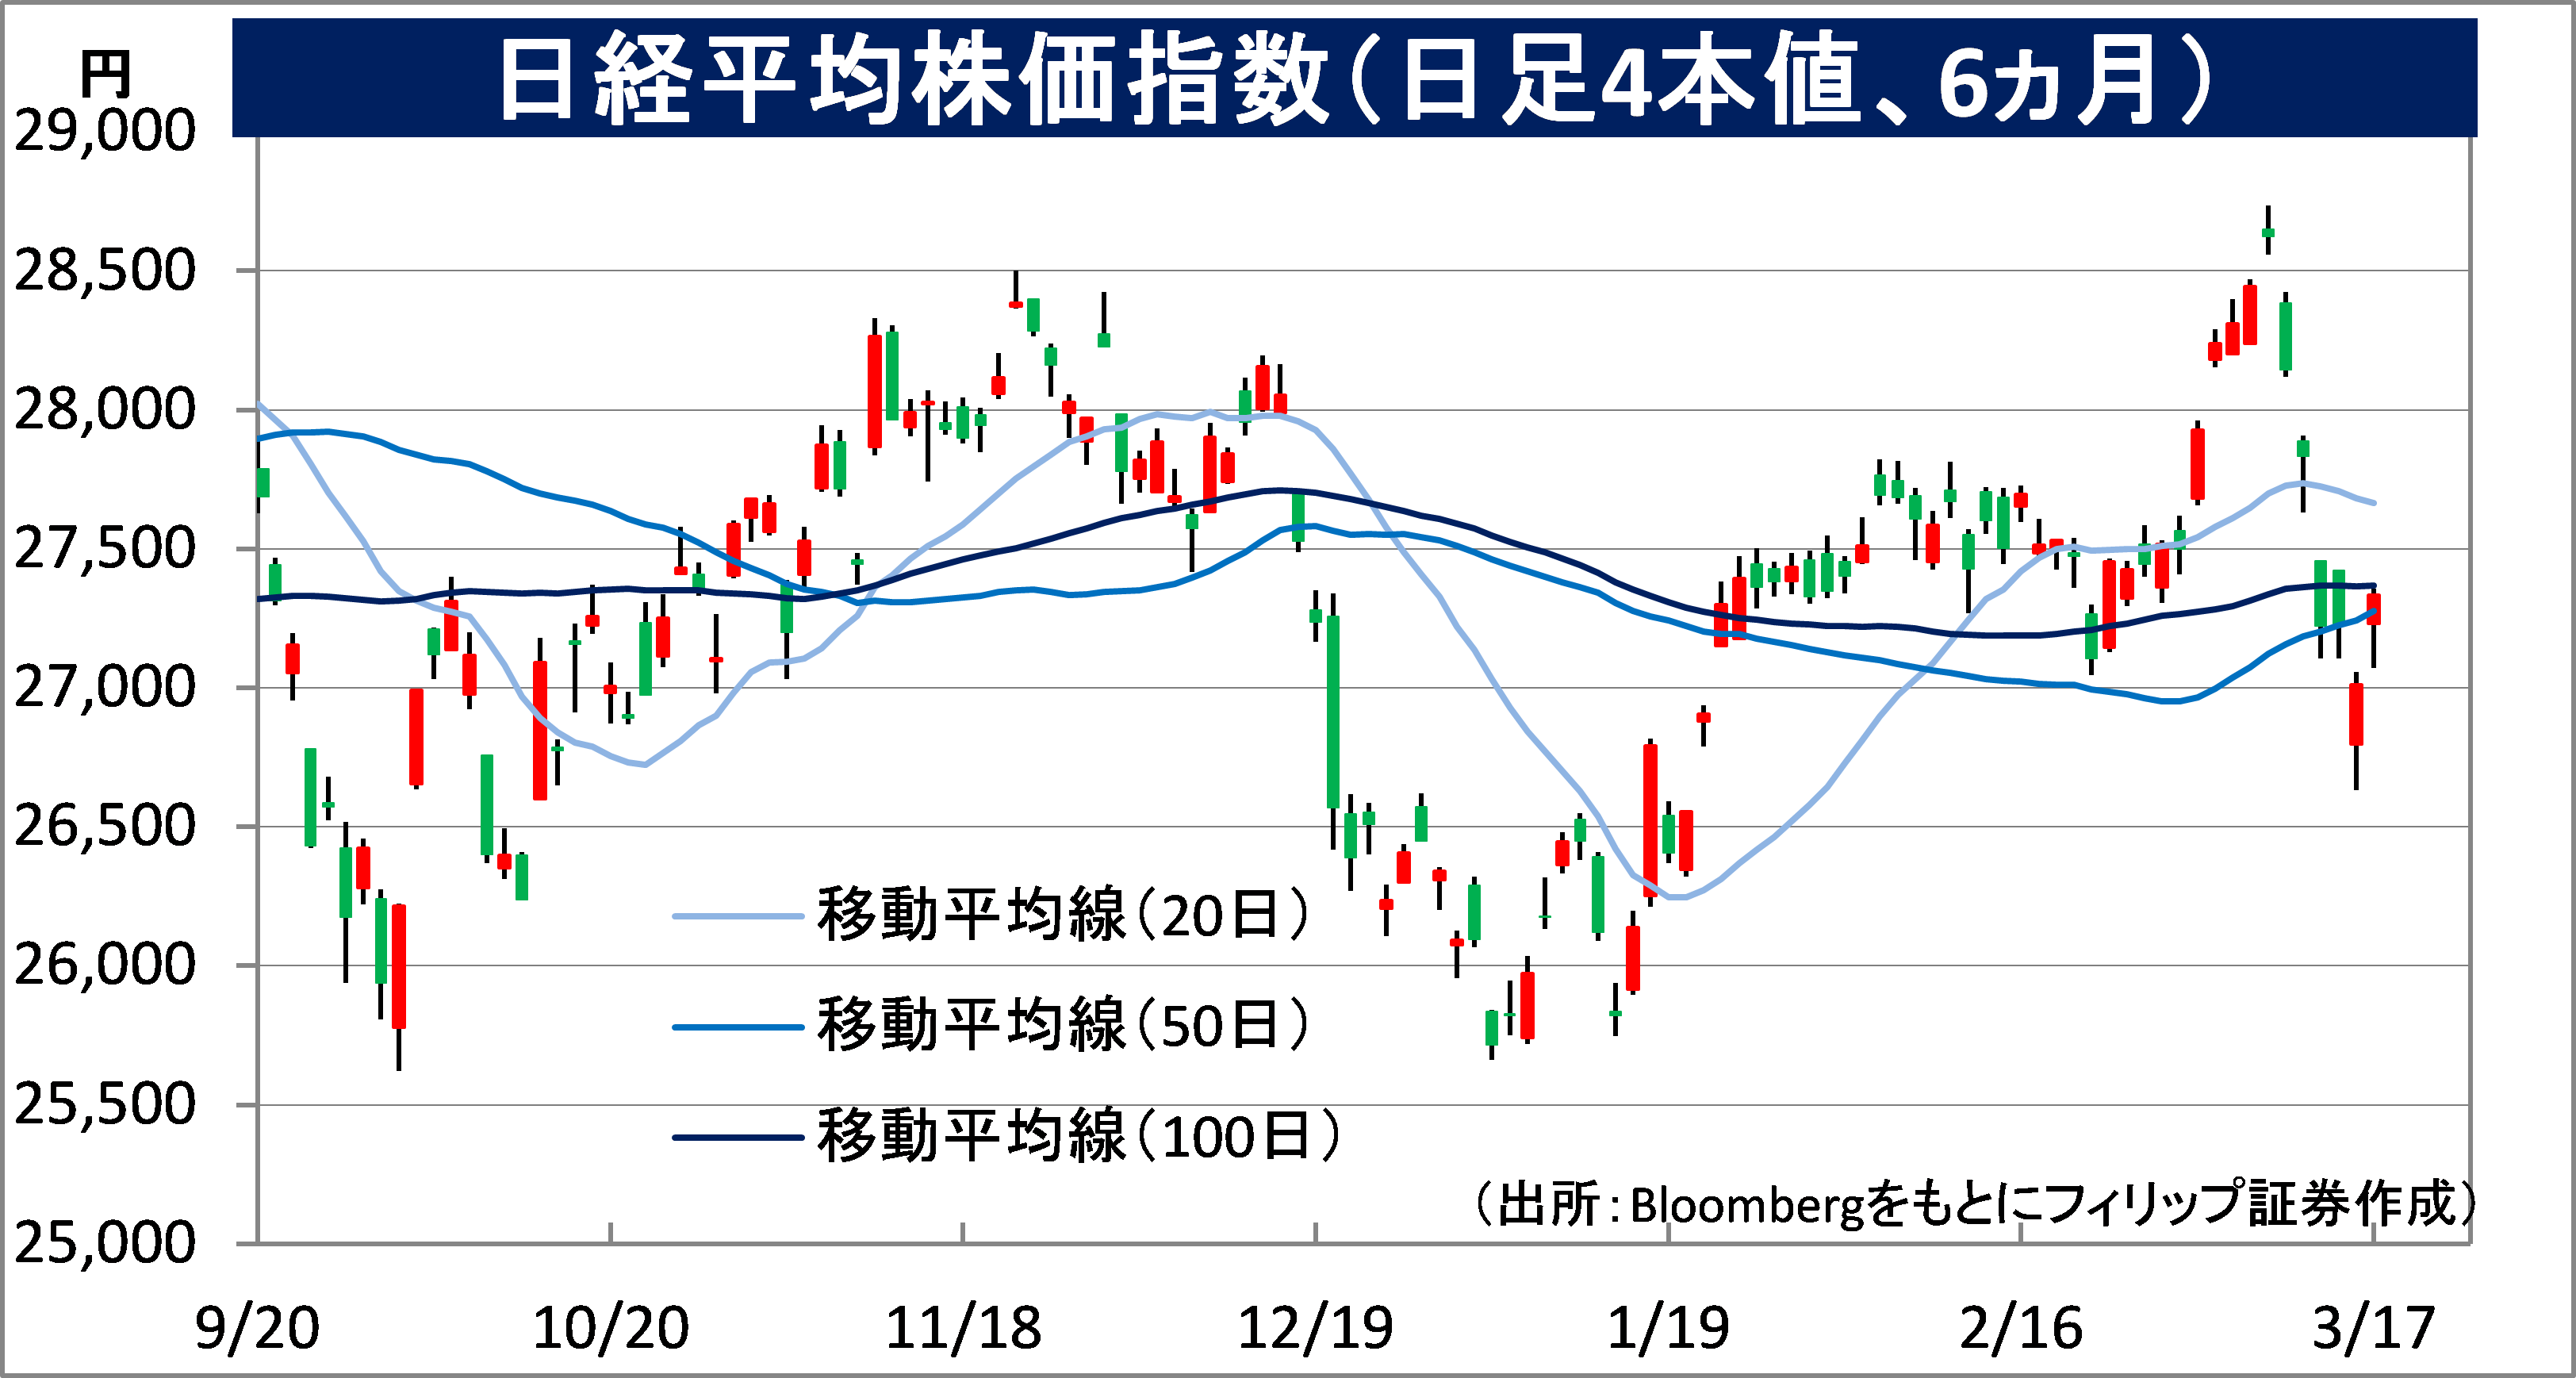
It was a week of confusion where the chain of U.S. regional bank failures spread to concerns of failure in the Swiss financial giant, Credit Suisse, due to management uncertainties. Although the Nikkei average rose steadily to the high of 28,734 points on the 9th, it plunged to the low of 26,632 points 5 business days later on the 16th.
Recently, it has become common for the market to fluctuate greatly in the short term from around the “Major SQ” for the whole of March, which determines the Special Quotation value (SQ value) involving the final settlement of futures and options. Aside from what will happen with regard to this point, it might have been necessary to take precautions.
In ‘22, ① in March, in response to the Russian invasion in February, after falling to last year’s low at 24,681 points on 9/3, it rebounded and rose to mark the recovery high of 28,338 points 12 business days later on 25/3. ② In June, after marking the recovery high of 28,389 points on 9/6, which was a day before Friday on the weekend of the Major SQ week similar to this time round, it fell to 25,520 points 7 business days later on the 20th. ③ In September, after shifting in a recovery rise to 28,530 points on the 13th, which was a Tuesday a week after the Major SQ week, it marked the low of 25,621 points 12 business days later on 3/10. ④ In December, after marking the recovery high of 28,195 points on the 14th, which was a Wednesday a week after the Major SQ week, it fell to the low of 25,661 points 13 business days later after the new year on 4/1. As seen from this, despite having a different direction from the rise in March and the decline in June, September and December, it can be observed that similar movements are indicated from around the Major SQ. In particular, for March, in addition to the stock market saying of the “equinoctial week bottom”, it seems that there may be a high chance of a similar “anomaly” (a rule of thumb in the market which lacks rationale but often comes true) occurring due to it being around the corner of the March full year business results for enterprises in Japan. For the time being, when there is a stock price drop towards late March, it could be an opportunity to buy towards the new fiscal year.
We have been reminded of the tendency of a downward pressure on stock prices due to an appreciation of the yen and high bonds (decline in the long-term interest rate) in response to a credit crunch in banks worldwide. In the midst of this, on the 16th, the European Central Bank (ECB) strongly set forth to eradicate inflation by hiking policy interest rates by 0.50 points in accordance with the initial forecast. Since the reasons for a bank credit crunch are different for each bank for the whole country, rather than easing money across the board, in terms of an ideal approach, carrying out the supply of liquidity specific to each case could be regarded as an appropriate approach. In Japanese stocks, we can expect a continued lookout for bank stocks that were bought from January to February, other low P/B ratio value stocks and those related to inbound tourism, etc.
For the Japanese bond market as well, the newly issued 10-year government bonds fell to 0.28% at the closing price on the 16th. The handover settlement date for long-term bond futures is on the 20th of each expiration month, and due to the need for sellers to make spot preparations, we ought to note that interest rates tend to decline due to purchasing pressure in the spot bond market.
In the 20/3 issue, we will be covering Alconix (3036), Fukuoka Financial Group (8354), Konoike Transport (9025), and Daiei Kankyo (9336).
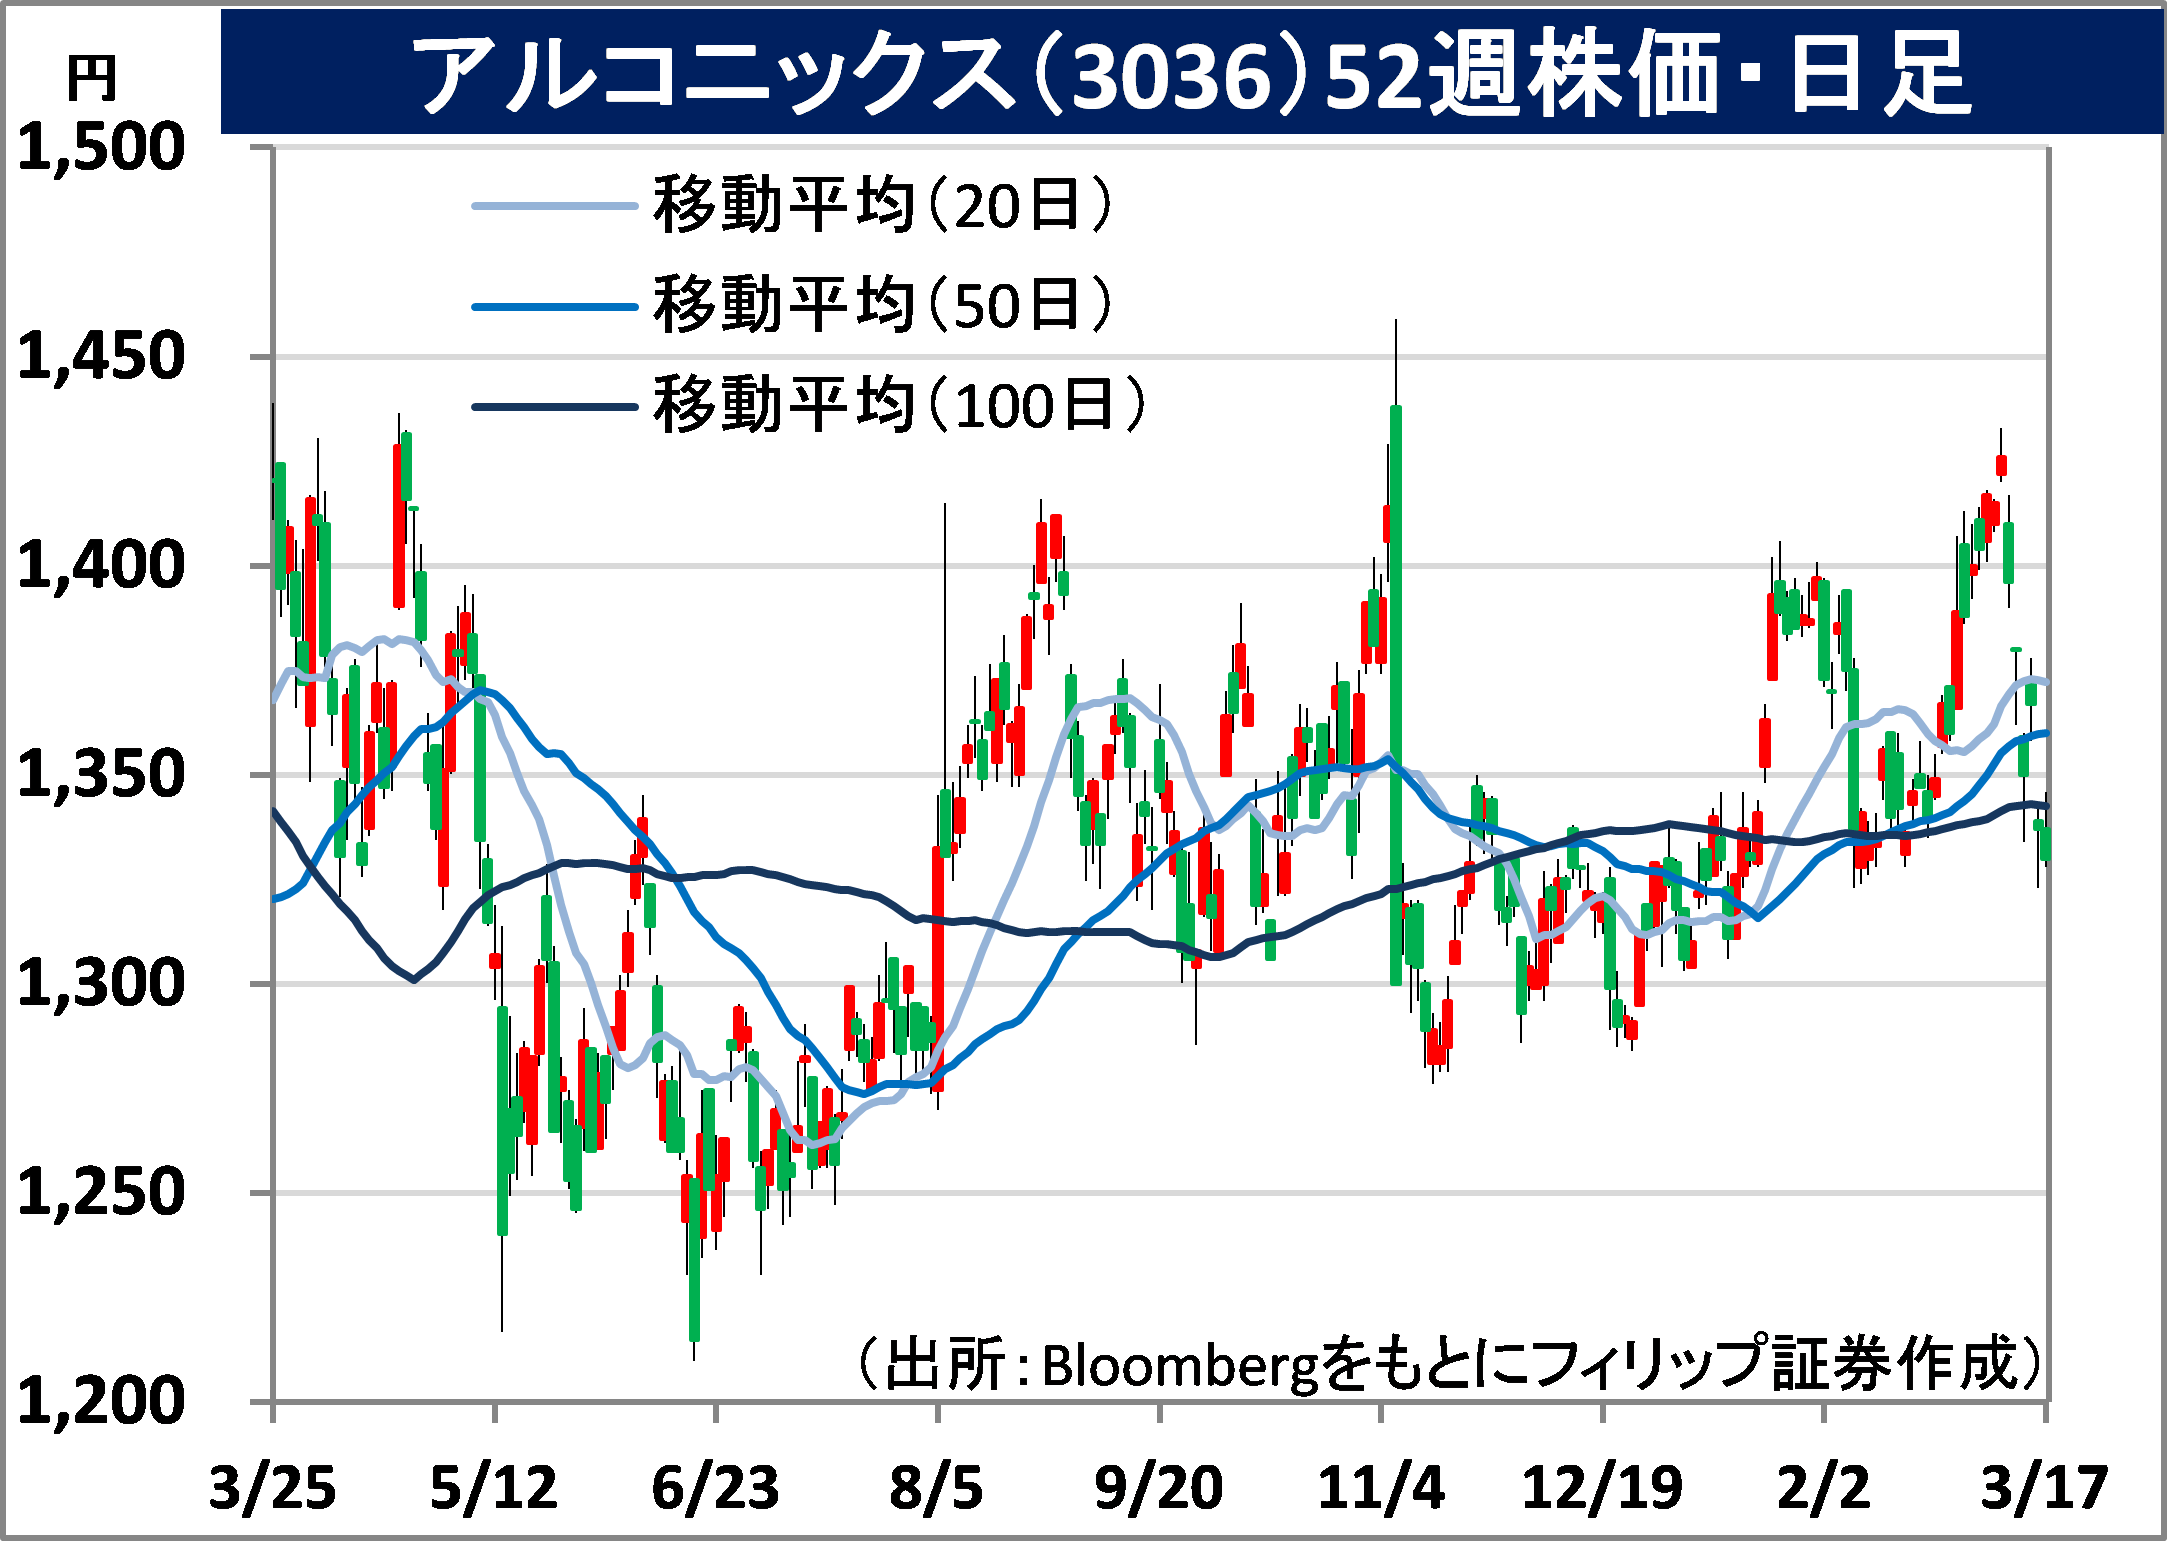
Alconix Corporation (3036) 1,330 yen (17/3 closing price)
・After establishing as Nissho Iwai Non-Ferrous Metals in 1981, they carried out an MBO in 2001. They are a nonferrous metals general enterprise that fuses trading company distribution (electronic functional materials and Aluminium bronze) and manufacturing (device materials and metal processing). They are characterized by proactive M&A.
・For 9M (Apr-Dec) results of FY2023/3 announced on 8/2, net sales increased by 18.9% to 135.712 billion yen compared to the same period the previous year and operating income decreased by 13.9% to 7.255 billion yen. All 4 key businesses had an increase in revenue, however, trading company distribution’s aluminium bronze and manufacturing’s device materials and metal processing had decreased in profit. An increase in selling, general and administrative expenses following the new acquisition of a consolidated subsidiary and a rise in procurement prices due to the weak yen have affected, leading to a decrease in operating income.
・For its full year plan, net sales is expected to increase by 8.8% to 170 billion yen compared to the previous year and operating income to decrease by 17.4% to 9.1 billion yen. Annual dividend is to remain unchanged at 52 yen. With the company having made 14 companies wholly-owned subsidiaries over 13 years by ’22, it has led to overall profit growth without once recording an impairment loss following acquisition. At the closing price on the 16th, their actual results P/E ratio was approx. 6 times and the P/B ratio was 0.63 times. Nidec (6594), which is similarly known to excel at M&A, had a P/B ratio of 2.4 times. There may be room for a review.
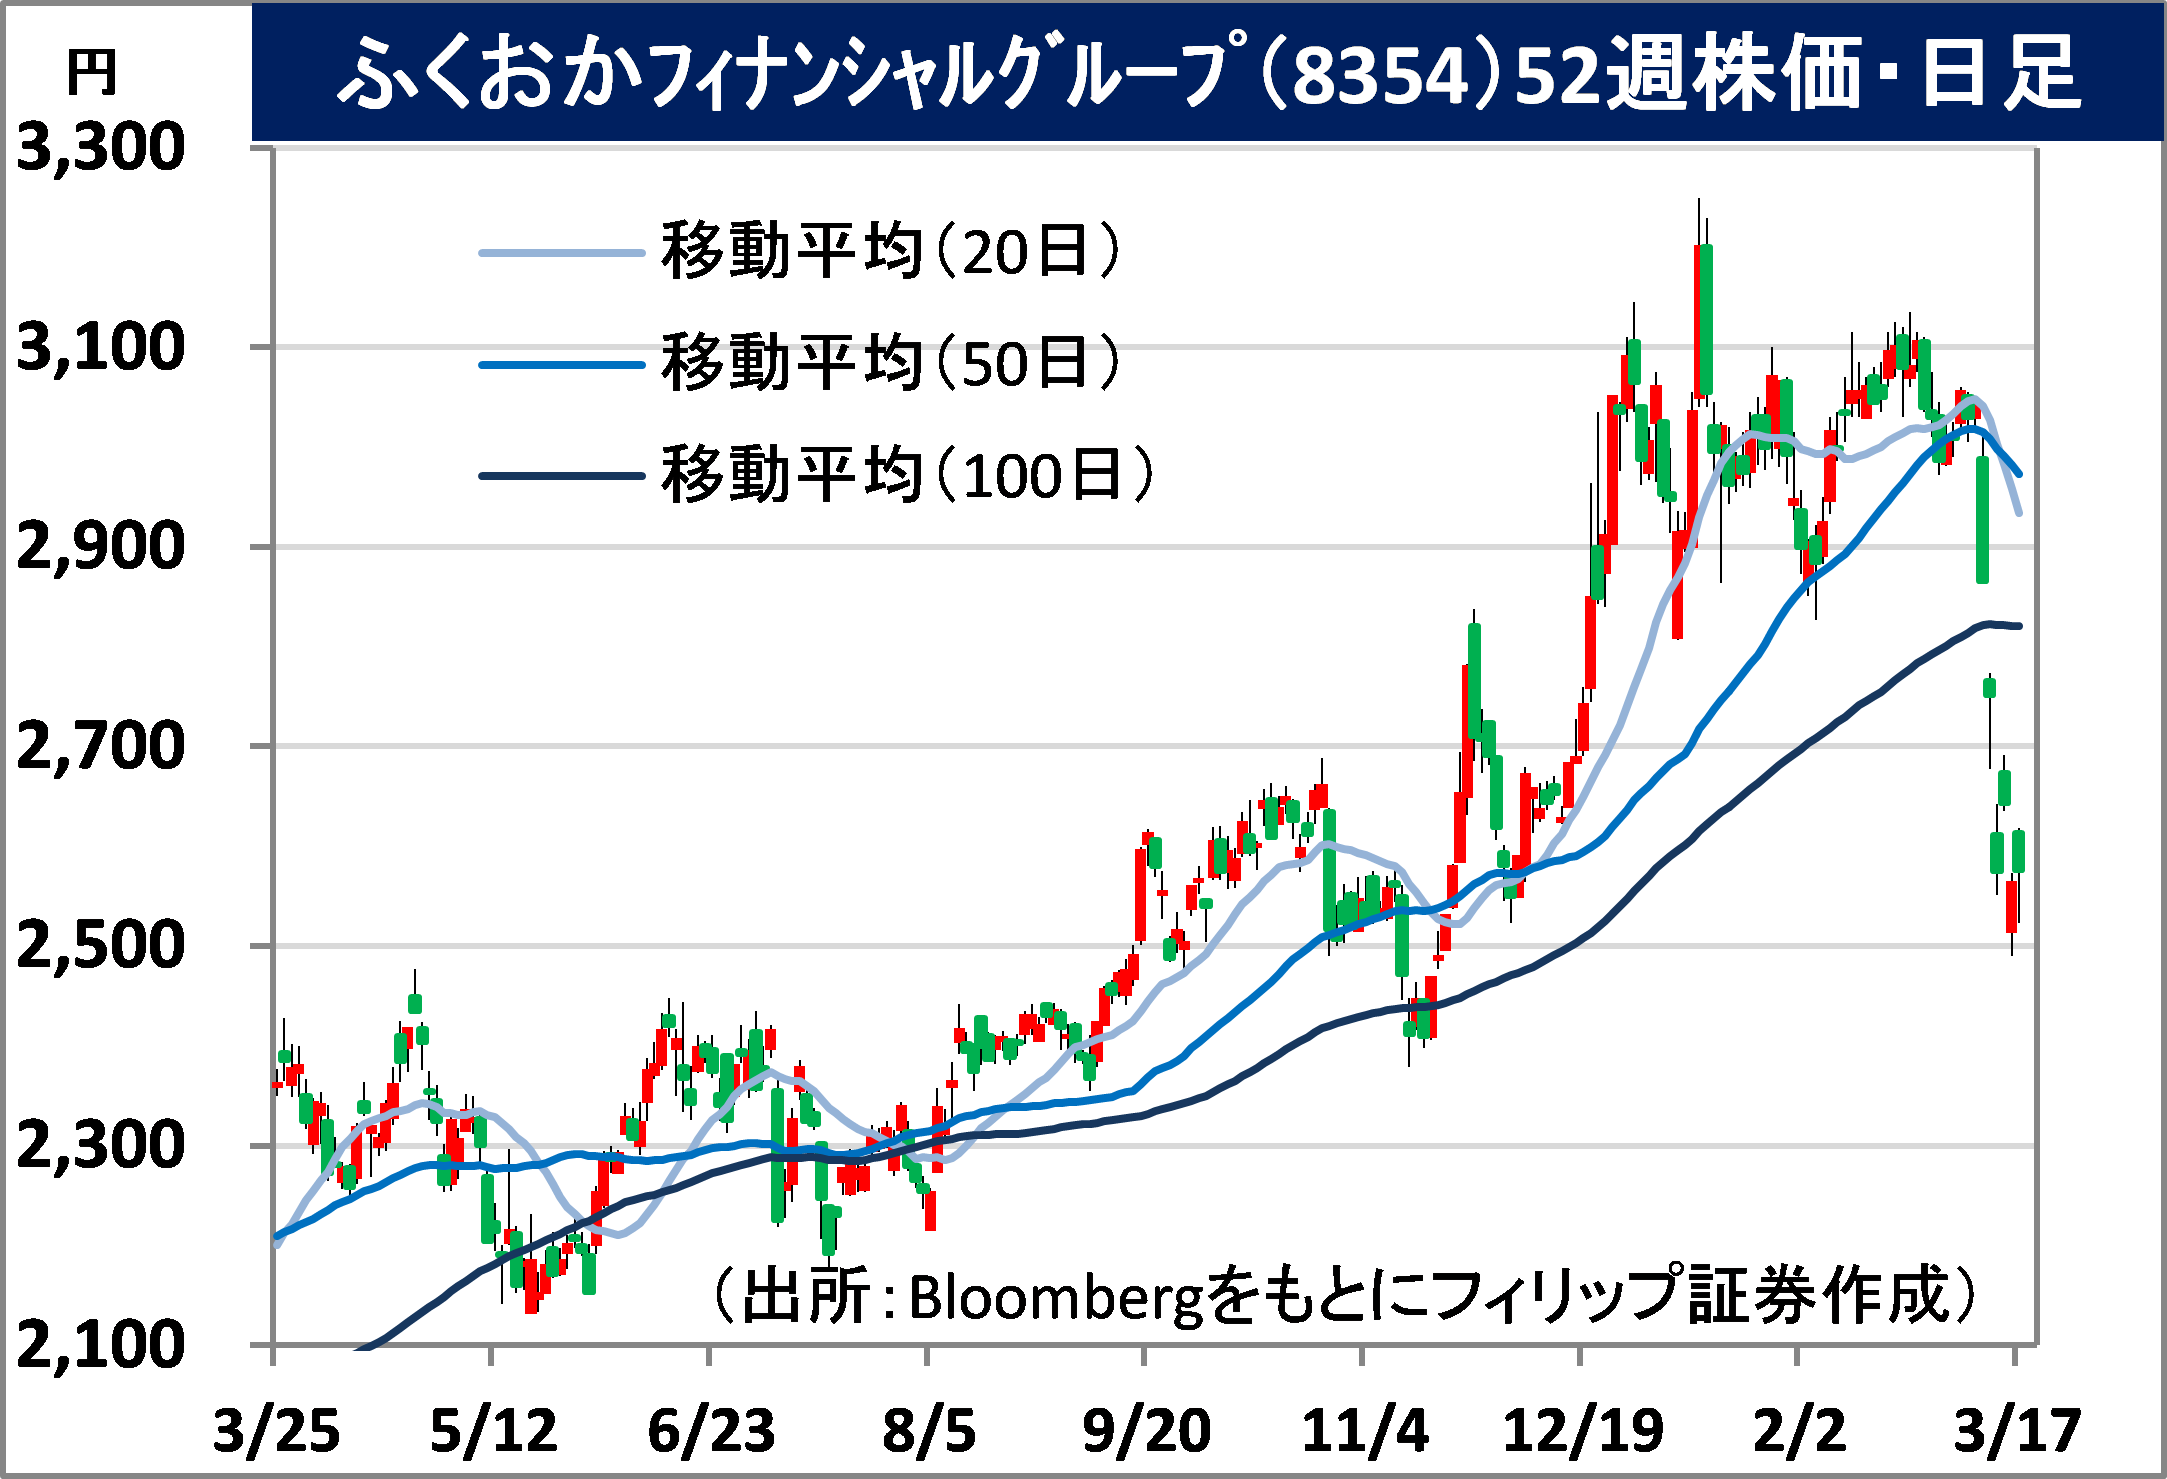
Fukuoka Financial Group, Inc. (8354) 2,576 yen (17/3 closing price)
・Established via an integration between Fukuoka Bank and Kumamoto Family Bank (presently renamed to Kumamoto Bank) in 2007. Integrated businesses with Shinwa Bank in the same year. After integrating businesses with Juhachi Bank in 2019, they started up as Juhachi-Shinwa Bank in Nagasaki Prefecture in 2020.
・For 9M (Apr-Dec) results of FY2023/3 announced on 31/1, core net operating profit increased by 10.4% to 82.712 billion yen compared to the same period the previous year, credit cost increased by 3.3 times to 3.036 billion yen and net income decreased by 26.1% to 32.649 billion yen. While there was an increase in core net operating profit due to the contribution from a decrease in expenses and an increase in net fees and commissions and net interest income, a decrease in gains/losses on bond transactions had affected, leading to a decrease in profit.
・Company revised its full year plan (on a combined basis of 3 bank units) downwards. Although core net operating profit is expected to increase by 6.7% to 104 billion yen compared to the previous year and annual dividend to have a 10 yen dividend increase to 105 yen, which remains unchanged from the original plan, as a result of proceeding with portfolio restructuring mainly in foreign bonds, net income is to decrease by 29.9% to 48.2 billion yen (original plan 73.2 billion yen). For the mobile-exclusive bank, “Minna Bank”, for the end of December compared to the end of September, number of accounts increased by 15%, deposit balance increased by 18% and loan balance increased by 64%.
About the author

Phillip Research Team (Japan)


About the author
 Apr 19th - Things to Know Before the Opening Bell
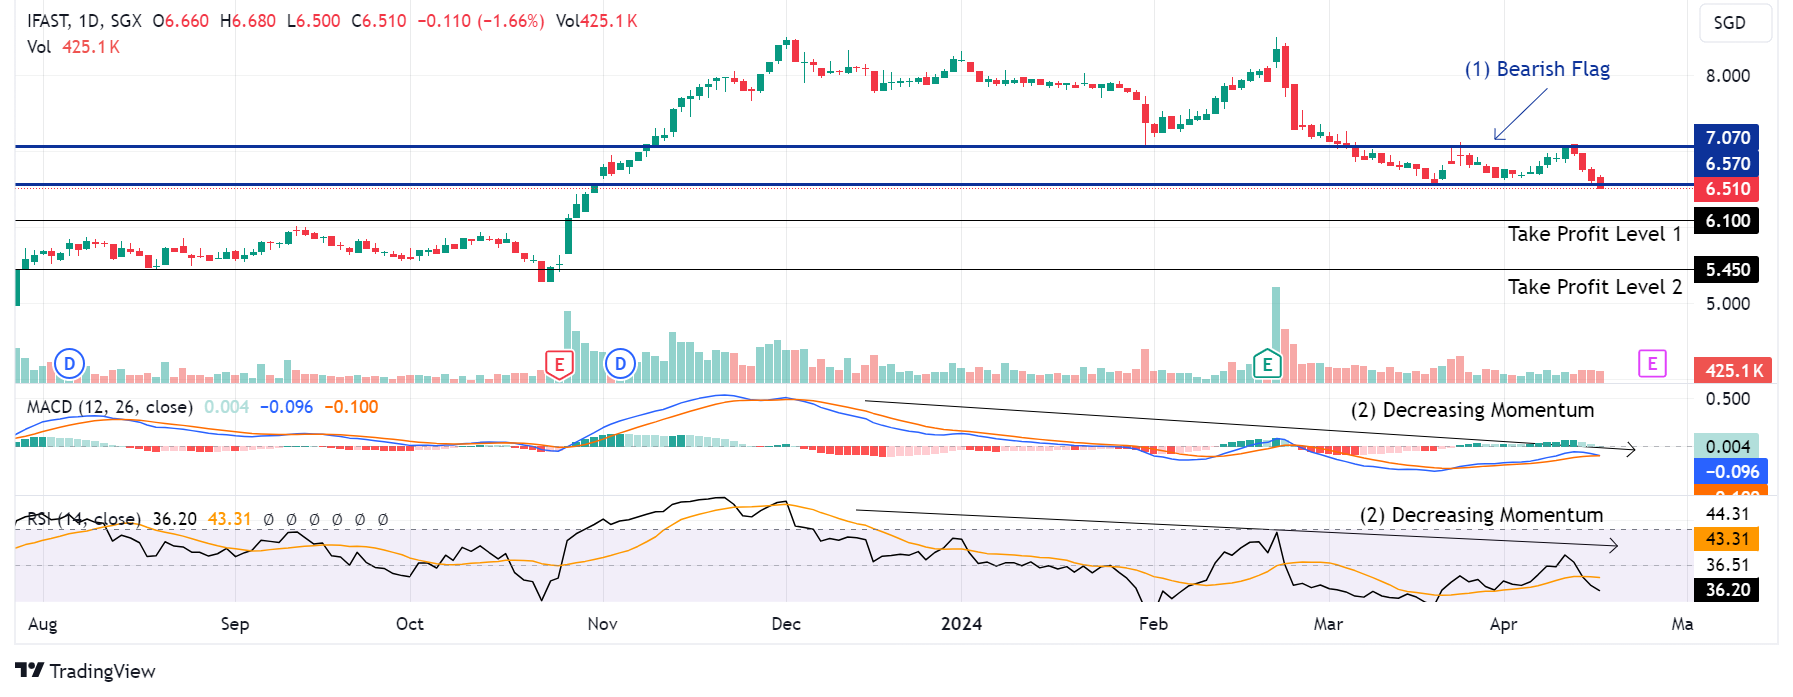 Trade of the Day - iFAST Corporation Ltd (SGX: AIY)
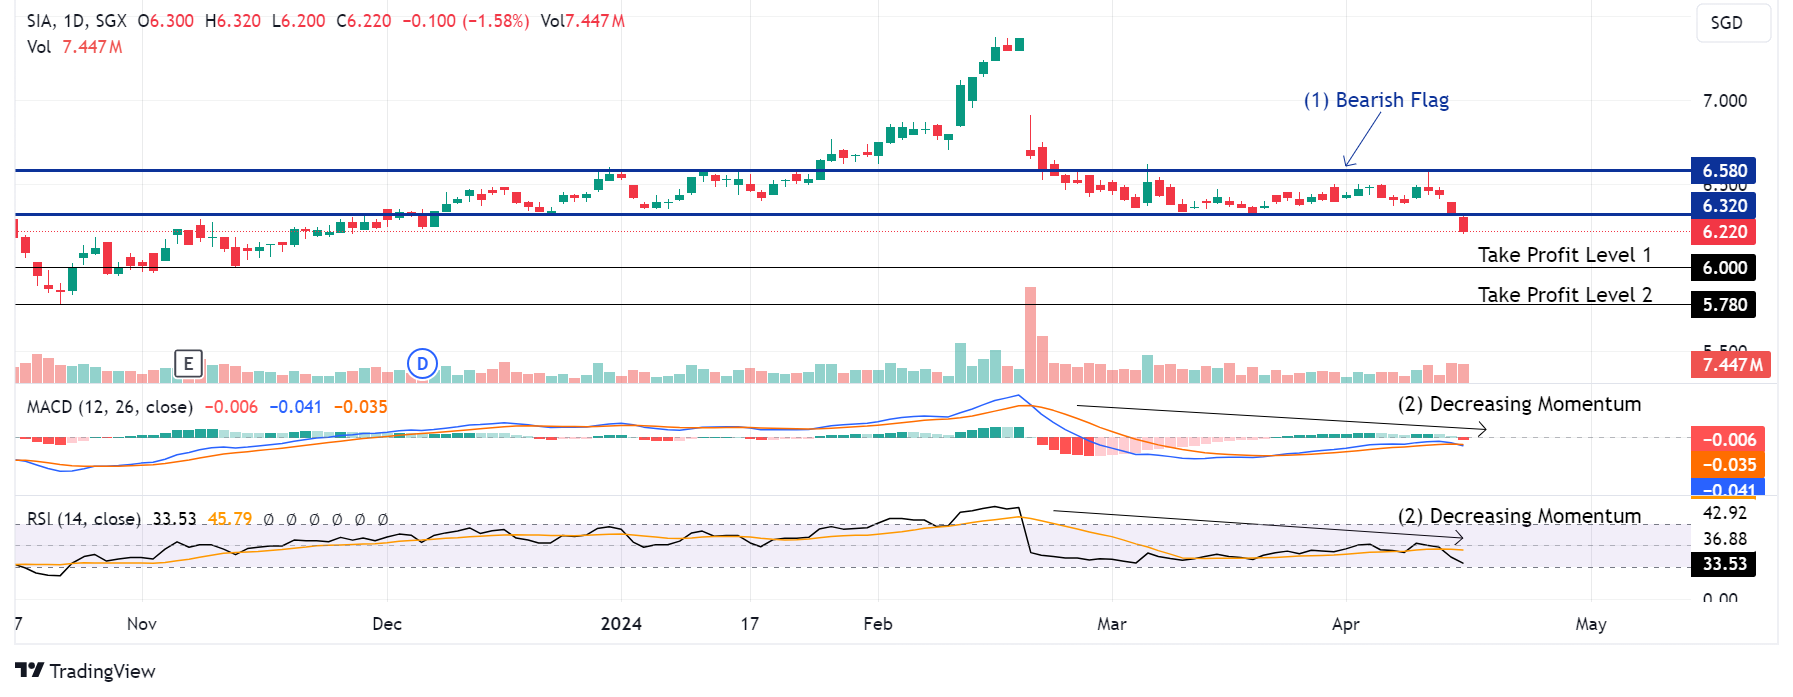 Trade of the Day - Singapore Airlines (SGX: C6L)
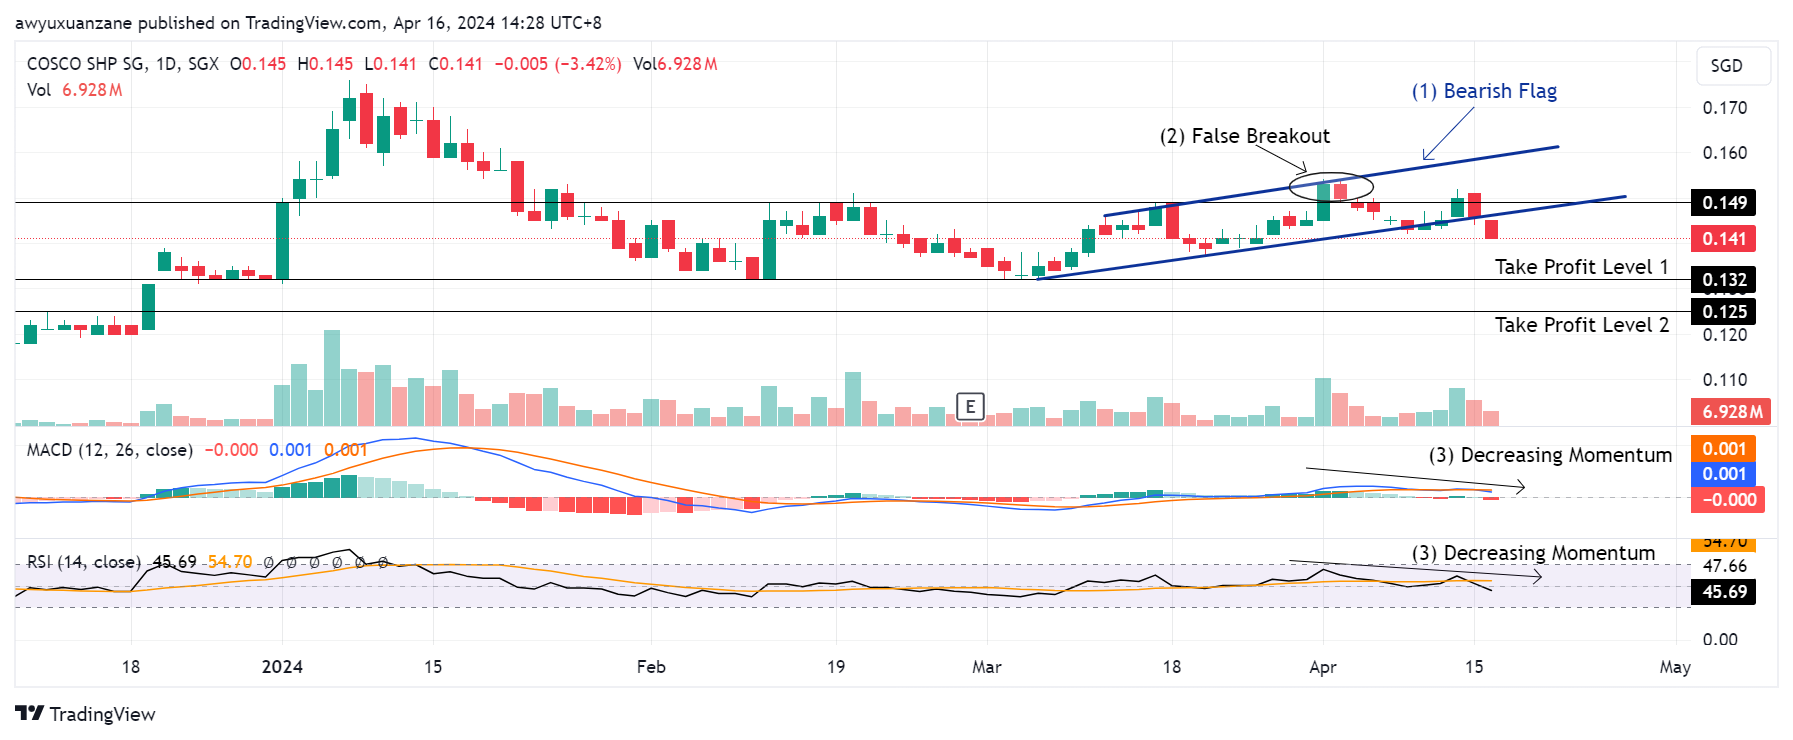 Trade of the Day - COSCO Shipping International (Singapore) Co Ltd (SGX: F83)