ETF Monthly Outlook: Sideways Consolidation Expected Across Most Asset Classes in July 2026 July 6, 2026

Market Overview and Performance Summary
The ETF market landscape presents a mixed picture heading into July 2026, with most major asset classes expected to enter periods of sideways consolidation following varied performance in June. According to the latest monthly analysis, investors should prepare for range-bound trading across several key exchange-traded funds tracking major indices and commodities.
Asset Class Performance Analysis
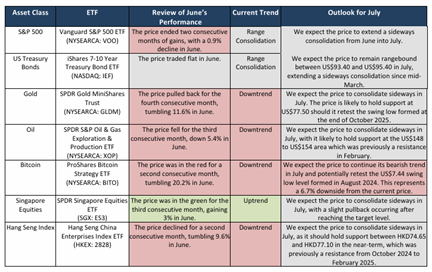
Equities showed divergent trends during June, with the Vanguard S&P 500 ETF (VOO) ending two consecutive months of gains with a 0.9% decline. The fund is expected to extend its sideways consolidation from June into July as markets digest recent moves. In contrast, Singapore equities demonstrated strength, with the SPDR Singapore Equities ETF (ES3) posting its third consecutive monthly gain of 3% in June, though analysts expect consolidation after the ETF reached target levels.
Fixed income markets remained relatively stable, with the iShares 7-10 Year Treasury Bond ETF (IEF) trading flat during June. The bond ETF is anticipated to remain range-bound between US$93.40 and US$95.40 in July, extending a sideways consolidation pattern that has persisted since mid-March.
Commodities faced significant headwinds, particularly in the precious metals sector. The SPDR Gold MiniShares Trust (GLDM) recorded its fourth consecutive monthly decline, tumbling 11.6% in June. Despite this weakness, analysts expect sideways consolidation in July, with support likely to hold at US$77.50 should the price retest the swing low from October 2025.
Energy sector weakness continued, with the SPDR S&P Oil & Gas Exploration & Production ETF (XOP) falling 5.4% in June, marking its third consecutive monthly decline. The ETF is expected to consolidate sideways in July, with support anticipated in the US$148 to US$154 area.
Notable Underperformers
The cryptocurrency space showed particular vulnerability, with the ProShares Bitcoin Strategy ETF (BITO) tumbling 20.2% in June, marking its second consecutive monthly decline. Unlike other asset classes, Bitcoin ETFs are expected to continue their bearish trend in July, potentially retesting the US$7.44 swing low from August 2024, representing a 6.7% downside from current levels.
Asian markets also faced pressure, with the Hang Seng China Enterprises Index ETF (2828) declining 9.6% in June for its second consecutive monthly drop. However, sideways consolidation is expected, with support between HKD$74.65 and HKD$77.10.
Frequently Asked Questions
Q: Which asset classes performed best in June 2026?
A: Singapore equities performed best, with the SPDR Singapore Equities ETF gaining 3% for its third consecutive monthly increase, whilst US Treasury bonds remained flat.
Q: What is the outlook for Bitcoin ETFs in July?
A: Bitcoin ETFs are expected to continue their bearish trend in July, potentially retesting the US$7.44 swing low from August 2024, representing 6.7% downside from current prices.
Q: How long has gold been declining?
A: Gold has pulled back for four consecutive months, with the SPDR Gold MiniShares Trust tumbling 11.6% in June alone.
Q: What support levels are analysts watching for oil ETFs?
A: The oil ETF is expected to hold support in the US$148 to US$154 area, which previously served as resistance in February.
Q: Which asset classes are expected to consolidate sideways in July?
A: Most asset classes including S&P 500, US Treasury bonds, gold, oil, Singapore equities, and the Hang Seng Index are expected to consolidate sideways in July.
Q: What is the expected trading range for US Treasury bond ETFs?
A: The Treasury bond ETF is expected to remain range-bound between US$93.40 and US$95.40 in July, continuing consolidation since mid-March.
Q: How has the S&P 500 ETF performed recently?
A: The Vanguard S&P 500 ETF ended two consecutive months of gains with a 0.9% decline in June and is expected to extend sideways consolidation into July.
Q: What are the key support levels for the Hang Seng ETF?
A: The Hang Seng China Enterprises Index ETF should hold support between HKD74.65 and HKD77.10, levels that previously acted as resistance from October 2024 to February 2025.
This article has been auto-generated using PhillipGPT. It is based on a report by a Phillip Securities Research analyst.
Disclaimer
These commentaries are intended for general circulation and do not have regard to the specific investment objectives, financial situation and particular needs of any person. Accordingly, no warranty whatsoever is given and no liability whatsoever is accepted for any loss arising whether directly or indirectly as a result of any person acting based on this information. You should seek advice from a financial adviser regarding the suitability of any investment product(s) mentioned herein, taking into account your specific investment objectives, financial situation or particular needs, before making a commitment to invest in such products.
Opinions expressed in these commentaries are subject to change without notice. Investments are subject to investment risks including the possible loss of the principal amount invested. The value of units in any fund and the income from them may fall as well as rise. Past performance figures as well as any projection or forecast used in these commentaries are not necessarily indicative of future or likely performance.
Phillip Securities Pte Ltd (PSPL), its directors, connected persons or employees may from time to time have an interest in the financial instruments mentioned in these commentaries.
The information contained in these commentaries has been obtained from public sources which PSPL has no reason to believe are unreliable and any analysis, forecasts, projections, expectations and opinions (collectively the “Research”) contained in these commentaries are based on such information and are expressions of belief only. PSPL has not verified this information and no representation or warranty, express or implied, is made that such information or Research is accurate, complete or verified or should be relied upon as such. Any such information or Research contained in these commentaries are subject to change, and PSPL shall not have any responsibility to maintain the information or Research made available or to supply any corrections, updates or releases in connection therewith. In no event will PSPL be liable for any special, indirect, incidental or consequential damages which may be incurred from the use of the information or Research made available, even if it has been advised of the possibility of such damages. The companies and their employees mentioned in these commentaries cannot be held liable for any errors, inaccuracies and/or omissions howsoever caused. Any opinion or advice herein is made on a general basis and is subject to change without notice. The information provided in these commentaries may contain optimistic statements regarding future events or future financial performance of countries, markets or companies. You must make your own financial assessment of the relevance, accuracy and adequacy of the information provided in these commentaries.
Views and any strategies described in these commentaries may not be suitable for all investors. Opinions expressed herein may differ from the opinions expressed by other units of PSPL or its connected persons and associates. Any reference to or discussion of investment products or commodities in these commentaries is purely for illustrative purposes only and must not be construed as a recommendation, an offer or solicitation for the subscription, purchase or sale of the investment products or commodities mentioned.
This advertisement has not been reviewed by the Monetary Authority of Singapore.
About the author

Zane Aw
Zane Aw is an equity research analyst focused on technical analysis, covering the Singapore, Hong Kong and United States markets. He applied a rules-based approach that incorporate trend-following techniques, price action, momentum oscillators and other indicators to anticipate key inflection points in individual stocks, sectors and broader indices. He graduated from Nanyang Technological University with a Bachelor of Accountancy (Honours).
 Maximizing Retirement Wealth: How to Invest CPF-OA and SRS in SGX ETFs
  ETF Monthly Review: Mixed September Performance with Muted October Outlook Expected
  Investing in the AI Revolution: A Guide to Semiconductor & Ecosystem ETFs
  Phillip SING Income ETF Reaches All-Time High Dividend with Banking Sector Focus