Euronext Paris – The Hidden Gem of Europe November 25, 2022

Table of contents
- Euronext Paris – The Hidden Gem of Europe
- Cotation Assistée en Continu (CAC40)
- Top French Stocks Traded on POEMS
- Euronext Market Hours Guide
Euronext Paris – The Hidden Gem of Europe
According to yourdictionary.com, a hidden gem is defined as “something possessing value or beauty that is not immediately apparent, which therefore has received far less recognition than it deserves”1. While there are many hidden gems abound, this particular one in Europe is not widely known. The France Stock Market, or the Paris Stock Exchange (PAR), contains dozens of famous luxury, fashion, and apparel shares.
On 15 November 2022, PAR overtook the London Stock Exchange (LSE) as the biggest stock market in Europe2. Despite this latest development, many investors are still unsure of what PAR offers. Therefore, this article was written to give you a better understanding of the PAR.
Cotation Assistée en Continu (CAC40)
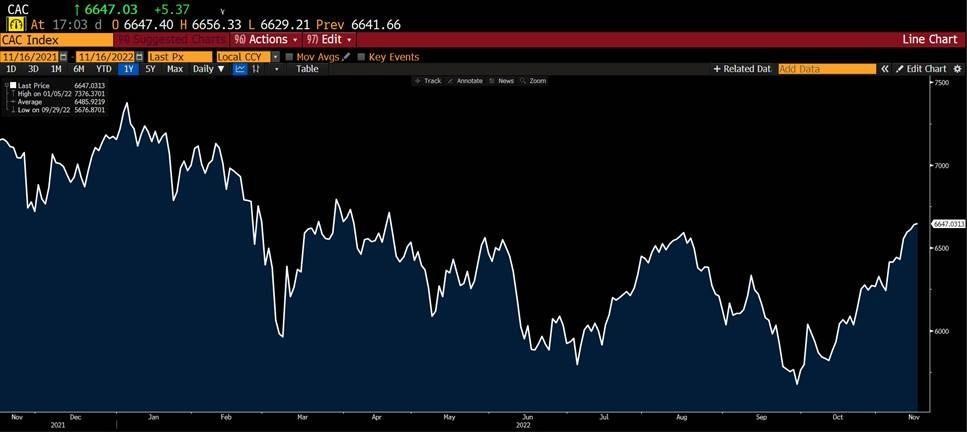
CAC 40 which also means “continuous assisted trading” is the index representing the 40 highest market capitalisation companies on the PAR. Similar to S&P 500 or FTSE 100, CAC40 represents the direction of the market in PAR3. The CAC40 consists of many large companies such as LVMH, Loreal, Kering, Hermes, Airbus, and Safran.
 Source: Bloomberg Last Updated: 16 November 2022
The CAC 40 opened at 7208.73 points at the start of 2022, and is now at 6647.03 points as of 16 November. YTD it has decreased 8.57% and during this economic slowdown, the CAC40 reached its lowest at 5676.87 points and peaked at 7376.37 points.
| Indices | Region | YTD performance |
| CAC40 | France | -8.57% |
| DAX40 | Germany | -10.16% |
| S&P 500 | US | -16.78% |
| HSI | Hong Kong | -21.56% |
| CSI 300 | China | -22.03% |
Source: Bloomberg Last Updated: 16 November 2022
As seen from the table above, despite the slowing economy, the CAC40’s YTD performance has suffered a lower drawdown when compared to its foreign peers. This implies that the CAC40 is more resilient compared to the other major indices.
After the European Central Bank rate hike of 75 basis points earlier last month, the CAC40’s 1-month performance was up 11.36% as of 16 November 20224.
Here are some popular French stocks that are frequently traded by POEMS clients.
Top French stocks traded on POEMs
LVMH Moet Hennessy Louis Vuitton (FP: MC)
Louis Vuitton is a popular French luxury fashion house for luxury bags and leather goods. The growth of LVMH remains at the same pace, as the company’s reported Q3 2022 earnings surpassed analysts’ expectations. Revenue was 56.5 billion euros from Jan 2022 to Sept 2022, up 28% when compared to the same period in 2021. Strong dollar boosts may also have been a factor that increased demand5. In addition, demand in Europe, the US, and Japan was also reported to be up since the start of the year6.
With a P/E ratio of 26.46, LVMH currently has Assets Under Management (AUM) of 351.37 billion euros, the biggest within its relative industry. LVMH has an average Return On Common Equity (ROE) of 29.14%, while the industry average ROE is at 26.21%, indicating that LVMH’s performance is well above the industry average. Currently, LVMH shares are down 4.73% YTD, and the 1-month performance is up 11.62%.
L’Oréal S.A (FP: OR)
L’Oréal is a cosmetics company listed on the PAR. L’Oréal shares fell as the company missed Q3 2022 sales estimates, reporting that business in China was disrupted due to COVID-19 restrictions. However, demand continues to surge elsewhere in Europe, especially in Germany, Spain, and Britain. In addition, L’Oréal remains confident in its outlook for sales and profit for the remainder of 20227.
L’Oréal has a P/E ratio of 34.59 and also has the 2nd biggest AUM amount of 186.41 billion euros within the personal care products industry. While the (ROE) of the industry is at an average of 21%, L’Oréal’s ROE is at 20.09%. The company shares are down 18% YTD, and are currently priced at 348.25 euros per share.
Kering S.A (FP: KER)
The company, listed as one of the CAC40 holdings, is the parent of big brands like Gucci, Saint Laurent, and McQueen. Kering designs and manufactures luxury apparel and accessories. Kering’s earnings exceeded Q3 2022 expectations, and were 23% higher on group revenue, and 14% higher on a Year-on-Year (YOY) comparison basis8.
Currently, Kering has a P/E ratio of 18.51, and an AUM of 551.30 billion euros. In addition, it has an ROE of 29.46% which is slightly above the average ROE of the industry which is at 26.12%. Kering’s YTD performance is down 22.48% and is currently priced at 549.6 euros per share.
Crédit Agricole S.A (FP: ACA)
The company, specialising in investment banking and financial services, also provides insurance and investment products worldwide. The company beat profit and revenue expectations by taking took advantage of rising interest rates9. However, the shares fell after the earnings reports came out, as reported revenue fell on a YoY basis.
With a P/E ratio of 6.15, Crédit Agricole has an AUM of 29.61 billion euros. Its ROE is 7.39% below the industry average ROE of 12.66%. Battling rising inflation and a slowing economy, Crédit Agricole has an YTD performance of -23.09%. However, its 1-month performance is up 9.88%.
TotalEnergies SE (FP: TTE)
Within the oil and gas industry, TotalEnergies operates worldwide, specialising in oil, gas, and renewables energy. TotalEngeries reported a 43% boost in Q3 2022 net income compared when to Q3 2021. TotalEnergies shares remain strong as the company looks to expand oil production. Israel has also signed an initial agreement with TotalEnegies to allow the company to search for natural gas within its maritime borders10.
With the biggest AUM of 150.47 billion euros within PAR’s Oil and Gas industry, TotalEngies has a P/E ratio of 6.72, and an ROE of 32.07%, above the industry ROE of 30.62%. As the energy sector soars in 2022, TotalEngies shares are up 25.35% YTD.
Bloomberg Analysts’ Recommendations
The table below shows the consensus ratings and average ratings of all analysts updated on Bloomberg in the last 12 months. Consensus ratings have been computed by standardising analysts’ ratings from a scale of 1 (Strong Sell) to 5 (Strong Buy). The table also shows several analysts’ recommendations to Buy, Hold or Sell the stocks, as well as their average target prices.
| Security | Consensus Rating | BUY | HOLD | SELL | 12 Mth Target Price (US$) | Upside Potential |
| LVMH Moet Hennessy Louis Vuitton | 4.7 | 32 | 5 | 0 | 769.72 | 10.1% |
| L’Oréal S.A | 3.59 | 12 | 13 | 4 | 366.44 | 6.5% |
| Kering S.A | 4.28 | 21 | 11 | 0 | 624.32 | 15.9% |
| Crédit Agricole S.A | 3.17 | 6 | 13 | 4 | 11.67 | 23.4% |
| TotalEnergies SE | 4.28 | 19 | 9 | 1 | 66.19 | 13.0% |
Source: Bloomberg Last Updated: 16 November 2022
Euronext Market Hours Guide
Euronext is a pan-European stock exchange and market infrastructure, currently, POEMS offers 4 markets under Euronext namely, France, Netherlands, Belgium, and Portugal. By trading with POEMS, clients have access to various exchanges. The market timing for trading is shown in the table below.
| Country | Exchange | DST (Singapore Time) | Non-DST (Singapore Time) |
| France | Euronext | 03:00pm – 11:30pm | 04:00pm – 12:30pm |
| Netherlands | Euronext | 03:00pm – 11:30pm | 04:00pm – 12:30pm |
| Belgium | Euronext | 03:00pm – 11:30pm | 04:00pm – 12:30pm |
| Portugal | Euronext | 03:00pm – 11:30pm | 04:00pm – 12:30pm |
Markets will be available for trading from Monday to Friday, feel free to refer back to the table for Daylight Saving Time (DST) and Non-Daylight Saving Time (Non-DST) trading hours.
For more information, visit the POEMS website or contact our experienced trading representatives for help.
Reference:
- [1] Best 2 Definitions of Hidden-gem
- [2] “London loses crown of biggest European stock market to Paris.” 14 Nov. 2022
- [3] Paris Stock Exchange (PAR) Definition – Investopedia
- [4] “European markets close higher after record ECB rate hike – CNBC.” 9 Sep. 2022
- [5] “LVMH sales jump as strong dollar boosts Europe demand – Reuters.” 11 Oct. 2022
- [6] “Growth continues at the same pace – LVMH.” 11 Oct. 2022
- [7] “L’Oreal Shares Fall As Luxury Products Unit Misses Q3 Sales ….” 21 Oct. 2022
- [8] “Very solid revenue growth in the third quarter of 2022 – Kering.” 20 Oct. 2022
- [9] “Very solid revenue growth in the third quarter of 2022 – Kering.” 20 Oct. 2022
- [10] “Israel allows TotalEnergies, Eni to search for gas offshore … – Reuters.” 15 Nov. 2022
Disclaimer
These commentaries are intended for general circulation. It does not have regard to the specific investment objectives, financial situation and particular needs of any person who may receive this document. Accordingly, no warranty whatsoever is given and no liability whatsoever is accepted for any loss arising whether directly or indirectly as a result of any person acting based on this information. Opinions expressed in these commentaries are subject to change without notice. Investments are subject to investment risks including the possible loss of the principal amount invested. The value of the units and the income from them may fall as well as rise. Past performance figures as well as any projection or forecast used in these commentaries are not necessarily indicative of future or likely performance. Phillip Securities Pte Ltd (PSPL), its directors, connected persons or employees may from time to time have an interest in the financial instruments mentioned in these commentaries. Investors may wish to seek advice from a financial adviser before investing. In the event that investors choose not to seek advice from a financial adviser, they should consider whether the investment is suitable for them.
The information contained in these commentaries has been obtained from public sources which PSPL has no reason to believe are unreliable and any analysis, forecasts, projections, expectations and opinions (collectively the “Research”) contained in these commentaries are based on such information and are expressions of belief only. PSPL has not verified this information and no representation or warranty, express or implied, is made that such information or Research is accurate, complete or verified or should be relied upon as such. Any such information or Research contained in these commentaries are subject to change, and PSPL shall not have any responsibility to maintain the information or Research made available or to supply any corrections, updates or releases in connection therewith. In no event will PSPL be liable for any special, indirect, incidental or consequential damages which may be incurred from the use of the information or Research made available, even if it has been advised of the possibility of such damages. The companies and their employees mentioned in these commentaries cannot be held liable for any errors, inaccuracies and/or omissions howsoever caused. Any opinion or advice herein is made on a general basis and is subject to change without notice. The information provided in these commentaries may contain optimistic statements regarding future events or future financial performance of countries, markets or companies. You must make your own financial assessment of the relevance, accuracy and adequacy of the information provided in these commentaries.
Views and any strategies described in these commentaries may not be suitable for all investors. Opinions expressed herein may differ from the opinions expressed by other units of PSPL or its connected persons and associates. Any reference to or discussion of investment products or commodities in these commentaries is purely for illustrative purposes only and must not be construed as a recommendation, an offer or solicitation for the subscription, purchase or sale of the investment products or commodities mentioned.
About the author
Thng Xiao Xiong
UK Equity Dealer
Xiao Xiong is an executive in the Global Markets Team specializing in UK markets. He is a graduate from Singapore Institute of Technology with a bachelor's in Aircraft System Engineering. He has a strong interest in macroeconomics and options strategies.

 Back in Business: The Return of IPOs & Top Traded Counters in March 2024
  From $50 to $100: Unveiling the Impact of Inflation
  How to soar higher with Positive Carry!
  Why 2024 Offers A Small Window of Opportunity and How to Position Yourself to Capture It


