Exploring a Potential Stock in the Healthcare Industry April 4, 2023
Bankruptcy crisis of Silicon Valley Bank
On 10 March 2023, Silicon Valley Bank (SVB), which had US$212bn of assets, collapsed with spectacular speed, making it the biggest lender to collapse since the global financial crisis of 2007-09. As soon as news broke that SVB was late in returning depositors’ funds, a classic bank run began, affecting the banking industry and the stock market. The US guaranteed all deposits following the Silicon Valley Bank collapse, as President Joe Biden promised action and the US Fed increased market liquidity by creating a new Bank Term Lending Programme to prevent the bankruptcy crisis from spreading to other banks. The stock market appeared stable after regulators implemented urgent measures to avert a financial collapse. However, the stock market has become extremely sensitive since SBV’s bankruptcy and is likely to cause a market crash upon receiving any negative news.
Moreover, the economy is facing an increased probability of a recession following the collapse of the Silicon Valley Bank and Signature Bank. If a recession were to occur, it would result from a combination of factors, including a credit freeze, job losses, and a decline in consumer spending. The effects of the recession would be felt not only in the US but also globally. Consequently, the stock market is expected to be more volatile and unstable in the coming months.
Defensive industry
The failure of the top 16 banks in the US would have a ripple effect on other industries and companies. In such a scenario, defensive stocks become an important consideration as they are often viewed as more resilient to economic downturns and market turbulence.
Defensive stock refers to companies that provide goods and services that people continue to use even during tough economic times, such as food, utilities, and healthcare. These companies are often less affected by economic cycles and market volatility than companies in other sectors, such as technology or consumer discretionary.
Investors may turn to defensive stocks during times of economic uncertainty or market turbulence because they offer some level of stability and safety. With the failure of the banks in the US, investors could shift their focus to defensive stocks as a way to weather the storm. While no investment is completely immune to market volatility, defensive stocks provide a degree of protection against the worst effects of an economic downturn.
Among the defensive stocks, I believe that the healthcare industry presents more opportunities and better prospects . This industry is often regarded as defensive due to the fact that healthcare services are a necessity regardless of the state of the economy. In economic downturns, people still require medical care, prescription drugs, and other healthcare services, maintaining a relatively stable demand for healthcare products and services. This stability makes the healthcare industry less susceptible to the cyclical nature of business. Additionally, the ageing population is expected to increase the demand for healthcare services, making the industry more attractive to investors in the long term. As people age, they tend to require more medical attention, medications, and specialised care, all of which contribute to the growth of the healthcare industry.
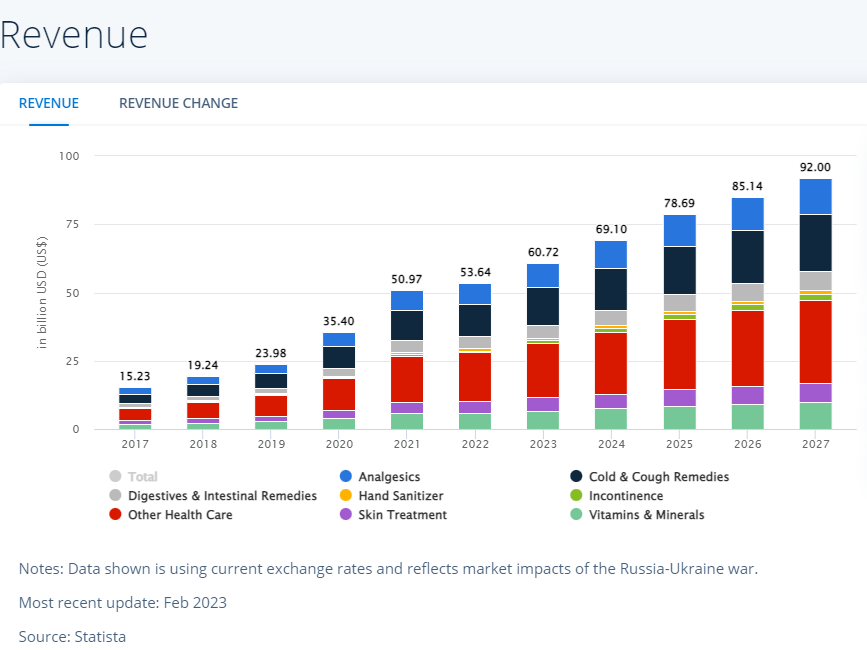
Source: https://www.statista.com/outlook/dmo/ecommerce/beauty-health-personal-household-care/health-care/worldwide#revenue [1]
The healthcare industry offers attractive defensive characteristics and long-term growth potential for investments. According to Statista, the Health Care segment is projected to reach a revenue of US$60.72bn in 2023, with a compound annual growth rate (CAGR) of 10.95%, resulting in a market volume of US$92.01bn by 2027.The projected growth of the healthcare industry presents an optimistic outlook for investors seeking long-term growth opportunities in a stable and defensive sector.
UnitedHealth Group: A Leading Player in the Healthcare Industry
UnitedHealth Group, Inc. is a provider of health care coverage, software, and data consultancy services. As the largest health insurance company in the world, it operates in two primary business segments: UnitedHealthcare Group, which offers health insurance to individuals and employer groups and Optum, which provides healthcare services and information technology solutions. UnitedHealthcare boasts a strong financial position, with a market capitalisation of over US$400 billion as of March 2023. It has consistently delivered growth in earnings and revenue over the past several years. Moreover, UnitedHealth Group has a diverse business model, with operations in multiple segments of the healthcare industry.
Investors may find UnitedHealth Group an appealing option for various reasons. The company boasts a stable and expanding business model, with a considerable presence in the healthcare industry. Its robust financial position and earnings growth potential make it a potentially reliable source of long-term returns for investors.
A Market leader in the industry
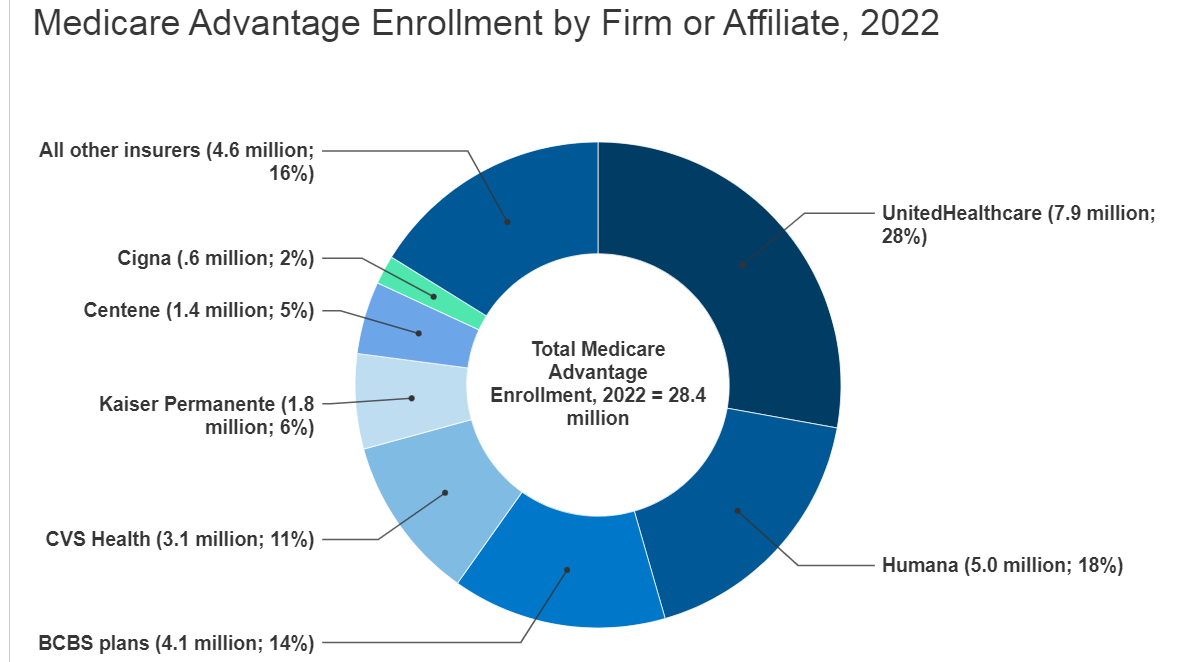
[2]https://www.kff.org/medicare/issue-brief/medicare-advantage-in-2022-enrollment-update-and-key-trends/
In the health insurance segment, UnitedHealth Group has a strong market position and is considered an industry leader due to its size, scale, and focus on innovation. This market dominance is driven by the company’s cost management and innovation strategies, as well as its strong financial position and earnings growth. UnitedHealth Group’s Optum subsidiary is also a major player in the healthcare services segment, offering a wide range of healthcare services and analytics. Its market share has been growing as the company expands its offerings and acquires new businesses.
| 2016 | 2017 | 2018 | 2019 | 2020 | 2021 | 2022 | |
| Total revenue (US$) | 84.84B | 201.16B | 226.25B | 242.16B | 257.14B | 287.60B | 324.16B |
| 17.65% | 8.83% | 12.47% | 7.03% | 6.19% | 11.84% | 12.71% | |
| Net income(US$) | 7.02B | 10.56B | 11.99B | 13.84B | 15.40B | 17.29B | 20.12B |
| 20.71% | 50.46% | 13.53% | 15.46% | 11.30% | 12.22% | 16.40% |
Based on the data presented, UnitedHealth Group (NYSE: UNH) has demonstrated steady revenue growth over the years. Its revenue increased from US$184.84B in 2016 to US$324.16B in 2022, representing a compound annual growth rate (CAGR) of approximately 21.11%. The company’s net income has also consistently increased over the same period, with a CAGR of approximately 16.23% from 2016 to 2022, rising from 7.02B to 20.12B. Notably, UnitedHealth Group’s net income growth has been particularly strong in recent years, with double-digit percentage increases in each of the past six years.
Overall, these figures suggest that UnitedHealth Group has been performing well financially, sustaining strong revenue and net income growth over the years. This positive performance is a promising indicator of the company’s future prospects.
| 2016 | 2017 | 2018 | 2019 | 2020 | 2021 | 2022 | |
| Revenue | |||||||
| Year Over Year | 17.66% | 8.76% | 12.36% | 6.85% | 6.4% | 11.59% | 12.92% |
| 3-Year Average | 14.76% | 15.56% | 12.87% | 9.3% | 8.5% | 8.25% | 10.27% |
| 5-Year Average | 12.7% | 12.73% | 13.06% | 13.12% | 10.33% | 9.16% | 9.99% |
| 10-Year Average | 10.04% | 10.25% | 10.83% | 10.67% | 10.58% | 10.9% | 11.35% |
Based on the revenue growth figures, UnitedHealth Group (NYSE: UNH) is currently experiencing a year-over-year growth rate of 12.92%, which exceeds the 3-year, 5-year, and 10-year average growth rates of 10.27%, 9.99%, and 11.35%, respectively.
This suggests that the company’s recent performance has been strong, and that it is currently growing at a faster rate than it has in the recent past. Additionally, the solid 10-year average growth rate indicates that UnitedHealth Group has a proven long-term track record of growth.
Having a good long-term track record of revenue growth can be a positive indicator of a company’s financial health and long-term prospects. This is because it suggests that UnitedHealth Group’s products and services are in demand, and the company has been successful in meeting the needs of its customers. As a result, the company is well-positioned to continue to grow its revenue over the long term. Consistent revenue growth can also suggest that the company has a strong management team that is able to make strategic decisions and execute plans effectively. Overall, a strong long-term revenue growth track record is a positive sign for investors as it indicates that the company is well-positioned to continue growing and creating value for its stakeholders.
| 2016 | 2017 | 2018 | 2019 | 2020 | 2021 | 2022 | |
| Basic earnings per share (Basic EPS) | 7.37 | 10.95 | 12.45 | 14.55 | 16.23 | 18.33 | 21.47 |
| 20.84% | 48.59% | 13.64% | 16.92% | 11.54% | 12.93% | 17.15% | |
| Diluted Earnings per Share (Diluted EPS) | 7.25 | 10.72 | 12.19 | 14.33 | 16.03 | 18.08 | 21.18 |
| 20.59% | 47.87% | 13.76% | 17.49% | 11.88% | 12.81% | 17.14% |
Based on the data, it is evident that UnitedHealth Group’s Basic EPS and Diluted EPS have been consistently increasing over the years. This is a positive sign for investors, as it suggests that the company has been generating more earnings per share over time. In turn, this could potentially lead to higher stock prices, as investors may be willing to pay more for shares of a company that is generating higher earnings.
The year-over-year increases in Basic EPS and Diluted EPS are indicators of UnitedHealth Group’s success in growing its earnings in recent years. The consistency of growth rates for both Basic and Diluted EPS suggests that the company has been able to maintain a steady pace of earnings growth. This is a positive sign for investors, as it indicates that the company has been successful in generating more earnings per share over time, potentially increasing the value of the stock and leading to higher stock prices.
| 2016 | 2017 | 2018 | 2019 | 2020 | 2021 | 2022 | |
| Return on assets | 5.94% | 7.94% | 8.12% | 8.36% | 8.16% | 8.30% | 8.63% |
| Return on equity | 19.46% | 24.54% | 24.10% | 25.32% | 25.02% | 25.19% | 26.91% |
Based on the Return on Assets (ROA) and Return on Equity (ROE) figures for UnitedHealth Group, it appears that the company has been consistently profitable in recent years, with both measures showing an upward trend. A high ROA indicates a high level of operational efficiency, with the company generating more profits with its assets. In this case, the ROA of UnitedHealth Group has steadily increased from 5.94% in 2016 to 8.63% in 2022, suggesting that the company has become more efficient in using its assets to generate profits.
Conversely, Return on Equity (ROE) illustrates how well a company is generating returns for its shareholders. The ROE of UnitedHealth Group has surged from 19.46% in 2016 to 26.91% in 2022, signifying that the company has been able to generate more profits using shareholder equity.
Overall, these figures suggest that UnitedHealth Group has been performing well in recent years, both in terms of its operational efficiency and its ability to generate returns for its shareholders.
| Solvency ratios | 2016 | 2017 | 2018 | 2019 | 2020 | 2021 | 2022 |
| Debt to assets ratio | 0.29 | 0.25 | 0.27 | 0.25 | 0.24 | 0.23 | 0.25 |
| Debt to equity ratio | 0.93 | 0.74 | 0.80 | 0.77 | 0.74 | 0.70 | 0.80 |
| Long term debt to total assets ratio | 0.22 | 0.23 | 0.25 | 0.23 | 0.21 | 0.21 | 0.23 |
| Long term debt to total equity ratio | 0.70 | 0.61 | 0.68 | 0.64 | 0.61 | 0.60 | 0.68 |
UnitedHealth Group’s decreasing trend in its debt to assets ratio and debt to equity ratio is a positive sign for investors and stakeholders as it indicates a reduced financial risk for the company. By relying less on debt to finance its operations, the company is reducing its exposure to interest rate fluctuations and potential liquidity issues. This trend also shows that the company is managing its financial resources efficiently and is in a strong financial position. The stable trend in UnitedHealth Group’s long-term debt to total assets and long-term debt to total equity ratios further reinforces the company’s financial stability. The fluctuations in these ratios may be attributed to changes in the company’s financial strategies or market conditions. However, the overall stability of these ratios suggests that the company’s long-term debt is well-managed, and its operations are well-funded.
During this high interest rate environment, it is crucial to monitor a company’s debt ratio and ensure that it is managing it effectively. This can help prevent any unexpected negative events from occurring in the company you have invested in. In this context, UnitedHealth Group’s healthy debt ratio makes it a suitable defensive company to invest in during this uncertain environment.
In conclusion, UnitedHealth Group (NYSE: UNH) is an established and innovative healthcare company that is poised for future growth and success. Its dominance in both health insurance and healthcare services, along with its financial strength and innovation, make it an attractive investment opportunity for those seeking exposure to the healthcare industry.
Promotion
POEMS CFD MT5 Welcome Gifts and Bundles

From 1 March 2023 to 30 June 2023 (both dates inclusive), open a POEMS CFD MT5 account and trade with us to enjoy Apple Airpods, Trading Credits and Grab Vouchers.
This promotion is valid to all Phillip Securities Pte Ltd (PSPL) customers who have not opened a POEMS CFD MT5 Account.
*T&Cs Apply.
For more information, click here.
How to get started with POEMS
As the pioneer of Singapore’s online trading, POEMS’s award-winning suite of trading platforms offers investors and traders more than 40,000 financial products across global exchanges.
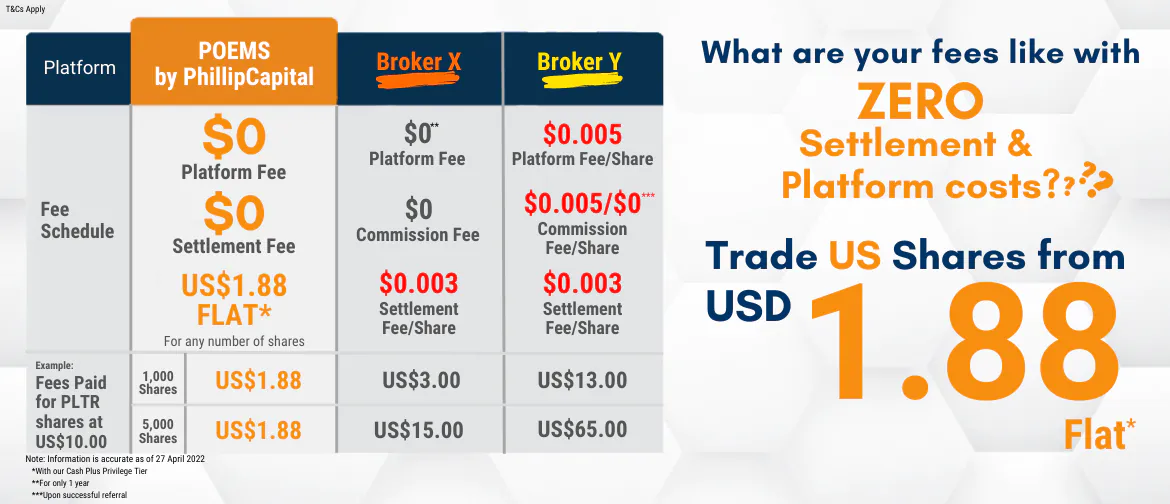
Explore an array of US shares with brokerage fees as low as US$1.88 flat* when you open a Cash Plus Account with us today. Find out more here (terms and conditions apply).
We hope that you have found value reading this article. If you do not have a POEMS account, you may visit here to open one with us today.
Lastly, investing in a community is much more fun. You will get to interact with us and other seasoned investors who are generous in sharing their knowledge, experience and expertise.
In this community, you will have access to quality educational materials, stock analysis to help you apply the concepts and insights from seasoned investors.
We look forward to sharing more insights with you in our growing and enthusiastic Telegram community. Join us now!
For enquiries, please email us at cfd@phillip.com.sg
Reference:
- [1] “https://www.statista.com/outlook/dmo/ecommerce/beauty-health-personal-household-care/health-care/worldwide#revenue
- [2] “https://www.kff.org/medicare/issue-brief/medicare-advantage-in-2022-enrollment-update-and-key-trends/
- [3] “https://www.ibisworld.com/us/company/unitedhealth-group-incorporated/10050/#:~:text=Unitedhealth%20Group%20Incorporated%20%2D%20Overview&text=Their%20largest%20market%20share%20is,growth%20compared%20to%20their%20peers.
Disclaimer
These commentaries are intended for general circulation. It does not have regard to the specific investment objectives, financial situation and particular needs of any person who may receive this document. Accordingly, no warranty whatsoever is given and no liability whatsoever is accepted for any loss arising whether directly or indirectly as a result of any person acting based on this information. Opinions expressed in these commentaries are subject to change without notice. Investments are subject to investment risks including the possible loss of the principal amount invested. The value of the units and the income from them may fall as well as rise. Past performance figures as well as any projection or forecast used in these commentaries are not necessarily indicative of future or likely performance. Phillip Securities Pte Ltd (PSPL), its directors, connected persons or employees may from time to time have an interest in the financial instruments mentioned in these commentaries. Investors may wish to seek advice from a financial adviser before investing. In the event that investors choose not to seek advice from a financial adviser, they should consider whether the investment is suitable for them.
The information contained in these commentaries has been obtained from public sources which PSPL has no reason to believe are unreliable and any analysis, forecasts, projections, expectations and opinions (collectively the “Research”) contained in these commentaries are based on such information and are expressions of belief only. PSPL has not verified this information and no representation or warranty, express or implied, is made that such information or Research is accurate, complete or verified or should be relied upon as such. Any such information or Research contained in these commentaries are subject to change, and PSPL shall not have any responsibility to maintain the information or Research made available or to supply any corrections, updates or releases in connection therewith. In no event will PSPL be liable for any special, indirect, incidental or consequential damages which may be incurred from the use of the information or Research made available, even if it has been advised of the possibility of such damages. The companies and their employees mentioned in these commentaries cannot be held liable for any errors, inaccuracies and/or omissions howsoever caused. Any opinion or advice herein is made on a general basis and is subject to change without notice. The information provided in these commentaries may contain optimistic statements regarding future events or future financial performance of countries, markets or companies. You must make your own financial assessment of the relevance, accuracy and adequacy of the information provided in these commentaries.
Views and any strategies described in these commentaries may not be suitable for all investors. Opinions expressed herein may differ from the opinions expressed by other units of PSPL or its connected persons and associates. Any reference to or discussion of investment products or commodities in these commentaries is purely for illustrative purposes only and must not be construed as a recommendation, an offer or solicitation for the subscription, purchase or sale of the investment products or commodities mentioned.
About the author
Ren Jack Lee, Dealing
Jack Lee graduated from the University of Nottingham with a Bachelor’s degree in Business Economics and Finance. Companies with unique business models excite him. He is highly passionate about sharing his findings to help clients benefit from long-term high growth stocks. Thus, he is always on the hunt for stocks with value and potential for high growth.

 Back in Business: The Return of IPOs & Top Traded Counters in March 2024
  From $50 to $100: Unveiling the Impact of Inflation
  How to soar higher with Positive Carry!
  Why 2024 Offers A Small Window of Opportunity and How to Position Yourself to Capture It


