Go Global – Investing Around The World April 15, 2019

Part 1. Why?
Why do you trade? To make money I hope.
But where do you trade? Our data on YOUR trading behaviour suggests that YOU suffer from a home country bias. Majority of you trade only on the Singapore stock exchange at SGX!
Recently, I celebrated a birthday (not mine) with an upscale international buffet. The buffet prides itself on its plethora of international selections, and goes further to offer different themed nights on a daily basis so consumers may enjoy a different culinary experience with each visit.
Then it dawned upon me. If I were the one dining, how should I eat? And what should I eat? This introduces the economic concept of utility maximization:
How can I derive the greatest satisfaction (pocket or belly-wise) with the given time constraint and absolute amount of food I can possibly eat in one trip?
Buffet veterans will probably suggest wearing loose clothing; avoiding carbs like rice or noodles; or drinking less water. Only eat the good and expensive stuff. Beef, crabs, lobsters and finish off with desserts. This should give us the most bang for our dollar. Utility maximized.
Do we approach our investments in the same way though?
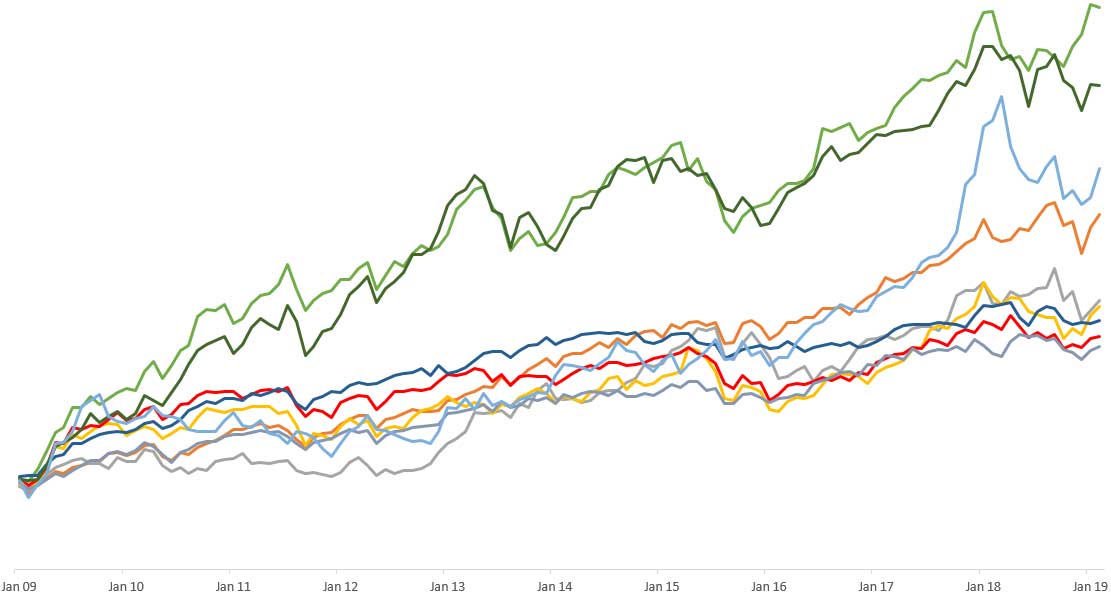
The following chart plots the performance of nine World Equity Indices over a ten-year period.
Take a guess: Which line is the Singapore Straits Times Index (STI)?

Answer: While all the Indices grew and all your investments would have made money, STI (red line) performance ranks 2nd from the bottom!
| Country | Index | CAGR | Std Dev | Risk Adj Return |
| Indonesia | JCI | 19.23% | 28.27% | 0.68% |
| Thailand | SET | 17.41% | 25.33% | 0.69% |
| Vietnam | VNI | 14.76% | 24.34% | 0.61% |
| United States | SPX | 13.11% | 10.96% | 1.20% |
| Japan | N225 | 10.43% | 20.38% | 0.51% |
| Malaysia | KLCI | 10.36% | 15.37% | 0.67% |
| Hong Kong | HSI | 9.80% | 22.06% | 0.44% |
| Singapore | STI | 9.17% | 23.22% | 0.40% |
| United Kingdom | UKX | 8.55% | 10.89% | 0.79% |
Only the UK:UKX FTSE 100 performed worse than the STI index at 0.62% lower returns per year. If the returns were adjusted for risk, the STI would have performed the worst! Investors are only compensated with 0.4% of returns per unit of risk held!
This brings us back to our opening statement: Why do you trade?
If your answer is the same as mine – to make money, then we suggest:
Why not approach your investments as you would with an international buffet spread?
We understand that some of us are conservatives and we like local – preferring a hearty well-known local breakfast to start the day, while dabbling in household blue-chips such as DBS, Singtel or CapitaLand. One way or another, both your choice of breakfast and investments will almost never go wrong.
But if you have the appetite, going foreign brings about its benefits:
Global Diversification
You would have probably heard of this phrase: “Diversification is the only free lunch in the world”.
The idea is simple. Different stocks each have a unique risk factor. A handful of stocks held together in a portfolio, each drifting in different directions should cancel out each other’s “unique risk” and make your small portfolio behave more “market-like”.
A study by Fisher and Loire in 1970 [1] suggests that a portfolio of just 30 stocks reduces its standard deviation down to that comparable to the Russell 3000 Index (consisting of its namesake 3000 stocks)!
BUT even if you hold 30 eggs (highly correlated positions) in one basket (STI), if one day someone comes along and trips the basket (e.g. financial crisis in Singapore), what happens to your eggs and your holdings? Are you truly diversified?
To know and measure the effects of diversification (or di-worse-sification), we consider its Correlation, which ranges from +1 (perfect synchronization) to 0 (no relation) to -1 (perfectly opposite movement).
| Correlation | Meaning |
| +1 | Moves in perfect syncronization |
| 0 | No relation |
| -1 | Moves perfectly opposite of each other |
To improve returns, reduce risk or improve risk adjusted returns, mix and match combinations of portfolios, holdings or Indices with close to zero correlation to each other to get better results.
Here are the correlation of various World Equity Indices with each other:
| SPX | N225 | HSI | STI | JCI | KLCI | UKX | SET | VNI | |
|---|---|---|---|---|---|---|---|---|---|
| SPX | 1 | 0.62 | 0.69 | 0.67 | 0.54 | 0.46 | 0.79 | 0.51 | 0.46 |
| N225 | 1 | 0.46 | 0.48 | 0.35 | 0.26 | 0.45 | 0.36 | 0.31 | |
| HSI | 1 | 0.82 | 0.57 | 0.53 | 0.63 | 0.61 | 0.47 | ||
| STI | 1 | 0.69 | 0.58 | 0.62 | 0.66 | 0.50 | |||
| JCI | 1 | 0.57 | 0.52 | 0.71 | 0.32 | ||||
| KLCI | 1 | 0.46 | 0.54 | 0.19 | |||||
| UKX | 1 | 0.54 | 0.34 | ||||||
| SET | 1 | 0.33 | |||||||
| VNI | 1 |
A 50/50 combination of the Indices with the lowest correlation with each other – VNI/KLCI, N225/KLCI and N225/VNI produces the following results.
| Index | CAGR | Std Dev | Risk Adj Return | Correl |
| VNI | 14.76% | 24.34% | 0.61% | 0.19 |
| KLCI | 10.36% | 15.37% | 0.67% | |
| VNI & KLCI | 13.30% | 18.69% | 0.71% |
| Index | CAGR | Std Dev | Risk Adj Return | Correl |
| N225 | 10.43% | 20.38% | 0.51% | 0.26 |
| KLCI | 10.36% | 15.37% | 0.67% | |
| N225 & KLCI | 10.88% | 14.46% | 0.75% |
| Index | CAGR | Std Dev | Risk Adj Return | Correl |
| N225 | 10.43% | 20.38% | 0.51% | 0.31 |
| VNI | 14.76%% | 24.34% | 0.61% | |
| N225 & VNI | 13.44% | 20.34% | 0.67% |
In all three cases, Risk Adjusted Returns were better compared to if each index was to be held alone.
Eat some Vietnamese Pho then drink some Penang Chendol. Weird combination, but it works.
The Singaporean “Rojak” Portfolio
Suppose you are holding on to some Singaporean staples (purchased through Central Provident Fund – CPF or otherwise) and don’t wish to liquidate, you can simply add some other flavouring into the mix:
We present four simple examples:
a. For the conservatives seeking low Standard Deviation, put an equal weightage (20%) into each of the Developed Markets (US, JP, HK, SG and UK). This also provides for good geolocation diversification.
| Index | CAGR | Std Dev | Risk Adj Return |
| Developed Markets | 10.66% | 14.76% | 0.72% |
b. The aggressive investors focusing on absolute returns can construct a mixture of South East Asian indices (HK, SG, Indo, MY, Thai, Viet)
| Index | CAGR | Std Dev | Risk Adj Return |
| South East Asian | 14.10% | 21.26% | 0.66% |
If you have noticed the high correlation between HK and SG (0.82), you can even opt to remove HK from the mix. For both conservative and aggressive portfolios, it either increases returns, lowers risk, improves the risk adjusted return or achieves all three! This truly shows the benefits of diversification and the important role correlation plays in achieving diversification benefits.
| Index | CAGR | Std Dev | Risk Adj Return |
| Developed Markets less HK | 10.71% | 13.56% | 0.79% |
| South East Asian Markets less HK | 14.84% | 21.45% | 0.69% |
Reference:
- [1] Some studies of variability of returns on investments in common stocks, Lawrence Fisher and James H. Lorie, The Journal of Business, Vol. 43, No. 2 (Apr., 1970), pp. 99-134
Disclaimer
All data presented are from Phillip CFD and accurate as of end February 2019. All foreign indices are represented in their respective local currencies.
These commentaries are intended for general circulation. It does not have regard to the specific investment objectives, financial situation and particular needs of any person who may receive this document. Accordingly, no warranty whatsoever is given and no liability whatsoever is accepted for any loss arising whether directly or indirectly as a result of any person acting based on this information. Opinions expressed in these commentaries are subject to change without notice. Investments are subject to investment risks including the possible loss of the principal amount invested. The value of the units and the income from them may fall as well as rise. Past performance figures as well as any projection or forecast used in these commentaries are not necessarily indicative of future or likely performance. Phillip Securities Pte Ltd (PSPL), its directors, connected persons or employees may from time to time have an interest in the financial instruments mentioned in these commentaries. Investors may wish to seek advice from a financial adviser before investing. In the event that investors choose not to seek advice from a financial adviser, they should consider whether the investment is suitable for them.
The information contained in these commentaries has been obtained from public sources which PSPL has no reason to believe are unreliable and any analysis, forecasts, projections, expectations and opinions (collectively the “Research”) contained in these commentaries are based on such information and are expressions of belief only. PSPL has not verified this information and no representation or warranty, express or implied, is made that such information or Research is accurate, complete or verified or should be relied upon as such. Any such information or Research contained in these commentaries are subject to change, and PSPL shall not have any responsibility to maintain the information or Research made available or to supply any corrections, updates or releases in connection therewith. In no event will PSPL be liable for any special, indirect, incidental or consequential damages which may be incurred from the use of the information or Research made available, even if it has been advised of the possibility of such damages. The companies and their employees mentioned in these commentaries cannot be held liable for any errors, inaccuracies and/or omissions howsoever caused. Any opinion or advice herein is made on a general basis and is subject to change without notice. The information provided in these commentaries may contain optimistic statements regarding future events or future financial performance of countries, markets or companies. You must make your own financial assessment of the relevance, accuracy and adequacy of the information provided in these commentaries.
Views and any strategies described in these commentaries may not be suitable for all investors. Opinions expressed herein may differ from the opinions expressed by other units of PSPL or its connected persons and associates. Any reference to or discussion of investment products or commodities in these commentaries is purely for illustrative purposes only and must not be construed as a recommendation, an offer or solicitation for the subscription, purchase or sale of the investment products or commodities mentioned.
About the author
Tan Chek Ann
Senior Dealer
I sleep in the day and head the dealing desk at night.
In my nightly work, I attempt to do analysis, revolving around portfolio construction, long/short strategies, responsible leveraging and factors research.
Join me on my journey as I share my thoughts on various topics – though mostly still financial stuff.Reach me at tanca@phillip.com.sg.

 Back in Business: The Return of IPOs & Top Traded Counters in March 2024
  From $50 to $100: Unveiling the Impact of Inflation
  How to soar higher with Positive Carry!
  Why 2024 Offers A Small Window of Opportunity and How to Position Yourself to Capture It


