Good Business = Good Investment? Think Again! October 8, 2018

Working in the financial market giving commentaries can be a challenge. Although this is an extremely broad field, people expect us to be subject matter experts on EVERYTHING. You can argue that this is what we are paid to do – to know. Admitting “we don’t know” is one of the ways we can raise the probability of putting an end to our career – if we want to be really cynical about it.
I was once keynote speaker for a seminar held during the 2016 US Presidential Election. I made no mention about the election at all nor did I talk about the latest developments surrounding it because it was not directly in my wheelhouse. Instead, I presented the ugly truth: What makes good reading may not make a good investment. No questions were posted to me during the question and answer session after the seminar.
You see, how do you win in a game where the goal post is constantly shifting? This is unlike physics where laws are rigid – where we can measure and calculate certain outcomes with precision and then land rockets on the moon. The stock market is almost sentient with an irrational mind of its own in many cases.
The Shiller P/E ratio, named after Nobel Prize winning economist Robert Shiller, has been screaming that the market has been overvalued since early 2017. We are near the end of 2018 and are still seeing markets break new highs. So who is right?
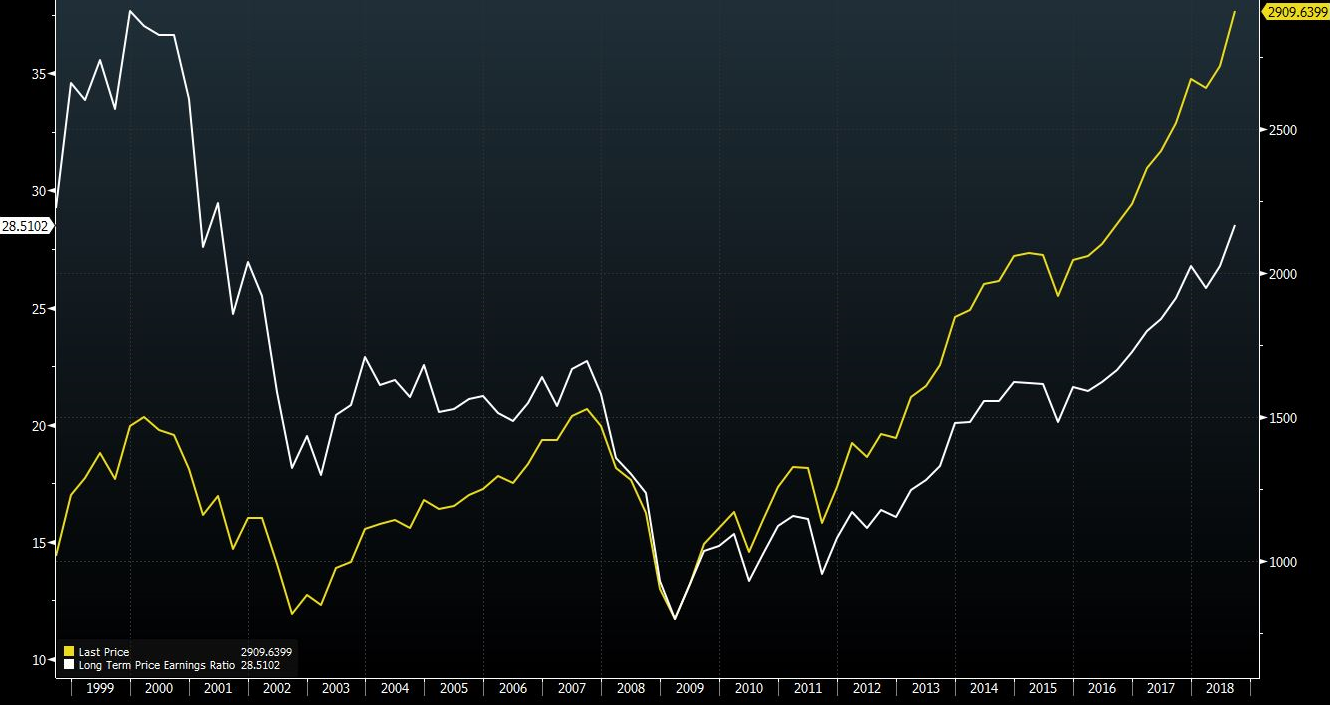
Chart 1: S&P 500 as of end September 2018. (White: Shiller P/E, Yellow: Index Level)
Shriller P/E ratio = Price / Inflation Adjusted 10 Year Average Earnings
My boss challenged me recently: “What’s our investment and stock picking philosophy?”
I wanted to say “I don’t know” but that WILL BE career suicide. So today, I put on a different hat and will address qualities of a more passive, “buy and forget”, kind of investment approach.
Good Business and Good Investments
To measure how well a business is run, we look at its Return on Equity (ROE). The more income the business generates, the higher the ROE. The higher the ROE, the better the investment turns out, right? Well, it depends.
I ranked companies by their ROE and sorted them into deciles. As holding period is much longer than previous experiments, I did four runs starting each quarter and averaged the results to prevent seasonality. Here are the rest of the parameters:
Universe: NYSE, Nasdaq & NYSE MKT
Market Cap: ≥ USD 100 million
Sampled Period: 22 years, from July 1996 to June 2018
Holding Period: 1 year
Factor: ROE (Net Income/Equity)
Here are the results if you have invested based on the business’s profitability – not much difference:
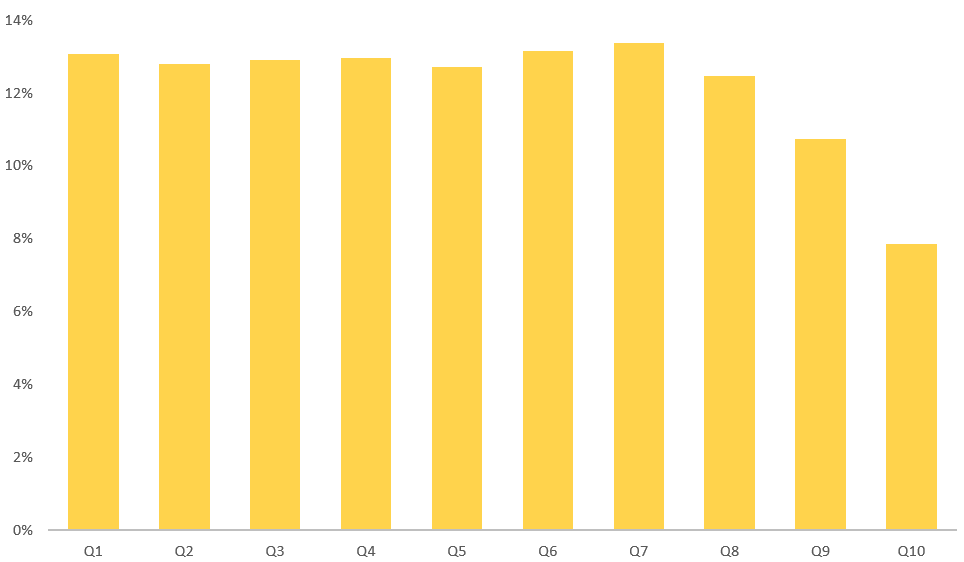
Chart 2: Q1 (Highest ROE) to Q10 (Lowest ROE)
The only meaningful conclusion we can draw is Q9 and Q10 underperformed. Returns from the rest of the deciles are almost indistinguishable. ROEs of individual companies ranged from a whopping 75% in Q1 to a loss making -1.5% in Q8. Yet as a whole, investing in them produced largely similar returns. In certain years, the companies with the worst ROE outperformed all the rest of the deciles. Why is this so?
This is because investment return, no matter how well the business is doing, is a function of price paid to obtain the investment. It is crucial that we understand this difference between a business and an investment. Paying too high a price diminishes your investment return, as the price needs to rise EVEN HIGHER for you to make a meaningful return. Without considering this, even the best businesses may turn out to be poor investments. If there is only one takeaway from reading this article, this would be it.
What then is the secret sauce?
If you have read The Intelligent Investor by Benjamin Graham, you may be familiar with this analogy:
“Mr. Market” knocks on your door every day and offers to buy or sell something. Prices are purely on his terms. Sometimes he may be irrational and asks for prices that are out of this world. Other days he may be in a good mood and offers a huge discount. You don’t have to deal with him if you don’t agree with his prices. He doesn’t take it to heart and will simply return the next day.
While we cannot control the ebb and flow of the market, we can control how much we are willing to pay. So buy cheap! Respond to “Mr. Market” only when prices are in our favour. This will make a huge difference in our performance returns.
To prove this to you, I ran two simple portfolios:
Universe: NYSE, Nasdaq & NYSE MKT
Market Cap: ≥ USD 100 million
Sampled Period: 22 years, from July 1996 to June 2018
Holding Period: 1 year (1 run in each quarter then results averaged)
Factors: Earnings Yield & Price to Book.
Earnings Yield: Earnings per share/Price per share
How much earnings you are getting for every dollar paid (Higher is better)
Price to Book: Price per share/Book value per share
How much you are paying for a dollar of book value (Lower is better)
In Portfolio 1 (Low Prices), we did just that and purchased companies that have their respective indicators in the cheapest quintile (20%). This means that the companies were trading at very low and favourable prices relative to their earnings and book value upon portfolio formation/rebalancing.
In Portfolio 2 (High Prices), we did exactly the opposite and purchased companies that were trading at high prices relative to their earnings & book value.
Here are the results:
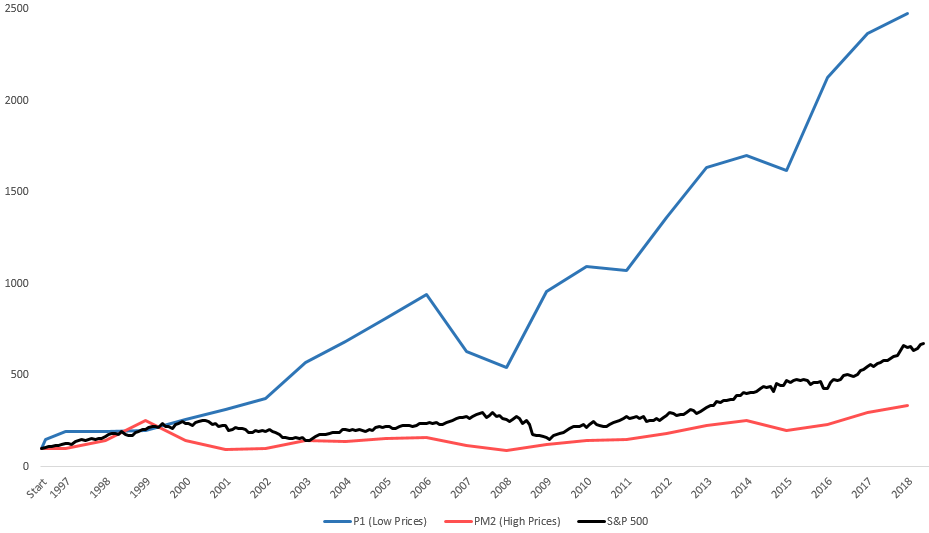
Chart 3: Cheap (Blue) vs Expensive (Red) vs S&P500 (Black)
The difference is staggering. At the end of 22 years, the cheap portfolio outperformed the S&P500 by a factor of 3, and the expensive portfolio by a factor of 7. When it comes to investments, buying value at a low price makes a huge difference in investment returns and is the way to go. This is the secret sauce.
Conclusion
Identifying good businesses is difficult enough. However, no matter how well the business is doing with its growing market share, wide economic moat, and superior returns, the important driver of your investment returns is still price paid relative the value you are getting. If the price paid is too high, your investment returns will likely suffer.
It is also important to note, value comes in many shapes and sizes.
Benjamin Graham, considered to be the Father of Value Investing, developed “net-nets”, paying less than a company’s current assets minus liabilities.
Warren Buffet, practiced a similar “cigar butt” method until his funds got too big and could not scale as well.
Seth Klarman, CEO of Baupost Group, wrote a book titled “Margin of Safety” and advocated paying low enough prices to buffer against wrong analysis or bad luck. The last I checked, used hard cover copies of the book sell for USD 899.
Peter Lynch, legendary fund manager of Magellan Fund averaging 29.9% returns over a 14-year period, preferred earnings growth and popularized purchasing GARP: Growth At Reasonable Price.
The list goes on. What constitutes “Value” is an art as much as it is a science.
Closing
In closing, I’ll like to attach the below chart: Japan’s Lost Decade (1991 onwards)
Investors that paid too high a price, investing near the end of 1989 – 1990, STILL haven’t gotten their monies back.
Food for thought!
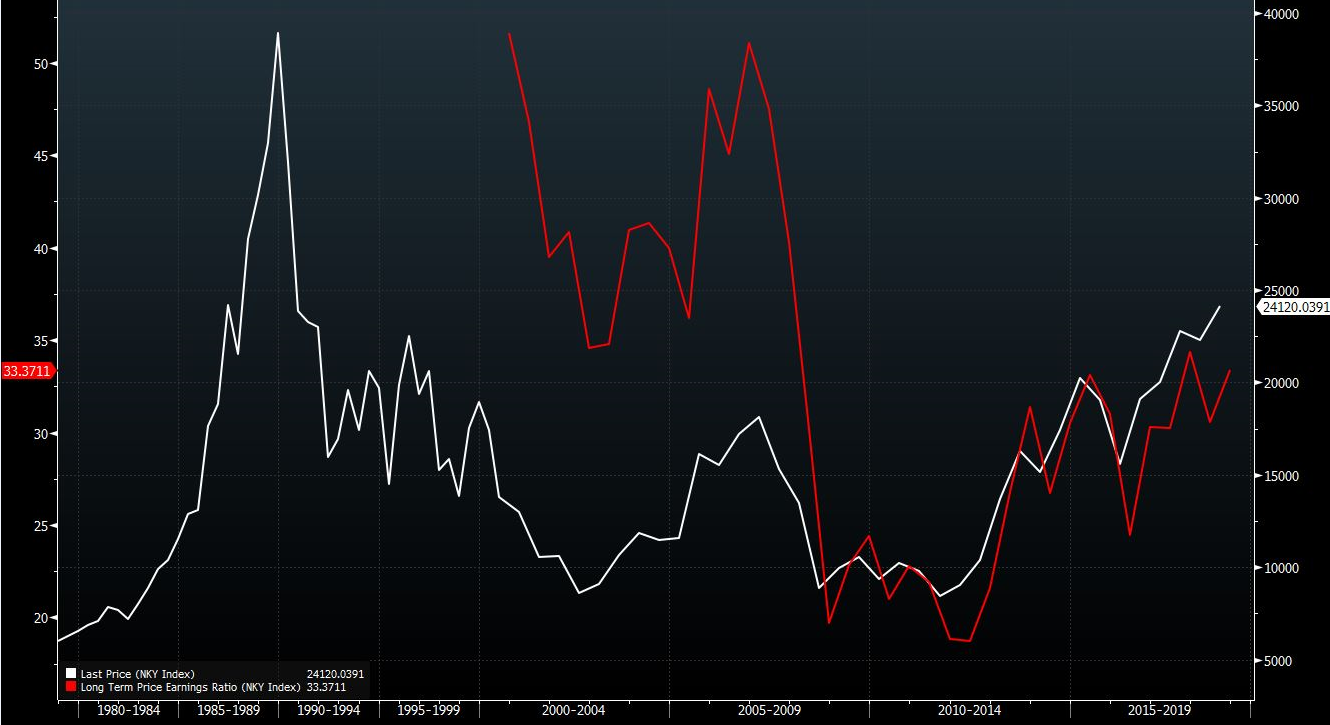
Chart 4: Nikkei 225 as of end September 2018 (White: Index Level, Red: Shiller P/E)
All data presented are from Bloomberg.
(*Please note that information contained in this article is given for educational purposes only. Past performances are not indicative of future returns. All information and opinions provided in this piece do not constitute as investment advice.)
Disclaimer
These commentaries are intended for general circulation. It does not have regard to the specific investment objectives, financial situation and particular needs of any person who may receive this document. Accordingly, no warranty whatsoever is given and no liability whatsoever is accepted for any loss arising whether directly or indirectly as a result of any person acting based on this information. Opinions expressed in these commentaries are subject to change without notice. Investments are subject to investment risks including the possible loss of the principal amount invested. The value of the units and the income from them may fall as well as rise. Past performance figures as well as any projection or forecast used in these commentaries are not necessarily indicative of future or likely performance. Phillip Securities Pte Ltd (PSPL), its directors, connected persons or employees may from time to time have an interest in the financial instruments mentioned in these commentaries. Investors may wish to seek advice from a financial adviser before investing. In the event that investors choose not to seek advice from a financial adviser, they should consider whether the investment is suitable for them.
The information contained in these commentaries has been obtained from public sources which PSPL has no reason to believe are unreliable and any analysis, forecasts, projections, expectations and opinions (collectively the “Research”) contained in these commentaries are based on such information and are expressions of belief only. PSPL has not verified this information and no representation or warranty, express or implied, is made that such information or Research is accurate, complete or verified or should be relied upon as such. Any such information or Research contained in these commentaries are subject to change, and PSPL shall not have any responsibility to maintain the information or Research made available or to supply any corrections, updates or releases in connection therewith. In no event will PSPL be liable for any special, indirect, incidental or consequential damages which may be incurred from the use of the information or Research made available, even if it has been advised of the possibility of such damages. The companies and their employees mentioned in these commentaries cannot be held liable for any errors, inaccuracies and/or omissions howsoever caused. Any opinion or advice herein is made on a general basis and is subject to change without notice. The information provided in these commentaries may contain optimistic statements regarding future events or future financial performance of countries, markets or companies. You must make your own financial assessment of the relevance, accuracy and adequacy of the information provided in these commentaries.
Views and any strategies described in these commentaries may not be suitable for all investors. Opinions expressed herein may differ from the opinions expressed by other units of PSPL or its connected persons and associates. Any reference to or discussion of investment products or commodities in these commentaries is purely for illustrative purposes only and must not be construed as a recommendation, an offer or solicitation for the subscription, purchase or sale of the investment products or commodities mentioned.
About the author
Tan Chek Ann
I sleep in the day and head the dealing desk at night. In my nightly work, I attempt to do analysis and scout around for trading ideas. The work I do tends to lean towards math and science as I’m not too much of an artistically-inclined person. Join me on my journey as I share my thoughts on various topics – though mostly still financial stuff. Reach me at tanca@phillip.com.sg

 Back in Business: The Return of IPOs & Top Traded Counters in March 2024
  From $50 to $100: Unveiling the Impact of Inflation
  How to soar higher with Positive Carry!
  Why 2024 Offers A Small Window of Opportunity and How to Position Yourself to Capture It


