GSS: SG Stocks to Look at this Season September 6, 2022

Introduction
The annual Great Singapore Sales (GSS) is back this year from 9 September to 10 October 2022. Once a year, the Singapore Retailers Association organises the GSS together with various malls and stores to promote Singapore’s tourism industry. Launched in 1994, this annual event usually runs 6 weeks.
In 2020, the GSS was rebranded as “GSS: Experience Singapore” and shifted online in light of the COVID-19 pandemic. This was also partially driven by the rising adoption of e-commerce worldwide where promotional seasons are frequent online and easily accessible across the globe nowadays, resulting in the irrelevance of the usual physical GSS.
Indeed, if we were to look at the Singapore Retail Sales Index below, it is evident that sales from offline retailers have been slowing down gradually since 2017, on the back of the rising adoption of e-commerce accelerated by the onset of the COVID-19 pandemic in 2020.
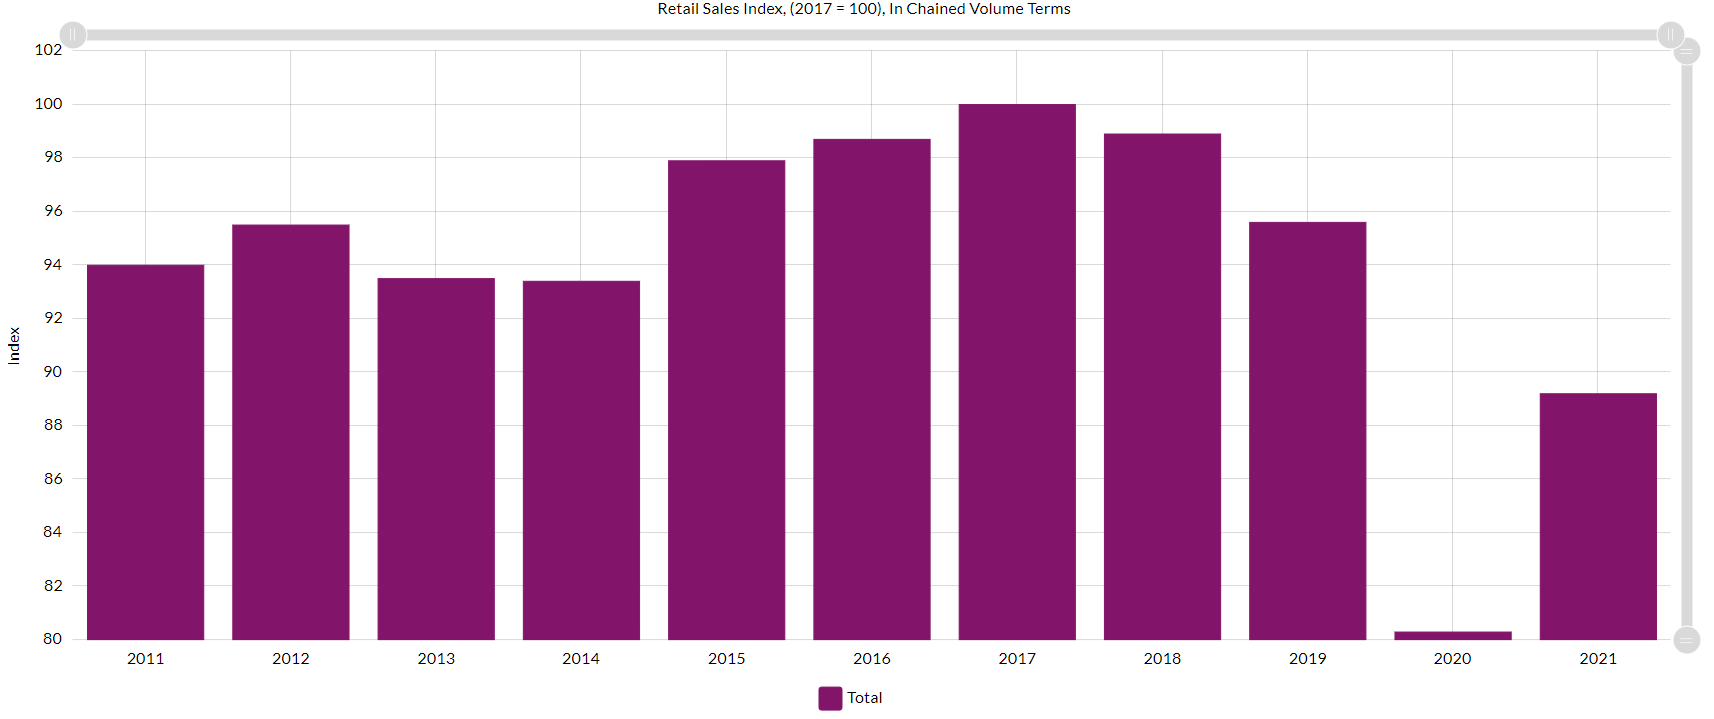 Source: Singapore Department of Statistics [1]
That being said, global retail sales from e-commerce came in at US$4,938 billion in 2021 and is projected to reach US$7,391 billion by 2025, an estimated CAGR of 10.61%. [2]
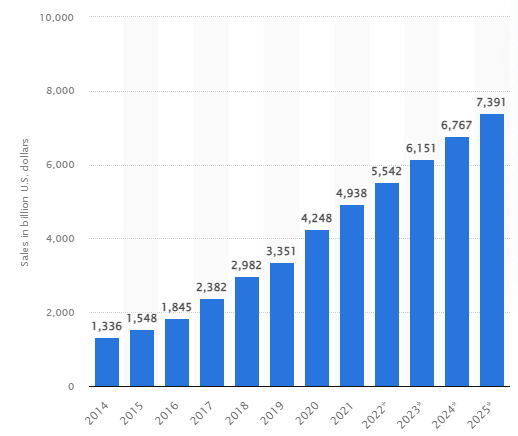 Source: Statista [2]
In our GSS article last year, we focused on the top 3 e-commerce companies in the world: Alibaba, Amazon and JD.com. This year, we would like to shine the spotlight on Singapore companies. While there are a few listed companies with direct exposure to e-commerce, we have attempted to search for e-commerce proxies among Singapore stocks by looking at the traversed sectors along the e-commerce value chain and picked a few that we think are worth looking at.
Mapletree Logistics Trust (SGX: M44U)
Mapletree Logistics Trust (MLT) is Singapore’s first Asia-focused logistics Real Estate Investment Trust. Listed on the Singapore Exchange Securities Trading Limited in 2005, MLT invests in a diversified portfolio of quality, well-located, income producing logistics real estate in Singapore, Hong Kong SAR, Japan, China, Australia, South Korea, Malaysia, Vietnam and India. As at 31 March 2022, MLT’s portfolio consisted of 183 properties. As such, MLT serves as a pure-play logistics space provider, along the e-commerce value chain with exposure in the Asia Pacific region.
Fundamental Analysis
1. Financial review
Looking at MLT’s financial statement for the year that ended on 31 March 2022, gross revenue was S$678,550,000, 20.9% higher year-on-year; [3] while its Net Property Income (NPI) came in at S$592,138,000, 18.6% year-on-year. [3] NPI is one of the metrics used to evaluate a REIT’s performance, particularly those that are listed in the Singapore jurisdiction and it is calculated as follows:
NPI = Gross Revenue – Property Expenses
Most importantly, investors like yourself would be most interested in its earning distribution to its unitholders, which can be gauged by its Distribution Per Unit (DPU). For the year ended on 31 March 2022, its DPU came in at S$0.08787, 5.5% higher year-on-year [3].
To have a better gauge of its performance, it is important to look at its financial performance for the past 5 years (at least) to ensure that it has a consistent track record of profitability and earning distribution to unitholders.
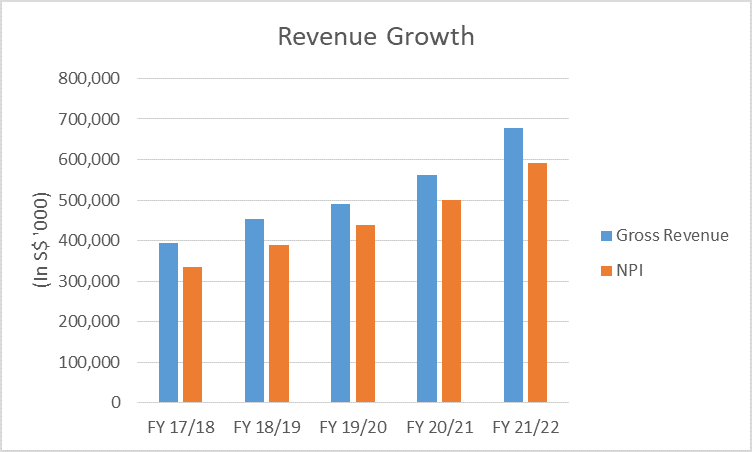 Source: POEMS
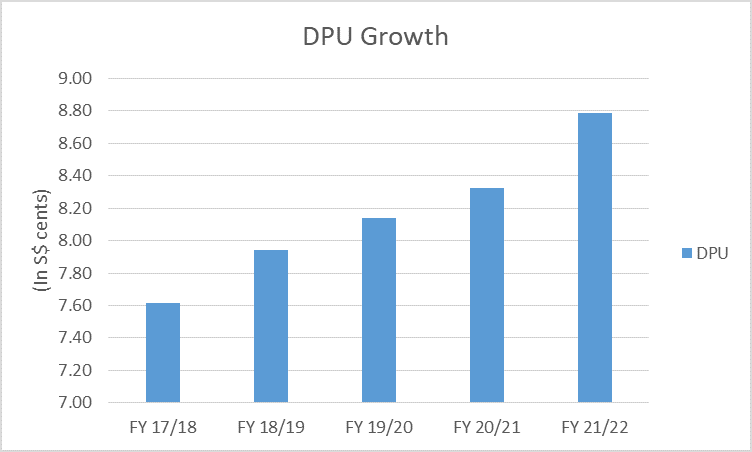 Source: POEMS
Indeed, from the two graphs above, we see that its gross revenue, NPI and most importantly, DPU to unitholders has been growing consistently over the past 5 years.
2. Capital Management
Moving on to its balance sheet, MLT has adopted a disciplined capital management approach to maintain a healthy balance sheet. Its Aggregate Leverage Ratio (ALR) came in at 36.8% for FY 21/22, slightly lower than the 38.4% in FY 20/21; despite its acquisitions of 20 properties, incurring a capital expenditure of S$1.8b. [3] The ratio is at a healthy level, within the 20-40% range and well below the MAS-mandated ceiling of 50%.
Meanwhile, its Interest Coverage Ratio (ICR), which essentially measures the number of times a company can pay its obligations using its earnings, stands at 5.0 times, which is an extremely healthy level, well above the MAS minimum requirement of 2.5 times. [3] The current levels of MLT’s ALR and ICR should provide some assurance to investors that it has the ability to take on further debt if needed to seize more yield-accretive acquisition opportunities to grow its portfolio going forward.
Its debt maturity profile also remains well-staggered with an average debt duration of 3.8 years and only 11% of the total debt (S$534m) is due in FY 22/23, where it has sufficient committed credit facilities of S$921m to refinance. [3]
Lastly, with the US Federal Reserve set to hike rates a few more times this year, this will likely put upward pressure on interest rates in Singapore in the short- and medium-term. Fortunately, MLT has adequate interest rate risk management in place where 79% of its total debt is hedged or drawn at fixed rates. [3]
3. Portfolio review
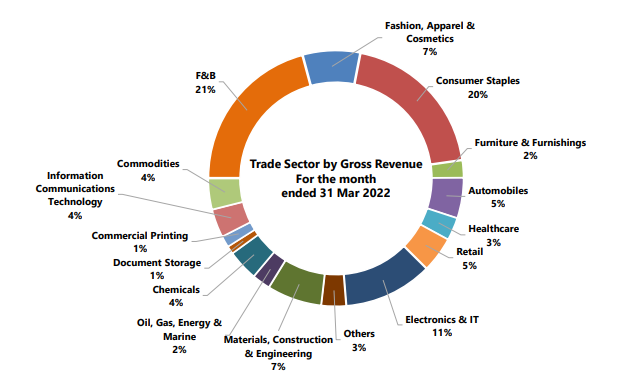
Next, let’s take a look at MLT’s portfolio and where its revenue comes from. In terms of diversification, its portfolio of 183 properties is well diversified across 9 countries in the Asia Pacific region. It also has a diversified tenant base of 840 customers across various trade sectors. Being well diversified, MLT is not dependent on any one market or sector, allowing it to be more resilient during downtimes.
 Source: Mapletree Logistics Trust [3]
Secondly, its overall portfolio occupancy stood at a healthy level of 96.7%, and is also much higher than the overall occupancy rate of 89.8% for Singapore industrial spaces reported in Q1 2022. [3] The leasing market remains stable for MLT, attributed to the demand boosted by e-commerce growth and business inventory stockpiling.
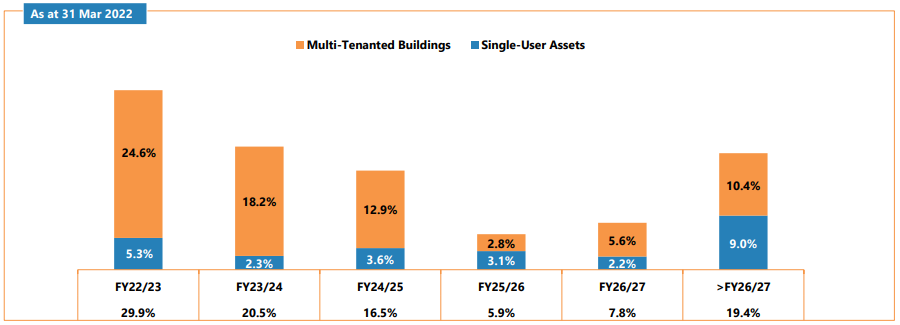
Thirdly, it has a long and well staggered Weighted Average Lease Expiry (WALE) of 3.5 years, with a balanced mix of single user assets and multi-tenanted buildings to ensure portfolio stability. [3]
 Source: Mapletree Logistics Trust [3]
WALE essentially measures the average time to expiry of existing leases of properties in a REIT based on the area a tenant occupies and the rent it pays to the REIT. A longer WALE can serve as a good assurance to investors during an economic downturn as tenants are locked into their tenancy agreements for a longer period of time.
4. Outlook in 2022 and beyond
Firstly, with the rise in demand during the pandemic, we are starting to see MLT pivoting into new economy assets, such as modernised logistics space, from the traditional association of warehouse facilities and buildings. This shift to new economy assets will help to catalyse earnings growth and capital upside.
Secondly, apart from the strong e-commerce adoption rate, we can expect the rising consumption rates, expanding middle-income urban population, growth of third-party logistics providers and the trend of supply chain resilience to drive up demand for quality logistics space while supply of Grade-A logistics space remains limited.
Lastly, it is important to not forget that the uncertainty over the US Federal Reserve rate hikes remains a key risk for Singapore REITs in 2022. However, it is not all gloomy for MLT as with its low gearing and adequate interest rate risk management for existing debts, we believe that MLT will have a better chance of prevailing against interest rate hikes.
Technical Analysis
Having understood MLT’s macroeconomic outlook and fundamental health, let us take a look at MLT’s price chart.
 Source: TradingView [4]
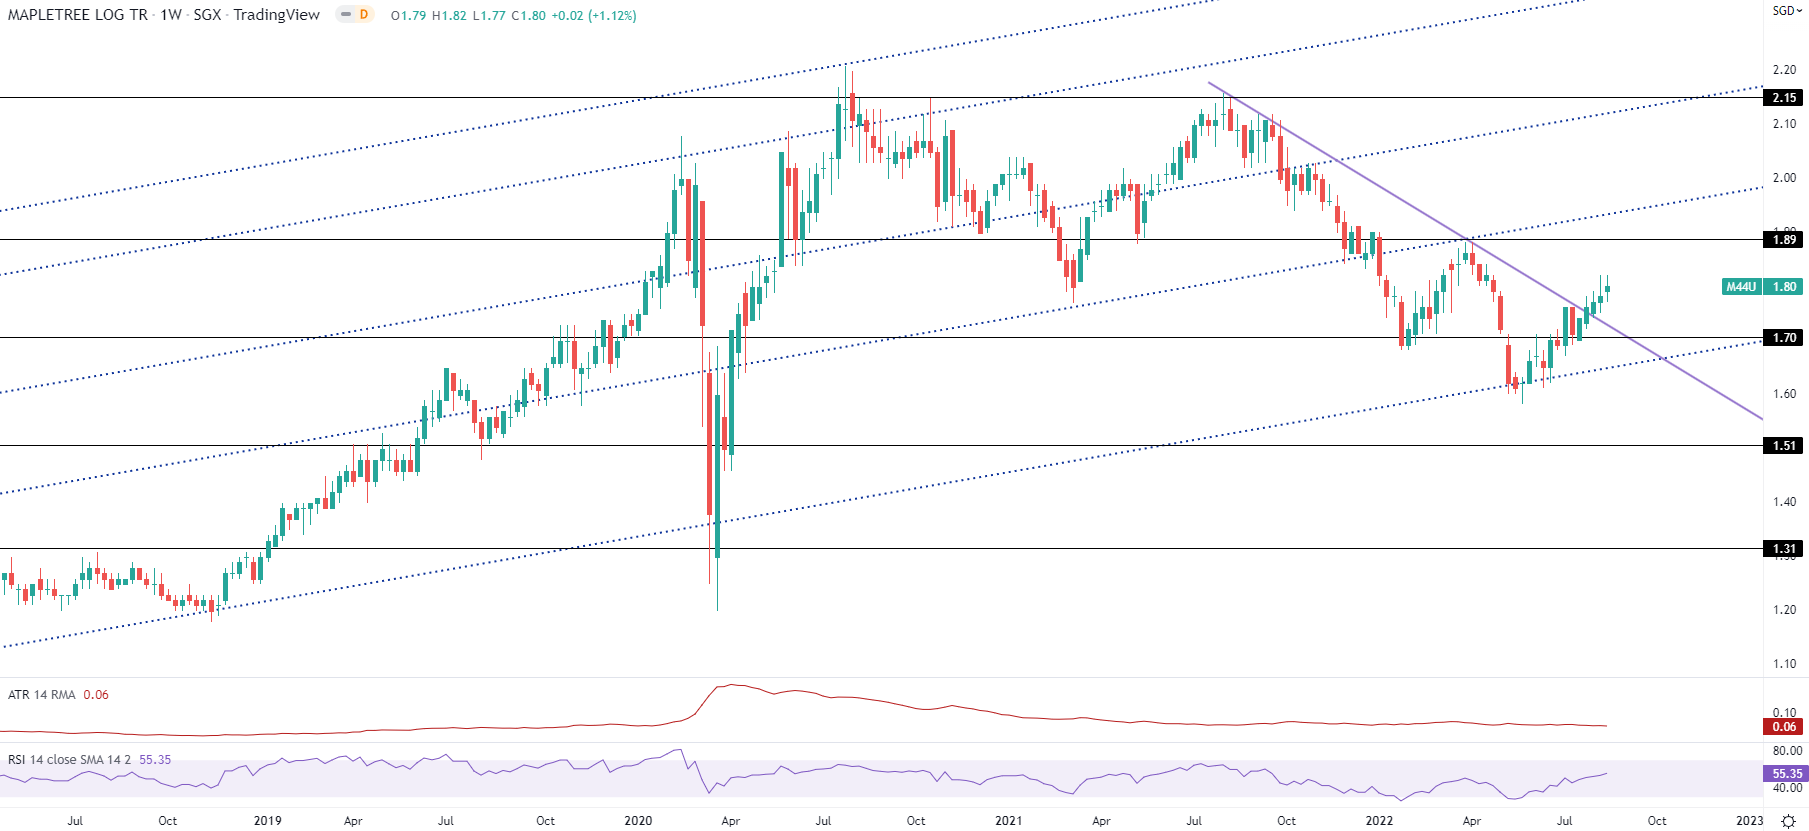
This is the weekly chart of MLT. You can see that its share price is in a long-term uptrend, as shown by the blue dotted uptrend lines. Next, you can see that there is a mid-term downtrend line that is in purple. The price of MLT has broken out of its downtrend line to resume its uptrend in the recent 3 weeks (1 – 15 August 2022).
The key support and resistance zones are also marked out by the black horizontal lines, showing where the price of MLT is likely to turn at.
Why is this stock chosen?
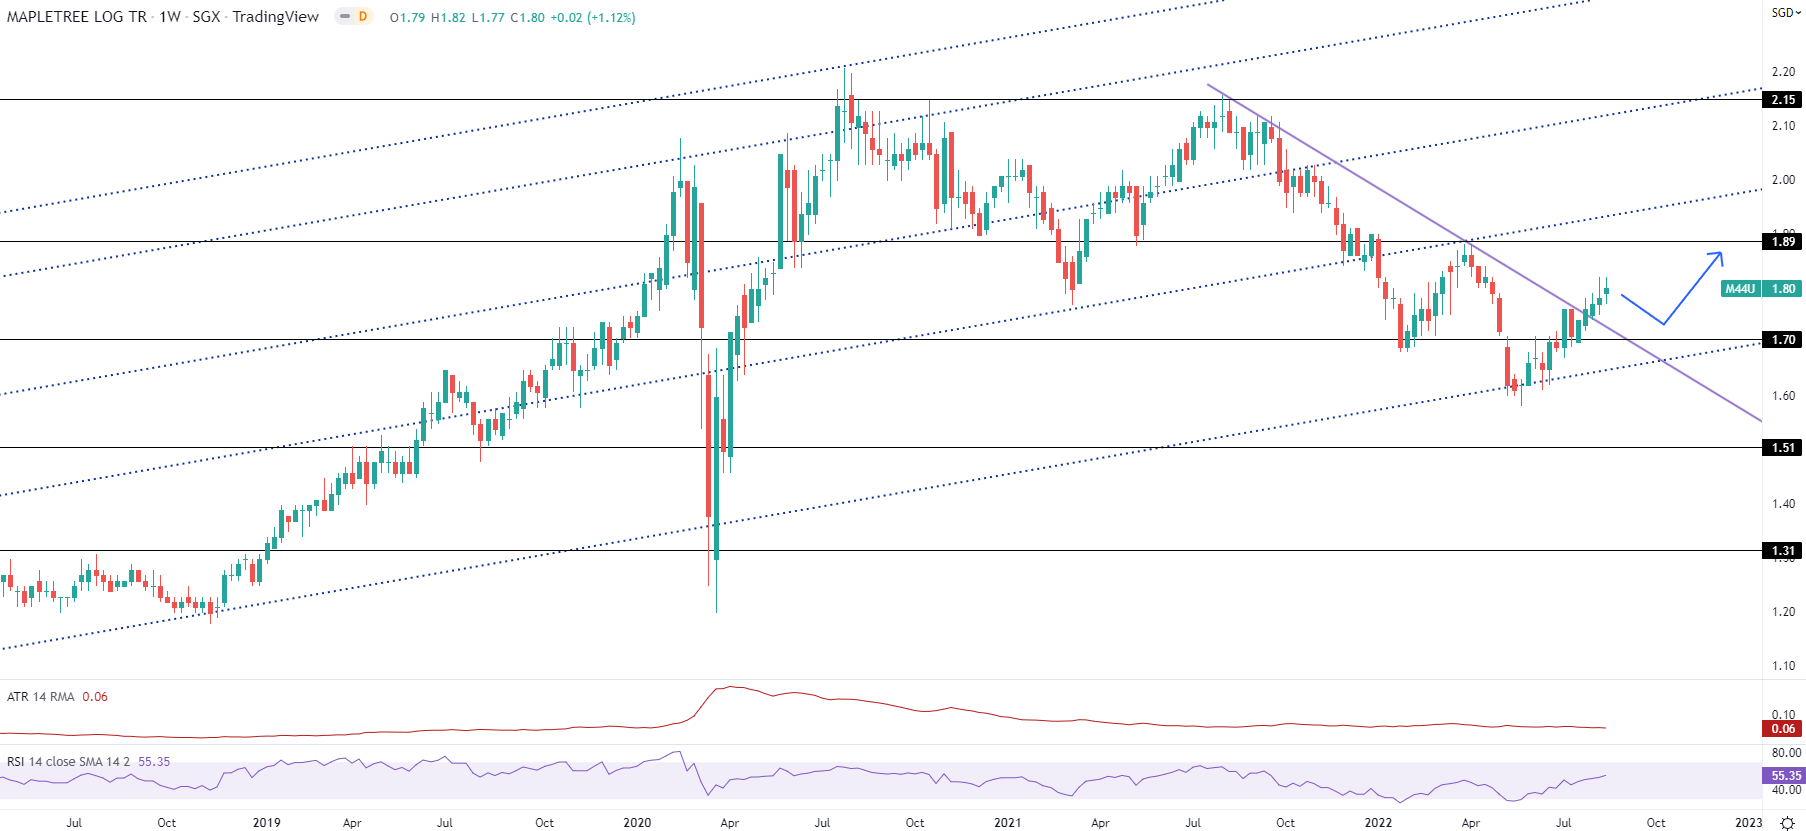
We see the possibility of a continuation of this uptrend, when we look at the rising value of the Relative Strength Index (RSI) indicator.
 Source: TradingView [4]
A rise in the value of the RSI indicator is a sign of bullish momentum. Now that we are aware of the bullish momentum, do we foresee a certain type of price action?
The price of MLT has been rising for 2.5 months now (1 June – 15 August 2022). Seasoned investors may be well aware: prices don’t rise in a straight line. We foresee a potential pullback to take place soon. When it does, the price of MLT shares could dip to an estimated S$1.70.
We see signs of continued bullishness and expect the share price of MLT to rise to around S$1.89 after the pullback.
Stock Rating
With sound fundamental and technical outlook, MLT appears to be a gem. This is one stock to watch closely in this period of greater uncertainty and volatility in the stock market.
Keppel Data Centre REIT (SGX: AJBU)
Data centres play a key role in e-commerce value chains as they help to support e-commerce activities by providing 24/7 connectivity and uptime for businesses; enhanced security to deter cyberattacks and protection of customer information, and the ability to handle high transaction demand from increased web traffic and engagement through robust and flexible IT infrastructure.
Earlier this year, during Amazon’s Southeast Asia Online Seller Summit, Singapore’s Minister for Trade and Industry, Mr Gan Kim Yong shared the government’s five-pronged approach [5] to build up Singapore as a global and regional e-commerce hub:
1. Roll out two nationwide 5G networks by 2025, to enhance the nation’s infrastructure capacity to handle large e-commerce orders from around the world
2. Partner with the industry to help build a strong foundation of data infrastructure to facilitate secure data sharing across supply chains
3. Provide more support to local businesses in gaining e-commerce capabilities
This is where Keppel Data Centre REIT (KDCR) comes into the picture. KDCR, listed on SGX on 12 December 2014, was the first pure-play data centre REIT to list in Asia. Apart from real estate which is primarily used for data centres, KDCR announced last year that it planned to expand its investment mandate to explore real estate and assets necessary to support the digital economy. One example would be the establishment of a Special Purpose Vehicle (SPV) which was used to acquire M1’s network assets in 2021.
Fundamental Analysis
1. Financial review
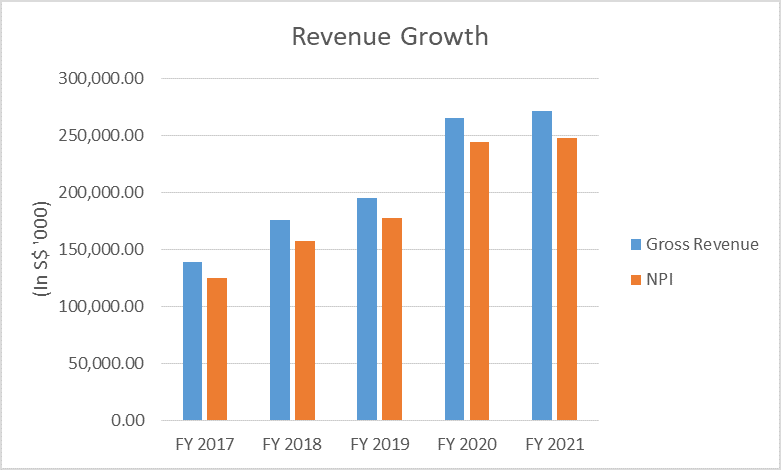
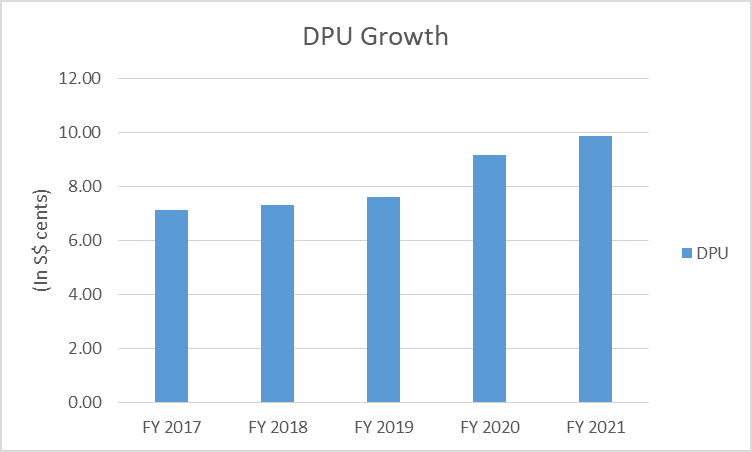
Similar to what we have done for MLT, we will focus on the Gross Revenue, NPI and DPU numbers to have a quick gauge on KDCR performance for FY 2021 as well as its performance for the past 5 years.
For FY2021, KDCR grew its Gross Revenue and NPI marginally by 2.1% and 1.6% respectively. [6] This was mainly due to the few acquisitions announced and completed during 2021. On top of that, KDCR invested in M1’s network assets following its expansion of its investment mandate to support the digital economy. As such, it is likely for us to start seeing these acquisitions and investments contribute meaningfully towards their revenue numbers only in FY2022.
Nonetheless, despite the slow growth in the above two metrics, DPU grew by 7.4% in FY2021. [6] This number is relatively impressive, considering that it is a defensive REIT by nature, due to its asset class. This shows how much demand for data centres has grown over the years. This is also a good indication to how much growth potential it has in the next 5 to 10 years as cloud computing and e-commerce continue to be a growing trend.
Lastly, let’s look at its performance for the past 5 years.
 Source: POEMS
 Source: POEMS
2. Capital management
Moving on to its balance sheet, KDCR’s Aggregate Leverage Ratio came in at 34.6% for FY2021, slightly lower on a year-on-year basis. [6] Similar to MLT, the ratio is at a healthy level, within the 20-40% range, well below the MAS-mandated ceiling of 50%. Despite the slight drop in its Interest Coverage Ratio from 13.3 times to 10.8 times year-on-year [6], it is still relatively high and strong, as compared to most REITs in the market, and is way below the MAS minimum requirement of 2.5 times. Its relatively low gearing provides for plenty of headroom to seize more yield-accretive acquisition opportunities in time to come.
Its debt maturity profile also remains well-staggered, with an average debt duration of 3.9 years. [6]
Lastly, KDCR also has adequate interest rate risk management in place where 74% of its total debt is hedged through floating-to-fixed interest rate swaps. [6]
3. Portfolio review
 Source: Keppel DC REIT [6]
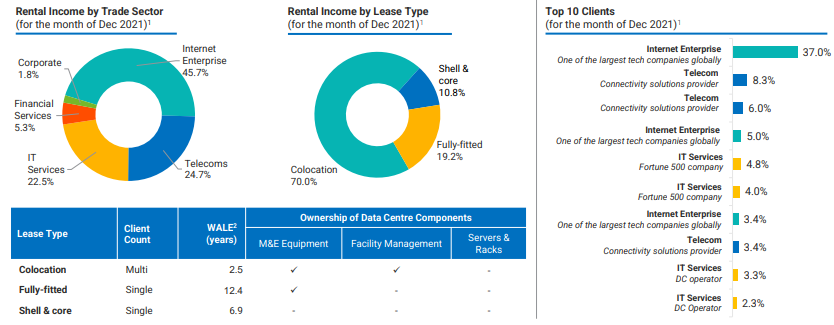
As at the end of FY2021, KDCR has a total of 20 data centres across 9 countries and rental income from the above 5 trading sectors.
In terms of rental income by lease type, KDCR is slowly growing concentration towards fully-fitted as well as shell & core facilities, as these 2 lease types provide income stability with typically longer lease terms. Meanwhile, it is slowly reducing exposure to colocation leases from 72.7% to 70% year-on-year. [6]
Lastly, its overall occupancy rate stands at a record high of 98.3% for FY2021 while its WALE stands at a healthy level of 7.5 years, an increase from FY2020’s 6.8 years. [6]
4. Outlook in 2022 and beyond
For 2021, we saw KDCR conduct a total of four acquisitions, with three data centres in Guangdong, the Netherlands, and London, as well as an investment in the bonds and preference shares of M1. As such, for FY2022, we can expect to see these acquisitions start contributing and have proper reflection of its revenue numbers.
Next, KDCR is also backed by a strong sponsor in Keppel Telecommunications and Transportation Ltd (Keppel T&T), which is a wholly-owned subsidiary of offshore and marine conglomerate, Keppel Corporation Limited (SGX: BN4). Both Keppel Corporation and Keppel T&T have a pipeline of more than S$2 billion of potential data centre assets for injection into KDCR in the future. Keppel T&T has also granted KDCR the Rights of First Refusal (ROFR) for future acquisition opportunities to its data centre. That being said, these will help KDCR secure a stable path for growth into FY2022, not to mention its relatively low gearing and high debt headroom, KDCR is likely to continue to acquire and expand their portfolio in FY2022.
Lastly, similar to MLT, the uncertainty over the US Federal Reserve rate hikes remains a key risk. With its low gearing and adequate interest rate risk management for existing debts, we believe that KDCR will have a better chance of prevailing against interest rate hikes.
Technical Analysis
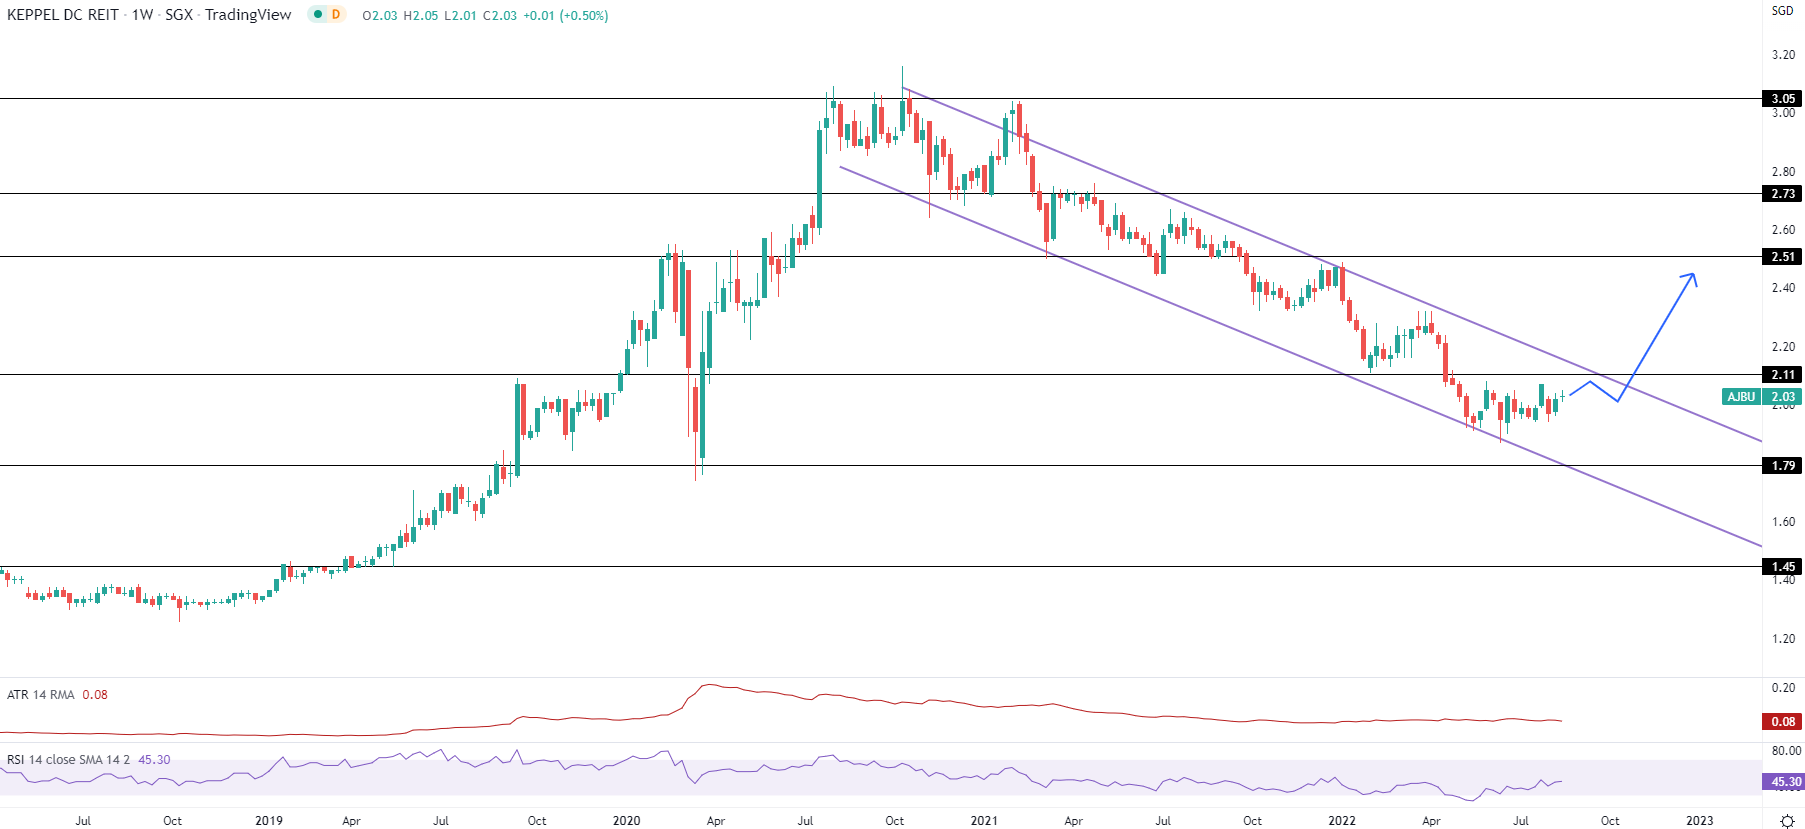
Now, let’s look at the charts of KDCR. There are 2 potential scenarios for KDCR – a bullish and a bearish scenario.
 Source: TradingView [4]
Let’s start off with the bullish scenario.
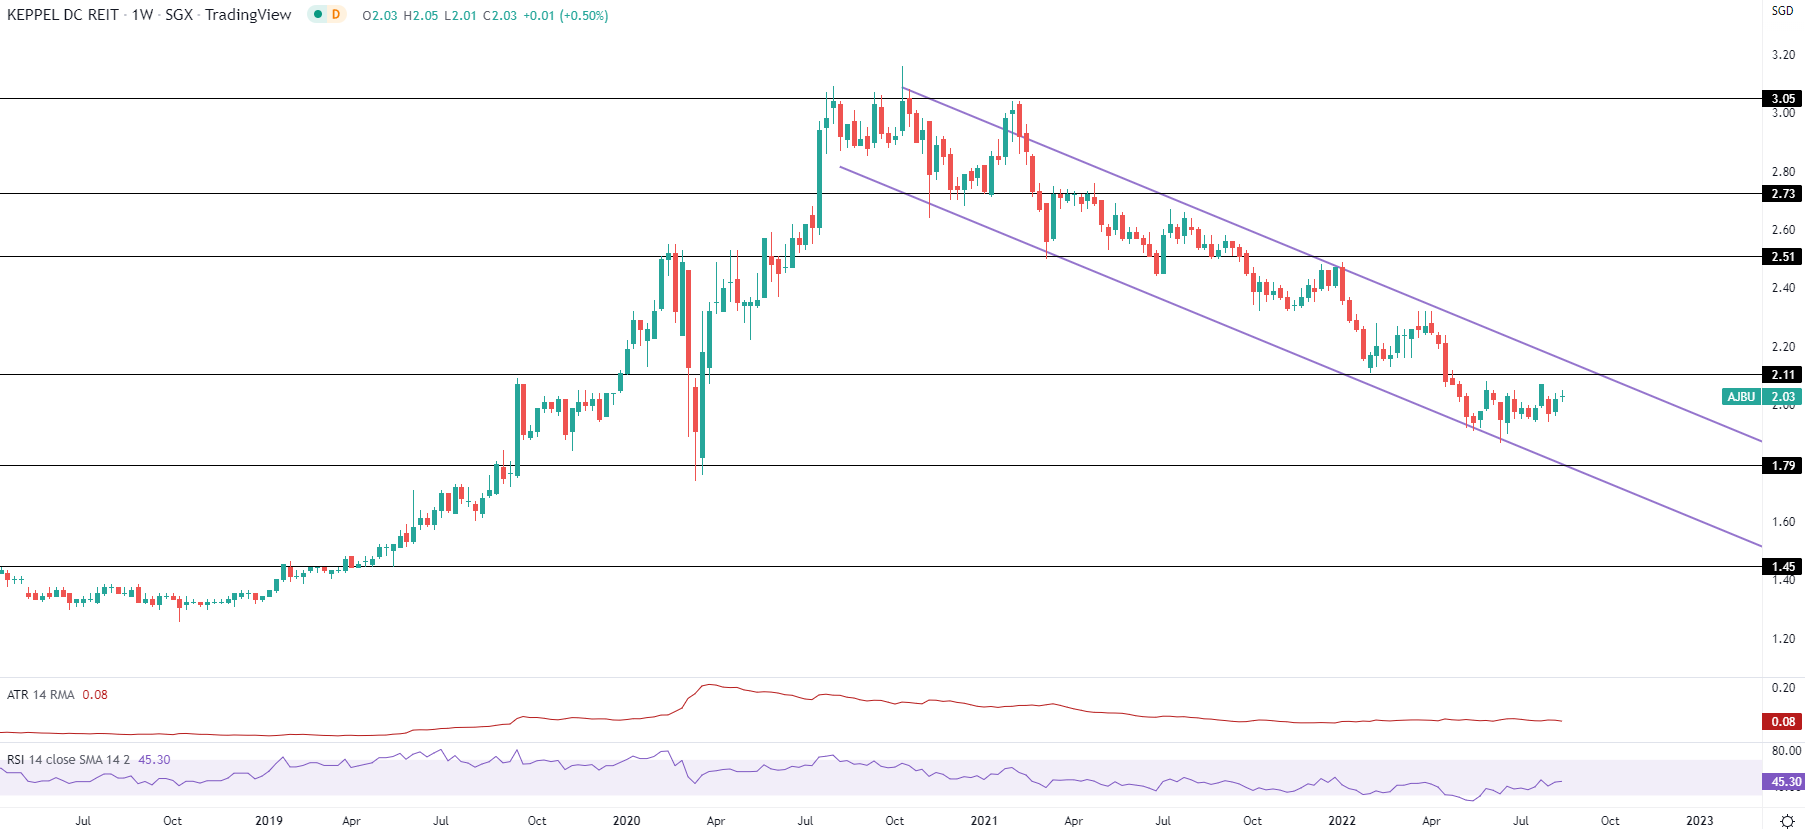
The chart shown above is the weekly chart of KDCR. Before September 2021, the share price of KDCR was rising. Its share price started to drop (depicted by the purple trendlines) when rumours of rising interest rates swirled.
With rumours turning into fact, is this a huge concern to KDCR?
Under the subheading “Capital Management” above, the Aggregate Leverage Ratio of KDCR came in at 34.6% for FY2021, slightly lower on a year-on-year basis. This is positive news.
Besides, the RSI value of KDCR’s chart is increasing. This indicates that there is a higher chance of a rebound in its price. Given the strong fundamentals KDCR enjoys, there is a bullish case for KDCR in the long-term, the blue directional arrow depicts its possible price action.
 Source: TradingView [4]
The black horizontal lines depict KDCR’s support and resistance zones. There is an immediate resistance zone around S$2.11. There is also an immediate support zone around S$1.79. If the price of KDCR were to rise, S$2.11 is the likely price region where KDCR will turn before relaunching itself upwards.
Now, let’s have a look at the bearish case.
 Source: TradingView [4]
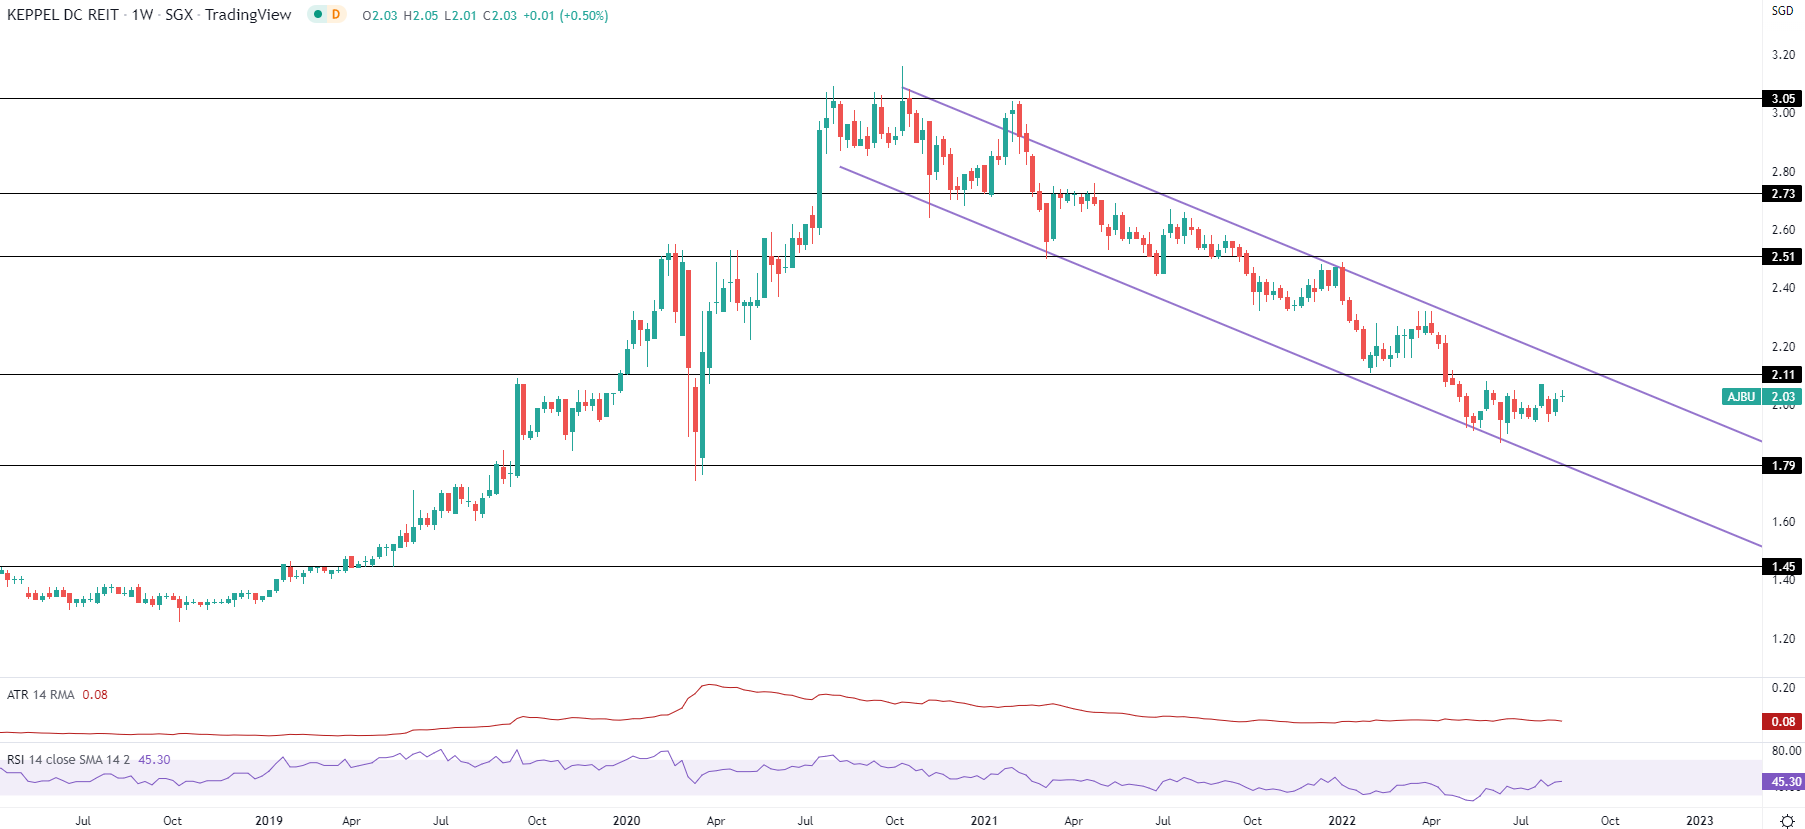
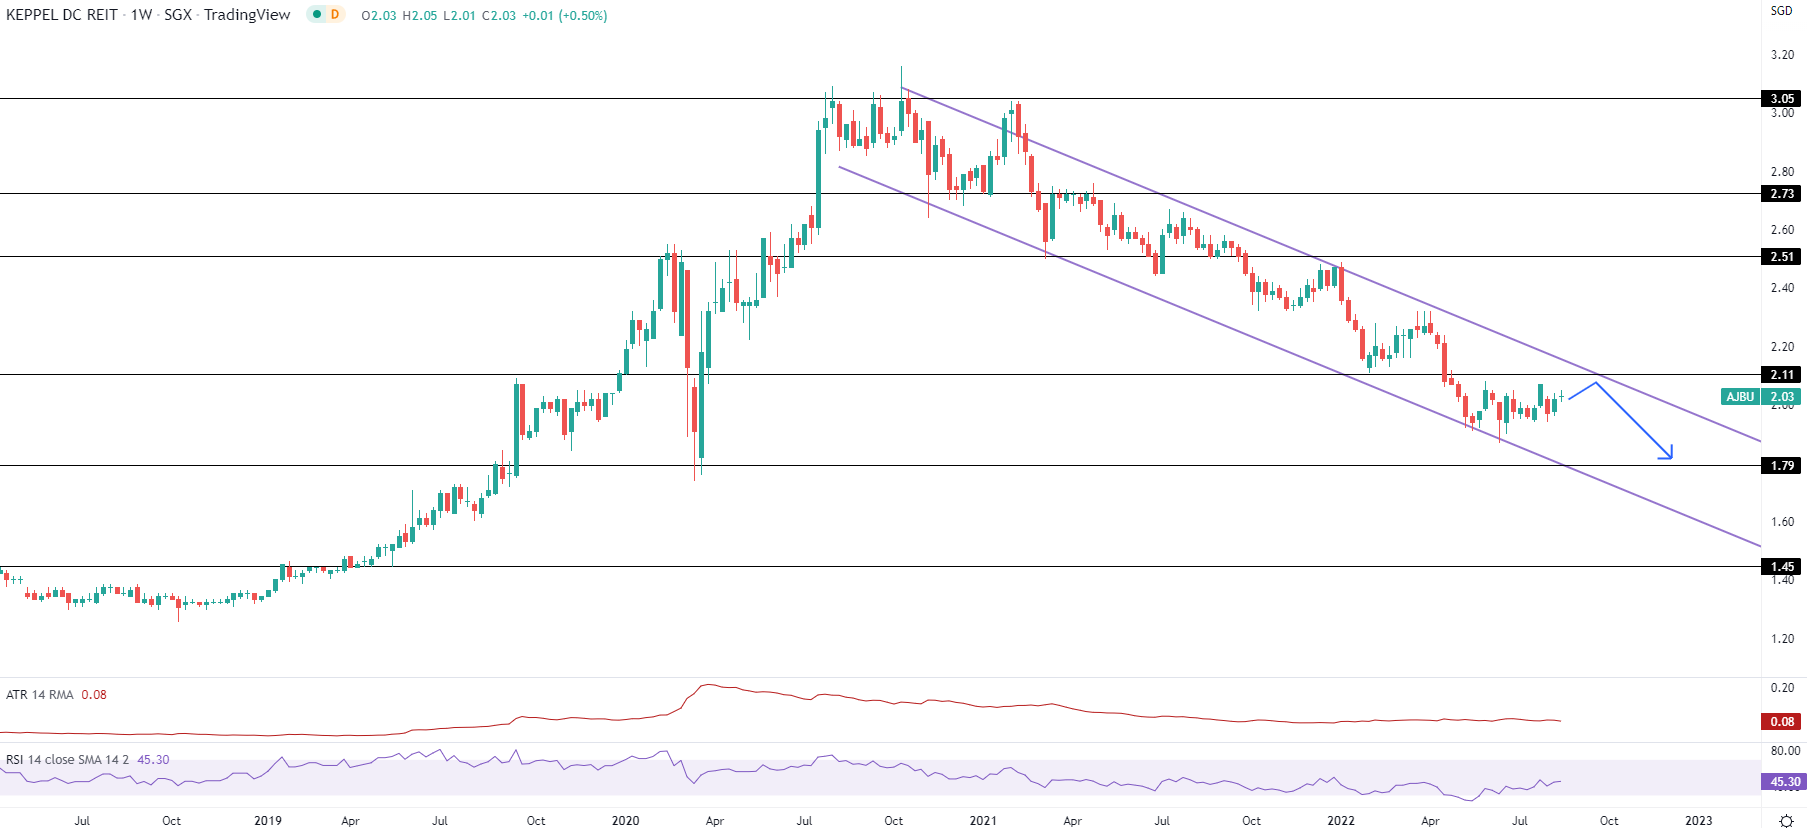
You will notice that its price is still trending lower (depicted by the purple trendlines). The price of KDCR has been on a downtrend since late 2021 and has yet to show signs of recovery. Despite the growth of the e-commerce sector and the integration of technology into our lives, the market is still pessimistic about KDCR’s growth.
The horizontal black lines, KDCR’s support and resistance zones, show an immediate support zone around the S$1.79 region. If the price of KDCR were to drop, it is likely to drop to S$1.79 and bounce before continuing to head lower.
We foresee prices of KDCR rising in the short-term, in the bearish scenario, before dropping further to its support zone around the S$1.79 region, as shown by the blue directional arrow in the chart below.
 Source: TradingView [4]
Though the macroeconomic outlook for KDCR might look rosy, the market seems to feel otherwise. If the market continues in this direction, trading opportunity is possible by shorting the KDCR shares.
To do this, you can use Contract for Differences (CFD) to sell shares short. You do not have to own or borrow the shares before shorting. It is also perfectly legal to do so in many countries.
Want to find out if CFD is for you and how you can use CFD to your advantage, this video is for you!
Stock Rating
This is a tough one because the share price of KDCR could go both ways. If you are a strong believer of fundamental analysis, KDCR presents a great opportunity for you to own its shares.
If you are a fervent believer of technical analysis, it might not be the right time to buy KDCR now, neither is it a good one for short selling too.
Conclusion
As shopping habits evolve, different brands enjoy a different cut of the pie every year. REITs and business trusts with stronger financial backing and health are in good stead to capture a huge chunk of the shifting consumer behavior, especially in this year’s (2022) GSS. By pairing fundamental and technical analysis, you can make more informed investment decisions to help optimise your investment capital!
How to get started
As the pioneer of Singapore’s online trading, POEMS’s award-winning suite of trading platforms offers investors and traders more than 40,000 financial products across global exchanges.
Explore an array of US shares with brokerage fees as low as US$1.88 flat* when you open a Cash Plus Account with us today. Find out more here (terms and conditions apply).

We hope that you have found value reading this article. If you do not have a POEMS account, you may visit here to open one with us today.
Lastly, investing in a community is much more fun. You will get to interact with us and other seasoned investors who are generous in sharing their experience and expertise.
In this community, you will be exposed to quality educational materials, stock analysis to help you apply the concepts, unwrap the mindset of seasoned investors, and even post questions.
We look forward to sharing more insights with you in our growing and enthusiastic Telegram community. Join us now!
For enquiries, please email us at cfd@phillip.com.sg.
Reference:
- [1] https://www.singstat.gov.sg/find-data/search-by-theme/industry/services/latest-data
- [2] https://www.statista.com/statistics/379046/worldwide-retail-e-commerce-sales/
- [3] https://www.mapletreelogisticstrust.com/Investor-Relations/Financial-Information/Financial-Results.aspx
- [4] https://www.tradingview.com/
- [5] https://www.businesstimes.com.sg/government-economy/five-pronged-strategy-to-build-up-singapore-as-e-commerce-hub-chan-chun-sing
- [6] https://www.keppeldcreit.com/en/investor-relations/financials/financial-results/
Disclaimer
These commentaries are intended for general circulation. It does not have regard to the specific investment objectives, financial situation and particular needs of any person who may receive this document. Accordingly, no warranty whatsoever is given and no liability whatsoever is accepted for any loss arising whether directly or indirectly as a result of any person acting based on this information. Opinions expressed in these commentaries are subject to change without notice. Investments are subject to investment risks including the possible loss of the principal amount invested. The value of the units and the income from them may fall as well as rise. Past performance figures as well as any projection or forecast used in these commentaries are not necessarily indicative of future or likely performance. Phillip Securities Pte Ltd (PSPL), its directors, connected persons or employees may from time to time have an interest in the financial instruments mentioned in these commentaries. Investors may wish to seek advice from a financial adviser before investing. In the event that investors choose not to seek advice from a financial adviser, they should consider whether the investment is suitable for them.
The information contained in these commentaries has been obtained from public sources which PSPL has no reason to believe are unreliable and any analysis, forecasts, projections, expectations and opinions (collectively the “Research”) contained in these commentaries are based on such information and are expressions of belief only. PSPL has not verified this information and no representation or warranty, express or implied, is made that such information or Research is accurate, complete or verified or should be relied upon as such. Any such information or Research contained in these commentaries are subject to change, and PSPL shall not have any responsibility to maintain the information or Research made available or to supply any corrections, updates or releases in connection therewith. In no event will PSPL be liable for any special, indirect, incidental or consequential damages which may be incurred from the use of the information or Research made available, even if it has been advised of the possibility of such damages. The companies and their employees mentioned in these commentaries cannot be held liable for any errors, inaccuracies and/or omissions howsoever caused. Any opinion or advice herein is made on a general basis and is subject to change without notice. The information provided in these commentaries may contain optimistic statements regarding future events or future financial performance of countries, markets or companies. You must make your own financial assessment of the relevance, accuracy and adequacy of the information provided in these commentaries.
Views and any strategies described in these commentaries may not be suitable for all investors. Opinions expressed herein may differ from the opinions expressed by other units of PSPL or its connected persons and associates. Any reference to or discussion of investment products or commodities in these commentaries is purely for illustrative purposes only and must not be construed as a recommendation, an offer or solicitation for the subscription, purchase or sale of the investment products or commodities mentioned.
About the author
Benjamin Tay and Jeremy Chua, Dealing
Benjamin graduated from the State University of New York at Buffalo with a Bachelor’s degree in Business Administration. A believer that a strong foundation is absolutely necessary to succeed in the financial markets, he enjoys sharing his knowledge and experience to help others succeed.
Jeremy graduated from Nanyang Technological University with a Bachelor’s Degree in Business and is a member of the largest dealing team in Phillip Securities. He strongly believes in the importance of staying invested in the financial markets and evaluates stocks using fundamentals to make informed investment decisions. In his free time, he enjoys researching on market events and disruptive investment themes to generate new investment ideas for the short and long term.

 Back in Business: The Return of IPOs & Top Traded Counters in March 2024
  From $50 to $100: Unveiling the Impact of Inflation
  Japan’s Economic Resurgence: Unveiling the Tailwinds Behind Nikkei 225’s Record Leap
  What Makes Forex Trading Attractive?


