Inflation, Interest Rates & Hedging April 12, 2022
What this report is about:
- Identify current macro trends and headline worries for investors
- Discuss policy response from central banks to current macro trends and how is it different this time
- Hedging strategies – Pros, Cons and Examples
Current Headlines & Macro Trend
The COVID-19 pandemic has done damage to the global supply chains and the war between Russia and Ukraine has driven up the price of crude oil. As a result, investors are flocking to safe haven assets.
Currently, the main macro-economic factors affecting investors are 40-year high inflation rates (the increasing price of oil and other commodities) and a rise in overall interest rates.
Inflation is the rate of increase in prices over a time period [1]. While inflation destroys wealth and purchasing power, managed inflation is essential for a growing economy.
For example, the Federal Reserve (the Central Bank of United States, also known as “The Fed”) has a long-term inflation target of 2%. And the Fed believes that having low and stable inflation can set inflation expectations and achieve the mandate of maximum employment and price stability [2].
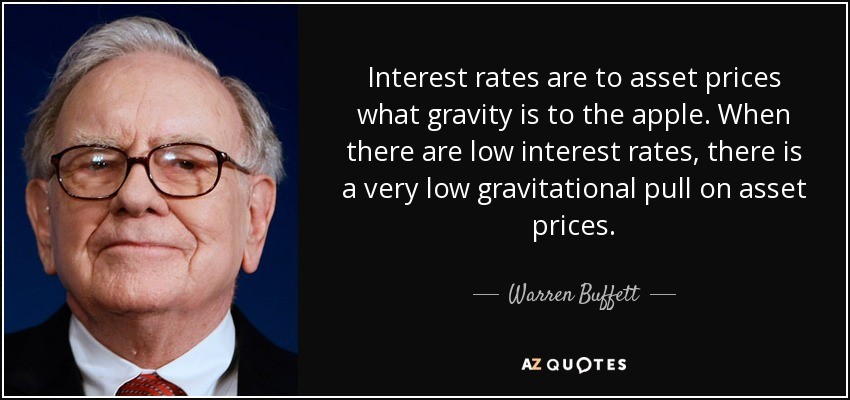 Source: AzQuotes [1]
However, with inflation rates at a 40-year high of 7.5% in US, the Federal Reserve is being forced to take action through increasing interest rates aggressively to cool down the economy and before inflation expectations change.
Economists and analysts believe that the Fed is behind the curve on this, and that it is not increasing interest rates fast enough though inflation is increasing at a rapid pace [4]. Therefore, there is a high chance that the Fed could hike interest rates too much, which could then shock the market and harm investors.
The threat investors could face going forward is the Fed’s tightening of monetary policy by increasing interest rates to combat rising inflation. The Fed uses monetary policy to influence interest rates to stimulate or cool down the economy, but the current business environment is different from the macro environment which investors have been used to for the past 30 years.
Currently, the Fed is increasing interest rates out of necessity to combat inflation as compared to normalising interest rates to ensure that they can lower interest rates again to combat the next crisis.
The current backdrop is very different from the backdrop of the most recent rate hikes in 2018. In 2018, the Fed wanted to normalise rates while the economy had record low unemployment and the inflation rate was below 2% [5]. Also, at that time, the faced resistance and criticism when increasing interest rates.
Besides, it had to take into account issues like the trade war between the US and China, the possibility that higher rates could bring down inflation even more and public demands from then President Donald Trump demanding that Jerome Powell (Chair of the Fed) cut interest rates.
 Photograph: Carlos Barria/Reuters [6]
Though the current scenario features a low unemployment rate (4-4.5%) and a 7.5% inflation rate, it is hard for the Fed to justify maintaining rates at existing levels.
Hedging and Strategies
As a risk management strategy that aims to reduce the potential or actual losses incurred, hedging protects portfolios from crisis-level events and provides value to investors over the long run.
Investors treat hedging like an “insurance policy” that pays off and can even protect the portfolio when an adverse situation occurs.
There are a few characteristics that hedging assets must have:
1) They must be negatively correlated to adverse events and/or the portfolio
This is to ensure that the instrument is moving independent of the adverse event and/or portfolio it is trying to hedge and provide the intended protection.
2) Low in cost
This is to minimise the negative impact of hedging to the portfolio’s performance.
3) Easy to understand and execute
The simpler the product, the easier it is to understand when you should increase or reduce the hedging asset.
There are different levels and degrees to hedging.
Full Hedge Strategy
Full hedged strategy involves establishing a hedge position that makes your portfolio net neutral. This means that the portfolio is immune to all price movements. This can be done by establishing a position of the same size on the same counter in the opposite direction.
Advantages
The full hedge strategy can be used during periods of high anticipated volatility, when the market closes for weekends and trading holidays, to prevent price gaps. A price gap is when a security’s price either rises or falls from the previous close with no trading in between [7].
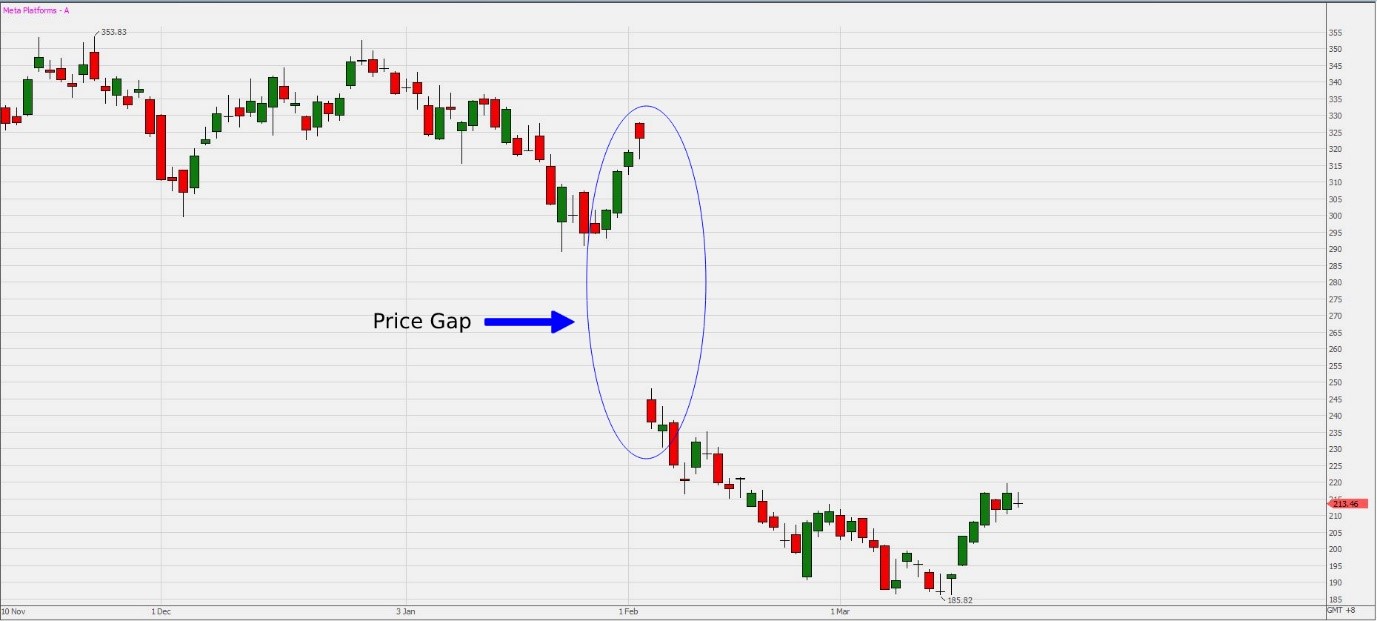 Source: Poems Platform
Disadvantages
After factoring in fees and the price of holding both positions, you will incur a net loss. So, if you do not participate in any price movement, you lose out on potential gains, and therefore this can only be a short-term strategy.
Partial Long-term Hedging
Partial long-term Hedging is holding a hedging position that hedges only a proportion of the net exposure with a long-time horizon. This method does not require timing the market ad yet is able to offer downside protection against sudden adverse events such as natural disasters and unforeseen events. Partial long-term hedging reduces portfolio volatility compared to an unhedged portfolio and potentially offers a better risk vs reward ratio (Sharpe Ratio), for example, holding gold, commodities, defensive bonds, fixed deposits and securities which are minimally to negatively correlated to the portfolio.
However partial long-term hedging tends to offer lower returns compared to an unhedged portfolio (assuming that the portfolio is diversified). Also, selecting partial hedging assets is difficult and time consuming, as gathering information and data analysis to find suitable hedging asset is tedious. Partial hedging assets may not be able to be hedged against all adverse/crisis events.
Macro Environment-based Hedging
Macro environment-based hedging consists of buying and increasing hedging securities according to the current and short-term macro environment. It uses specific hedging assets to hedge against specific changes in the macro environment (such as inflation, interest rates and war). The hedging instrument may be a long-short position to gain the required exposure. This way of hedging results in a net position which can generate returns over time, as this hedging strategy is short-term focused. Once the macro environment changes, adjustments need to be made to reflect potential threats.
However, macro environment-based hedging requires investor discipline and picking the right hedging instruments according to the macro environment. The ever-changing macro environment makes it difficult to find suitable hedging instruments.
Partial Long-term hedging
Partial long-term hedging can feature spot gold and involve macro environment-based hedging to counter record high inflation, rising interest rates and military conflicts. But how do you maximise investor returns in a risk-adjusted manner. For investors, risk-adjusted returns are often a better measure than gross returns as the former takes risk into account.
Gold, Good? Or Bad?
Gold has always been seen as a hedge against inflation. This is because a fiat currency loses its value through excessive printing and inflation, but gold as a commodity will still hold its intrinsic value.
Gold is also seen as “safe haven” asset, as during market turmoil it tends to retain or even increases in value as investors dump risky assets. However, gold is a non-income generating asset, so how will it perform over time? And how well does it perform as a hedging instrument?
To demonstrate this, we compare GLD (SPDR Gold Shares) to SPY (S&P 500 ETF) over a 15-year timeframe, assuming that both portfolios started with a US $100 initial capital on 1 Jan 2007.
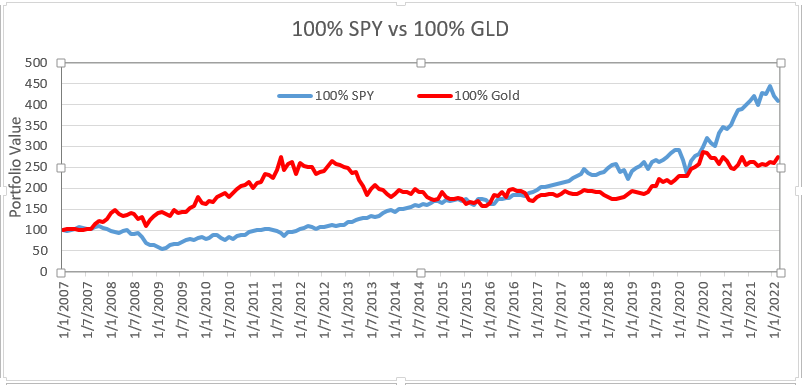 Source: Poems Platform
| Monthly | GLD | SPY |
| Average Return | 0.69% | 0.88% |
| Stdev | 5.02% | 4.42% |
| Variance | 0.25% | 0.20% |
| Sharpe Ratio | 0.1036 | 0.1612 |
| Correlation | 0.057275 | 0.057275 |
Gold by itself is an inferior investment instrument as it has lower average monthly returns (0.69% < 0.88%) compared to SPY.
Further, gold has a higher standard deviation (Stdev), a measure of risk (5.02% > 4.42%) and an overall lower risk adjusted ratio (Sharpe Ratio), which takes into account how returns are generated with 1 unit of Stdev (Risk).
However, gold and SPY have a relatively low correlation, and therefore the prices movement of gold and SPY are seen to be almost independent.
Next, we will create a portfolio with 10% Gold and 90% SPY.
| GLD | SPY | 10% GLD90% SPY | |
| Average | 0.69% | 0.88% | 0.86% |
| Stdev | 5.02% | 4.42% | 4.04% |
| Variance | 0.25% | 0.20% | 0.16% |
| Sharpe Ratio | 0.1036 | 0.1612 | 0.1717 |
The 10% GLD with 90% SPY portfolio has a higher Sharpe Ratio (0.1717 > 0.1612) compared to the 100% SPY. This means that the 10% GLD with 90% SPY portfolio has a better risked-adjusted performance, and is able to generate higher returns per unit of Stdev (Risk).
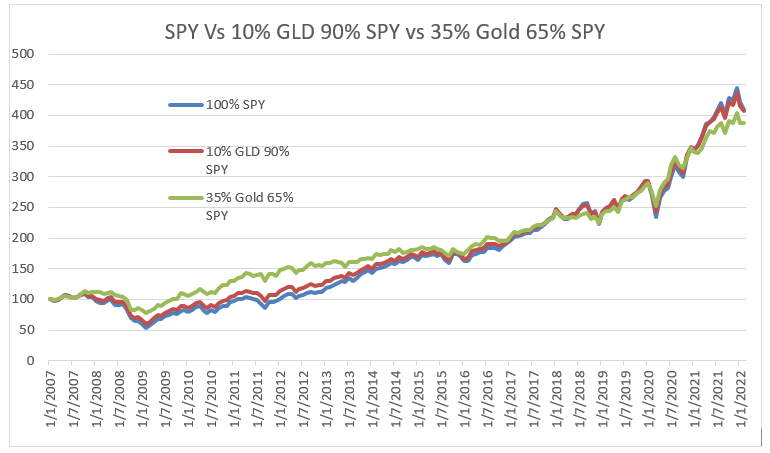 Source: Poems Platform
| %SPY | 90% | 80% | 70% | 65.12% | 60% | 50% | 40% | 30% |
| %Gold | 10% | 20% | 30% | 34.88% | 40% | 50% | 60% | 70% |
| Sharpe Ratio | 0.1717 | 0.1807 | 0.1861 | 0.1869 | 0.1860 | 0.1793 | 0.1669 | 0.1511 |
From the table above, it can be seen that the 34.88% Gold and 65.12% SPY portfolio is able to achieve the highest Sharpe ratio, and is the most optimal ratio of gold and SPY. Investors with gold (GLD) making up 34.88% of their portfolio for the past 15 years would have benefitted assuming a portfolio of only gold and SPY. Investors with different portfolio asset allocations need to do their due diligence to work out the optimal ratio to maximise risk-adjusted returns.
Macro Environment-based Hedging
This can target the increasing rate of inflation, interest rates and military conflicts. But the hedging instrument has to be rebalanced and rechecked to see if it is still relevant. And you have to re-adjust the weightage to reflect the risks that the macro environment poses to the investor’s portfolio.
Record high inflation can be attributed to the increase in the prices of commodities such as energy (crude oil, fuel oil, gasoline and natural gas) and commodities [8] as shown in the table below:
| Expenditure category | 12-month percent change, Jan. 2021–Jan. 2022 |
Relative importance weight, Jan. 2021–Jan. 2022 |
| Energy | 27% | 7.348% |
| Energy commodities | 39.9% | 4.014% |
| Fuel oil | 46.5% | 0.115% |
| Motor fuel | 40% | 3.822% |
| Gasoline (all types) | 40% | 3.748% |
| Commodities less food and energy commodities | 11.70% | 21.70% |
Source: US BUREAU OF LABOR STATISTICS [8]
Inflation & Oil
As the military conflict between Russia and Ukraine has put pressure on global oil prices [9], macro environment-based hedging exposes the investor’s portfolio to oil prices, such as a holding position in WTI/Brent Oil CFDs, upstream oil (discovery, extraction and production) and downstream (refinery and processing) companies. Direct exposure can be achieved through spot oil, but if you want less direct exposure, then go for upstream and downstream oil companies.
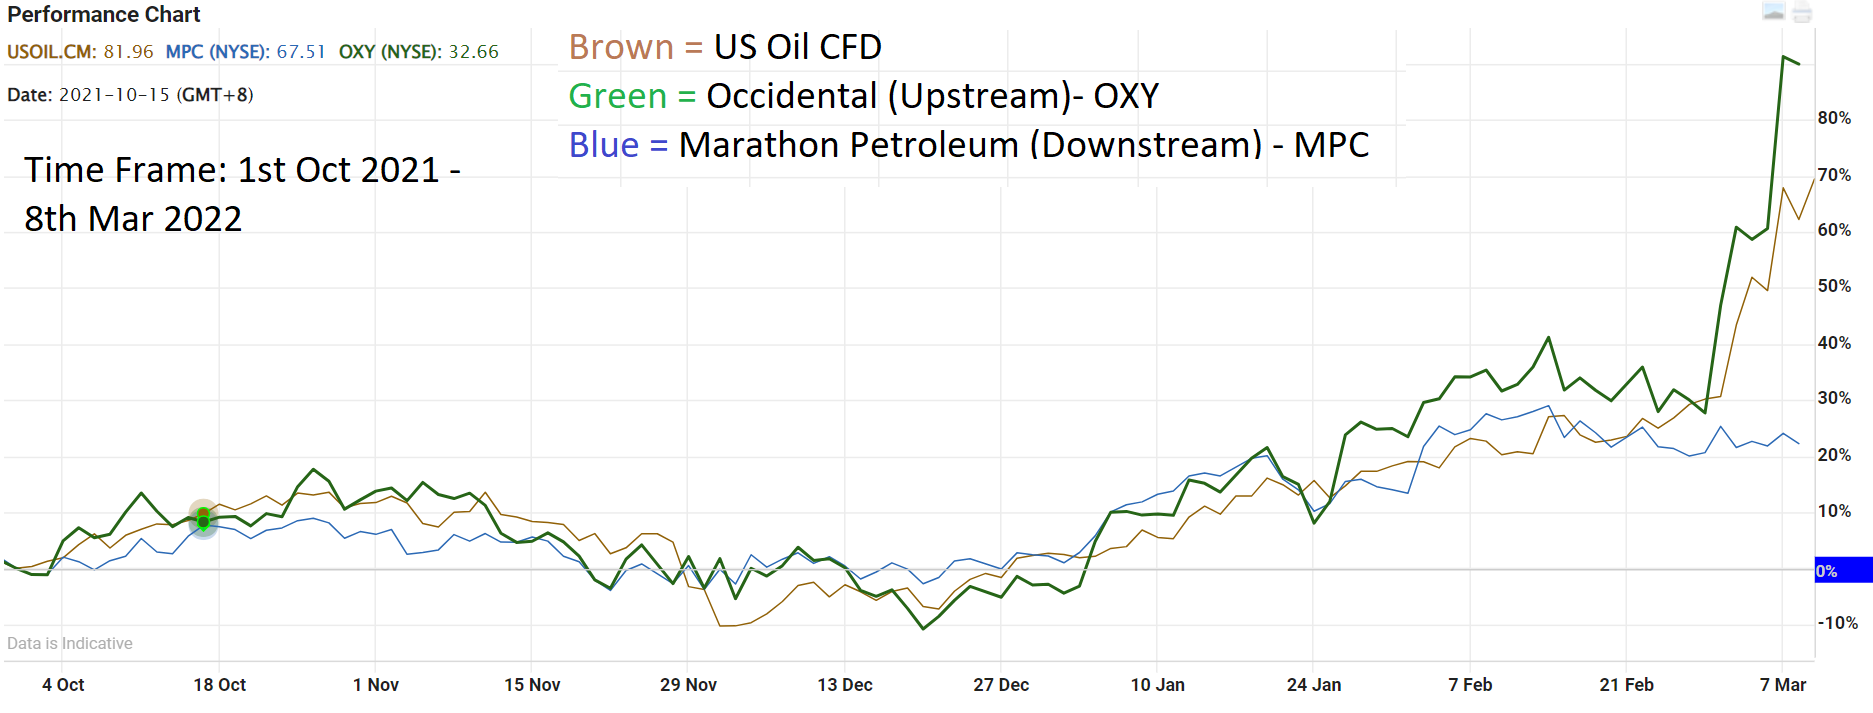
With less direct exposure, a 1% increase in crude oil prices may not result in a 1% increase in upstream and downstream oil companies.
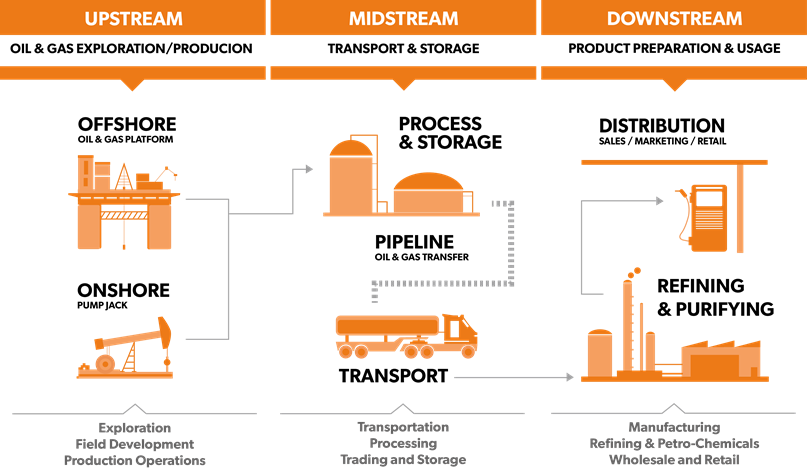 Source: ELAND CABLES [10]
Upstream oil companies such as Occidental –OXY are able to capture the fluctuation of crude oil prices much better compared to downstream-focused oil companies such as Marathon Petroleum – MPC.
The graph below shows the price movement in % terms between Brent Oil, Occidental (OXY) and Marathon Petroleum (MPC) over a time frame of roughly 6 months.
Further, investors can hedge against inflation by investing in sectors that can transfer the rising cost to end-customers without affecting sales. Items with a high degree of price pass-through are petrol and consumer staples (food to cigarettes) [11].
 Source: Poems Platform
Interest Rate Hikes
Interest rate hikes are a macro environment issue that increases the opportunity cost and borrowing cost for consumers and businesses. This directly affects the bond market as prices are inversely correlated to interest rates. As interest rates rise, bond prices fall and bond yields increase [12]. Investors can hedge against increasing interest rates by holding a short position in bonds. One example is ProShares Short 20+ Year Treasury (TBF) is an inverse bond ETF that seeks daily investment results, before fees and expenses, that correspond to the inverse (-1x) of the daily performance of the ICE US Treasury 20+ Years Bond Index [13].
Long duration bonds have a bigger price change when short-term interest rates increase compared to bonds with a shorter duration (10 years and below). One example is ProShares Short 7-10 Year Treasury (TBX). This product seeks daily investment results that correspond to the inverse (-1x) of the daily performance of the ICE US Treasury 7-10 Year Bond Index, which is of a much shorter duration with less price movement.
 Source: Poems Platform
Investors can choose between TBF and TBX as a hedge against an increase in interest rates depending on their investment risk level and hedging objective.
The following table illustrates the effects of daily compounding of the inverse ETF.
Here, at the end of the 10 days, there is no change in the asset price, but the inverse ETF has lost 17% of its value due to daily compounding.
| Day | Asset Price ($) | % Change | Spot Change($) (Asset Price – $100) | Inverse ETF |
| 0 | $100 | 0 | 0 | 100% |
| 1 | $95 | -5% | $-5 | 105% |
| 2 | $85 | -11% | $-15 | 116% |
| 3 | $60 | -29% | $-40 | 150% |
| 4 | $70 | 17% | $-30 | 125% |
| 5 | $75 | 7% | $-25 | 116% |
| 6 | $90 | 20% | $-10 | 93% |
| 7 | $92 | 2% | $-8 | 91% |
| 8 | $98 | 7% | $-2 | 85% |
| 9 | $99 | 1% | $-1 | 84% |
| 10 | $100 | 1% | $0 | 83% |
Using Stocks, Contract for Difference (CFD) or Inverse products/Equity Traded Fund (ETF) to hedge
Hedging can also be done using inverse ETFs which allow for downside protection.
The lowest price an inverse ETF can go is zero, but investors also need to consider the potential risk of daily compounding on inverse ETFs.
Directly hedging by shorting/longing the underlying asset or the use of a Contract for Difference (CFD) can be a better hedge as it fully covers the downside risk.
As investors have different asset allocations, a CFD provide flexible coverage through the ability of Long and Short counters and a wide range of products.
Access to leverage is an attractive feature of a CFD, but investors need to take note of the risks involved. Investors also need to perform due diligence and consider which instrument or asset is best suited for their hedging needs.
Conclusion
In conclusion, investors need to be aware of the tools and ways that hedging can be used to enhance their risk-adjusted returns. They also need to understand the cost and risks involved. Hedging can be valuable to investors when done properly, and it can also help achieve their investment objectives. Having hedging/defensive positions in your portfolio can help reduce the maximum drawdown and can help you weather the volatility of the markets. It also gives investors peace of mind as volatility in a portfolio tends to affect emotions leading to a higher chance of impulsive portfolio adjustments.
How to gain exposure using a Contract for Difference (CFD)?
Investors and traders with a bigger risk appetite can consider using a Contract for Difference (CFD) to gain exposure to stocks.
CFDs are versatile tools for investors, particularly those who take an active approach to investing. They can be used for hedging, short-selling and leveraged trading. A CFD is traded on margin, which means you would need only to put up a fraction of the full value of your trade upfront.
A CFD is an ideal tool for people with less capital who wish to capitalise on the growth potential of certain industries. And it is also for those who wish to take advantage of the latest market movements regardless of direction.
Both potential profits and losses are amplified when you trade a CFD. Hence, a CFD may not be suitable for investors whose investment objective revolves around capital preservation and/or whose risk tolerance is low.
To understand more, refer to our article on “Understanding Contracts for Differences”.
If you want to open a POEMS account, check out this link or scan the QR code below.
 Source: Poems Platform

Explore a myriad of useful features including TradingView chartings to conduct technical analysis with over 100 technical indicators available!
Take this opportunity to expand your trading portfolio with our wide range of products including Stocks, CFDs, ETFs, Unit Trusts and more across 15 global exchanges available for you anytime and anywhere to elevate you as a better trader using our POEMS Mobile 3 App!
Reference:
- [1] https://www.imf.org/external/pubs/ft/fandd/basics/30-inflation.htm#:~:text=Inflation%20is%20the%20rate%20of,of%20living%20in%20a%20country
- [2] https://www.federalreserve.gov/faqs/economy_14400.htm
- [3] https://www.azquotes.com/quote/689484
- [4] https://www.cnbc.com/2022/01/12/ubs-says-the-fed-is-behind-the-curve-in-shrinking-the-balance-sheet.html
- [5] https://www.reuters.com/article/us-usa-fed-idUSKBN1E70IX
- [6] https://www.theguardian.com/business/2019/jun/18/trump-jerome-powell-federal-reserve-interest-rates
- [7] https://www.investopedia.com/terms/g/gap.asp
- [8] https://www.bls.gov/opub/ted/2022/consumer-prices-up-7-5-percent-over-year-ended-january-2022.htm
- [9] https://www.bbc.com/news/business-50981538
- [10] https://www.elandcables.com/the-cable-lab/faqs/faq-what-are-upstream-and-downstream-works-in-the-oil-gas-industry
- [11] https://www.marketwatch.com/picks/inflation-has-hit-a-31-year-high-7-financial-experts-tell-us-how-they-invest-during-periods-of-high-inflation-01637091535#:~:text=Value%20stocks%20that%20are%20in,inflation%20better%20than%20other%20industries.%E2%80%9D
- [12] https://www.fidelity.com.sg/beginners/bond-investing-made-simple/how-interest-rates-affect-bonds
- [13] https://www.proshares.com/our-etfs/leveraged-and-inverse/tbf
Disclaimer
These commentaries are intended for general circulation. It does not have regard to the specific investment objectives, financial situation and particular needs of any person who may receive this document. Accordingly, no warranty whatsoever is given and no liability whatsoever is accepted for any loss arising whether directly or indirectly as a result of any person acting based on this information. Opinions expressed in these commentaries are subject to change without notice. Investments are subject to investment risks including the possible loss of the principal amount invested. The value of the units and the income from them may fall as well as rise. Past performance figures as well as any projection or forecast used in these commentaries are not necessarily indicative of future or likely performance. Phillip Securities Pte Ltd (PSPL), its directors, connected persons or employees may from time to time have an interest in the financial instruments mentioned in these commentaries. Investors may wish to seek advice from a financial adviser before investing. In the event that investors choose not to seek advice from a financial adviser, they should consider whether the investment is suitable for them.
The information contained in these commentaries has been obtained from public sources which PSPL has no reason to believe are unreliable and any analysis, forecasts, projections, expectations and opinions (collectively the “Research”) contained in these commentaries are based on such information and are expressions of belief only. PSPL has not verified this information and no representation or warranty, express or implied, is made that such information or Research is accurate, complete or verified or should be relied upon as such. Any such information or Research contained in these commentaries are subject to change, and PSPL shall not have any responsibility to maintain the information or Research made available or to supply any corrections, updates or releases in connection therewith. In no event will PSPL be liable for any special, indirect, incidental or consequential damages which may be incurred from the use of the information or Research made available, even if it has been advised of the possibility of such damages. The companies and their employees mentioned in these commentaries cannot be held liable for any errors, inaccuracies and/or omissions howsoever caused. Any opinion or advice herein is made on a general basis and is subject to change without notice. The information provided in these commentaries may contain optimistic statements regarding future events or future financial performance of countries, markets or companies. You must make your own financial assessment of the relevance, accuracy and adequacy of the information provided in these commentaries.
Views and any strategies described in these commentaries may not be suitable for all investors. Opinions expressed herein may differ from the opinions expressed by other units of PSPL or its connected persons and associates. Any reference to or discussion of investment products or commodities in these commentaries is purely for illustrative purposes only and must not be construed as a recommendation, an offer or solicitation for the subscription, purchase or sale of the investment products or commodities mentioned.
About the author
Sam Hei Tung
Dealing
Sam graduated from National University of Singapore with a Master of Science in Finance. He personally manages his own investment portfolio and does equity and economic research in his free time. Sam believes that education and information is essential to making good financial decisions.

 Back in Business: The Return of IPOs & Top Traded Counters in March 2024
  From $50 to $100: Unveiling the Impact of Inflation
  Japan’s Economic Resurgence: Unveiling the Tailwinds Behind Nikkei 225’s Record Leap
  What Makes Forex Trading Attractive?


