Popular US Stocks traded in November 2022 December 23, 2022
Start trading on POEMS! Open a free account here!
At a glance:
- Rate hike of 0.75% in November
- Consumer Price Index (CPI) result of 7.7% was lower than the expected 7.9%
- Producer Price Index (PPI) rose by 0.2%, lower than the estimate of 0.4%
- Fed Chair Jerome Powell signalled a 50 bp hike in Dec
- Disney lost 9.13% in November
The three US major indices – Dow Jones, S&P 500 and Nasdaq Composite had similar movements in November. All three indices ended the month higher.
| NASDAQ | DOW JONES | S&P 500 | |
| Month Open | 11,154.74 | 32,862.79 | 3,901.79 | Month Close | 11,468.00 | 34,589.77 | 4,080.11 | Monthly return | 2.81% | 5.26% | 4.57% |
Did November mark the start of a bull market?
November started with the Federal Reserve raising the interest rate by another 75 basis points to a target range of 3.75-4%1. November’s rate hike was within expectations, and the only sign of a slowing rate hike was based on the new statement which said:
The Fed “will take into account the cumulative tightening of monetary policy, the lags with which monetary policy affects economic activity and inflation, and economic and financial developments”.
With this statement, economists were expecting a 50 basis point hike in December.
These expectations were further confirmed when Fed Chair Jerome Powell announced that the Fed was ready to slow down the pace of rate-hikes in December2. Powell said that the central bank no longer needed a 75 basis point hike and that a 50 basis point hike would suffice. The reasons for his stance were the improving supply-chain conditions and a slowdown in interest-rate sensitive sectors. However, the Fed will still continue with a restrictive monetary policy as the labour market is still too strong to be consistent with the Fed’s goal of a 2% inflation. Additionally, the terminal rate will be shifted higher from the 4.6% estimate in September to around 5 – 5.25%.
The effects of the tightening monetary policy is finally being felt after numerous rate hikes as there were lags when the policies are implemented. The CPI in October increased by 7.7% Year-On-Year (YOY), lower than the expected 7.9% YOY3. This news came as a pleasant surprise for the market as inflation was stubborn for the past few months, and did not seem to be waning. After the news was released, the Dow Jones Industrial Average went up by more than 1,000 points.
The PPI in October indicated falling inflation in the coming months; it rose by 0.2% in October, which was below the 0.4% estimate4. One of the main contributors to the slowdown is the fall in wholesale inflation. On a year-over-year basis, the PPI rose by 8% when compared to the all-time peak of 11.7% in March 2022. Despite rising energy costs, the PPI still slowed down, possibly driving inflation lower in the coming months as producers will pass on lower costs to consumers.
Here are some of the more popular US stocks – not ranked in any order – traded by POEMS customers in November 2022.
Walt Disney (NYSE: DIS)
DIS reported less than expected earnings results with an Earnings Per Share (EPS) of USD 0.30 and revenue of USD 20.15 billion which missed estimates of USD 0.50 and USD 21.24 billion respectively. However, Disney+ accrued 12.1 million subscriptions during the period, taking the platform’s total subscriber base to 164.2 million, beating estimates of 160.45 million. Though subscriptions increased, the company warned that strong streaming growth for its Disney+ platform may taper going forward and forecasts revenue growth of less than 10% for the new fiscal year5. Shortly after the earnings call, the markets saw Bob Iger return to DIS as CEO which was met with positivity6. In November, DIS opened at USD 107.70 and fell 9.13% to USD 97.87.
Technical analysis
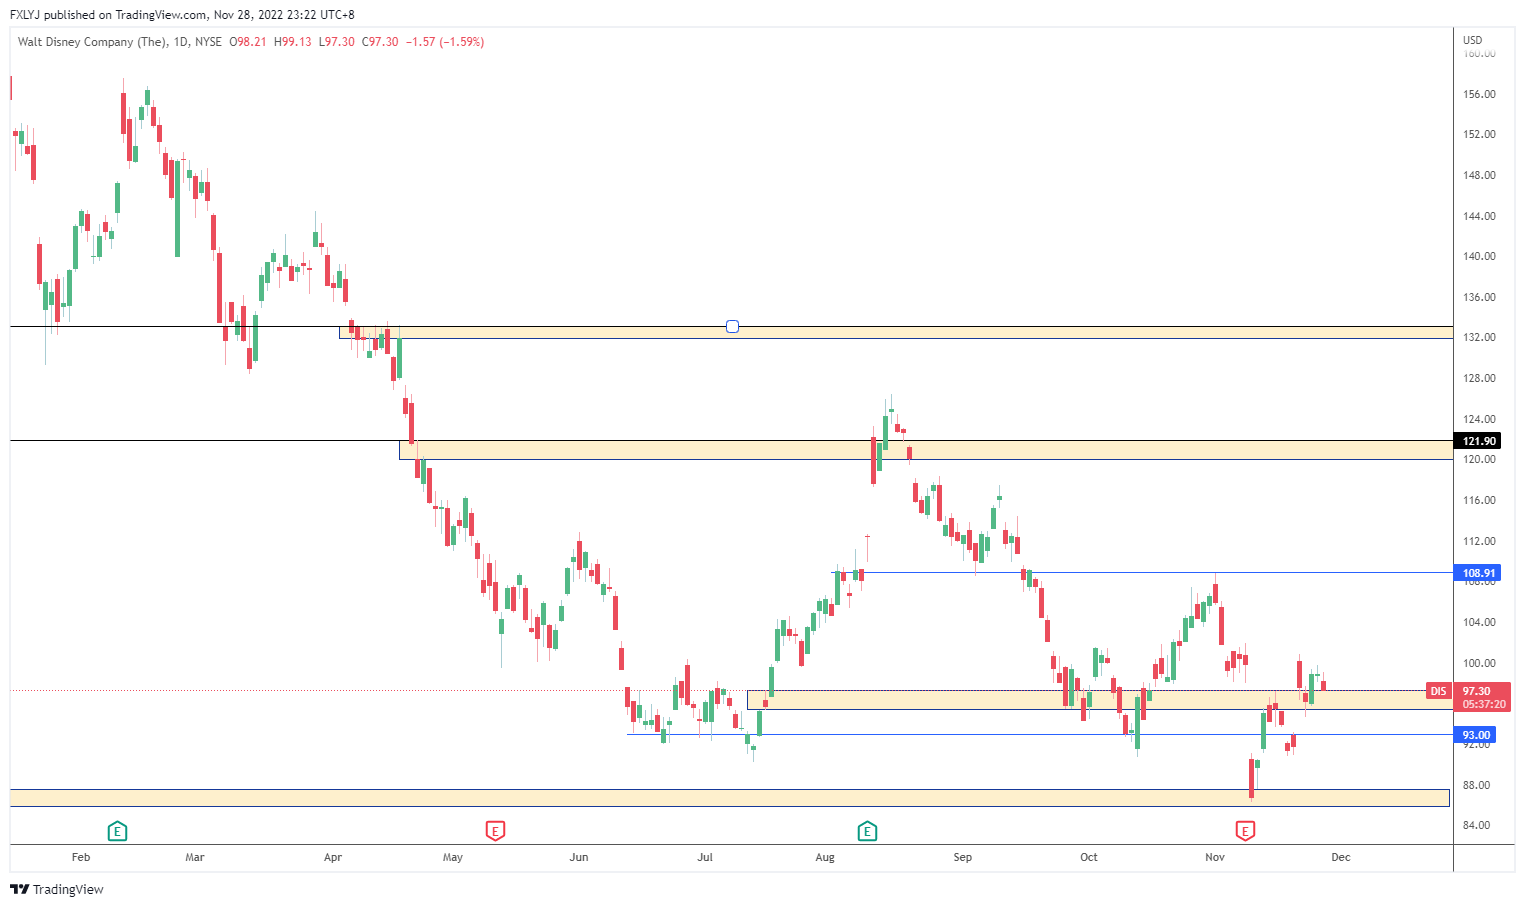
Status: Neutral
Support: USD 93.00 – USD 95.60
Resistance: USD 109.00
Range-bound
Coupang Inc (NYSE: CPNG)
CPNG reported strong earnings for this quarter. EPS of USD 0.05 beat – estimates of – USD 0.04 while revenue of USD 5.1 billion missed estimates of USD 5.21 billion7. Adjusted YTD Earnings Before Interest, Taxes and Amortisation (EBITA) for the business amounted to more than USD 170 million, far exceeding the full-year guidance made at the start of the year of -USD 400 million. The firm did not provide guidance for the next quarter but expects strong demand to continue8. CPNG opened at USD 17.78 and closed higher 9.56 % at USD 19.48.
Technical analysis
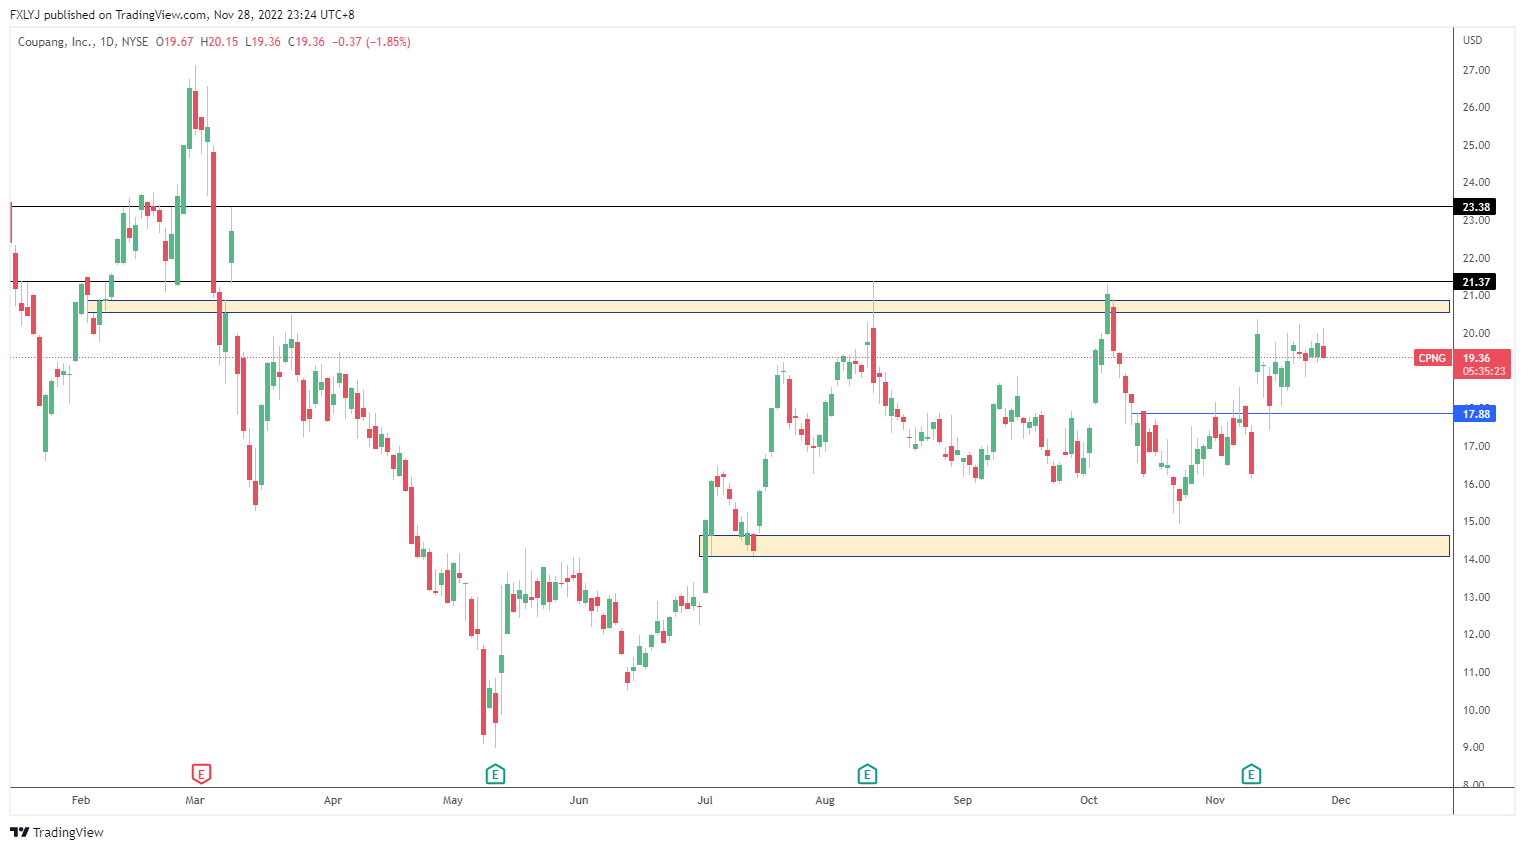
Status: Neutral
Support: USD 14.00 – USD 14.80
Resistance: USD 21.00
Range-bound
Occidental Petroleum Corporation (NYSE: OXY)
OXY reported mixed earnings in November. The EPS of USD 2.44 missed estimates of USD 2.68, but revenue was reported at USD 9.5 billion, beating estimates of USD 9.44 billion9. The firm’s oil and gas business delivered a production of nearly 1.2 million Barrels of Oil Equivalent (BOE) per day, exceeding the midpoint guidance by approximately 25,000 BOE/per day. The key drivers of their performance were from the Rockies and Gulf of Mexico, allowing them to exceed their third-quarter guidance. Due to the firm’s better-than-expected performance, it raised its full year production for oil and gas by 5000 BOE/day to 1.16 million/day, while full-year capital guidance remained unchanged for 202210. Opening at USD 74.02 at the beginning of the month, OXY fell by 6.12%, closing at USD 69.49.
Technical analysis
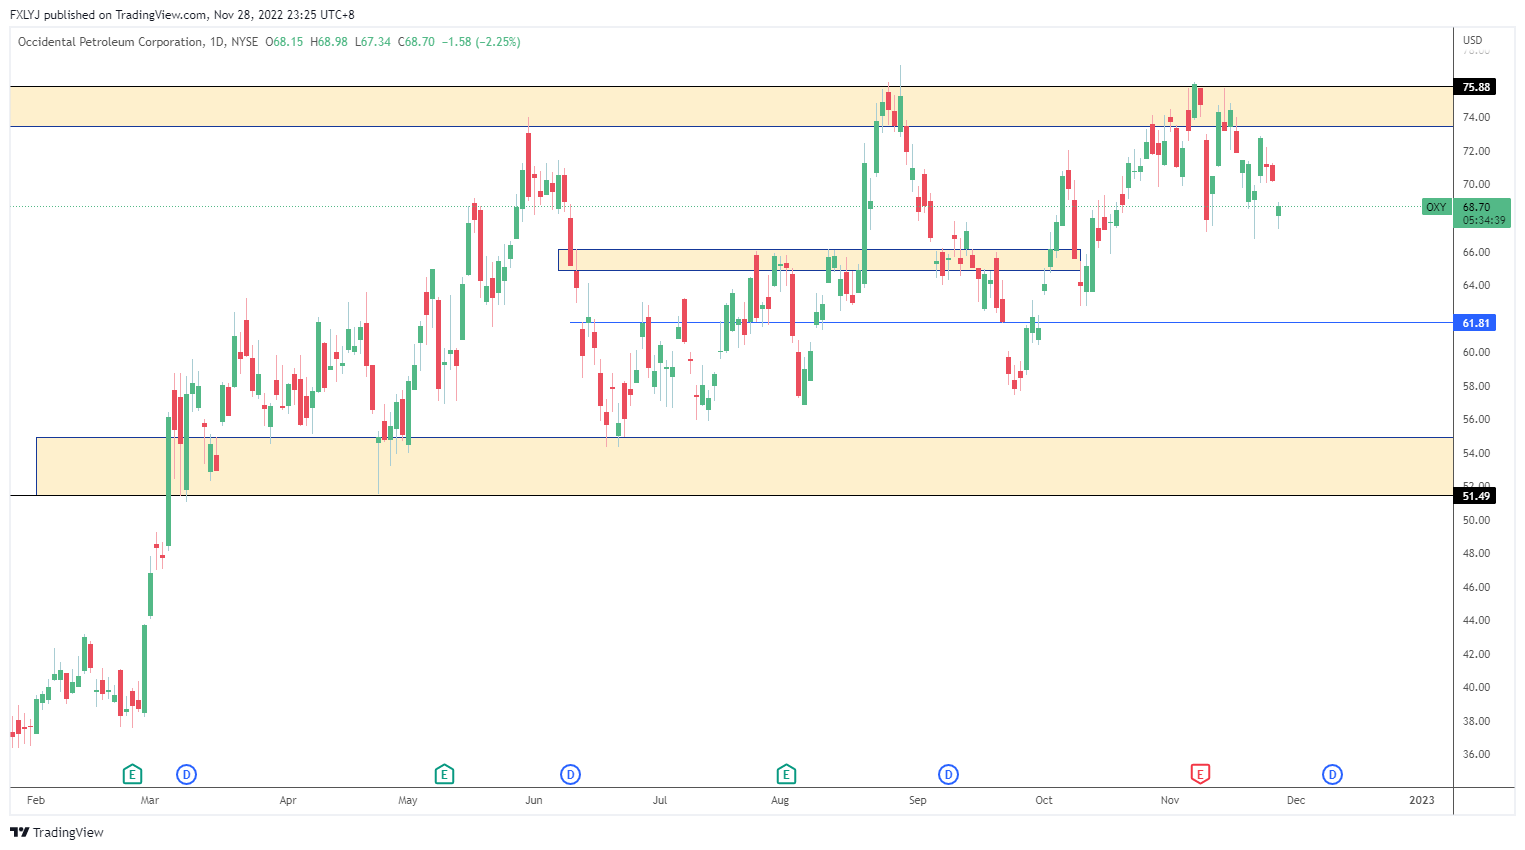
Status: Neutral
Support: USD 61.80 – USD 63.20
Resistance: USD 76.00
Range-bound
Roblox Corporation (NYSE: RBLX)
RBLX reported mixed earnings in November. The EPS of -USD 0.50 missed estimates of -USD 0.30, revenue was reported at USD 702 million, beating estimates of USD 686 million. The revenue figure, also known as bookings in RBLX rose by 10% year-over-year; average daily active users of 58.8 million were up 24% from the previous year11>. RBLX did not provide guidance for the next quarter, but mentioned about hiring more talents to drive innovations with USD 3billion cash in the bank for 2023. RBLX started the month at USD 45.51 and fell 30.19% to USD 31.77.
Technical analysis
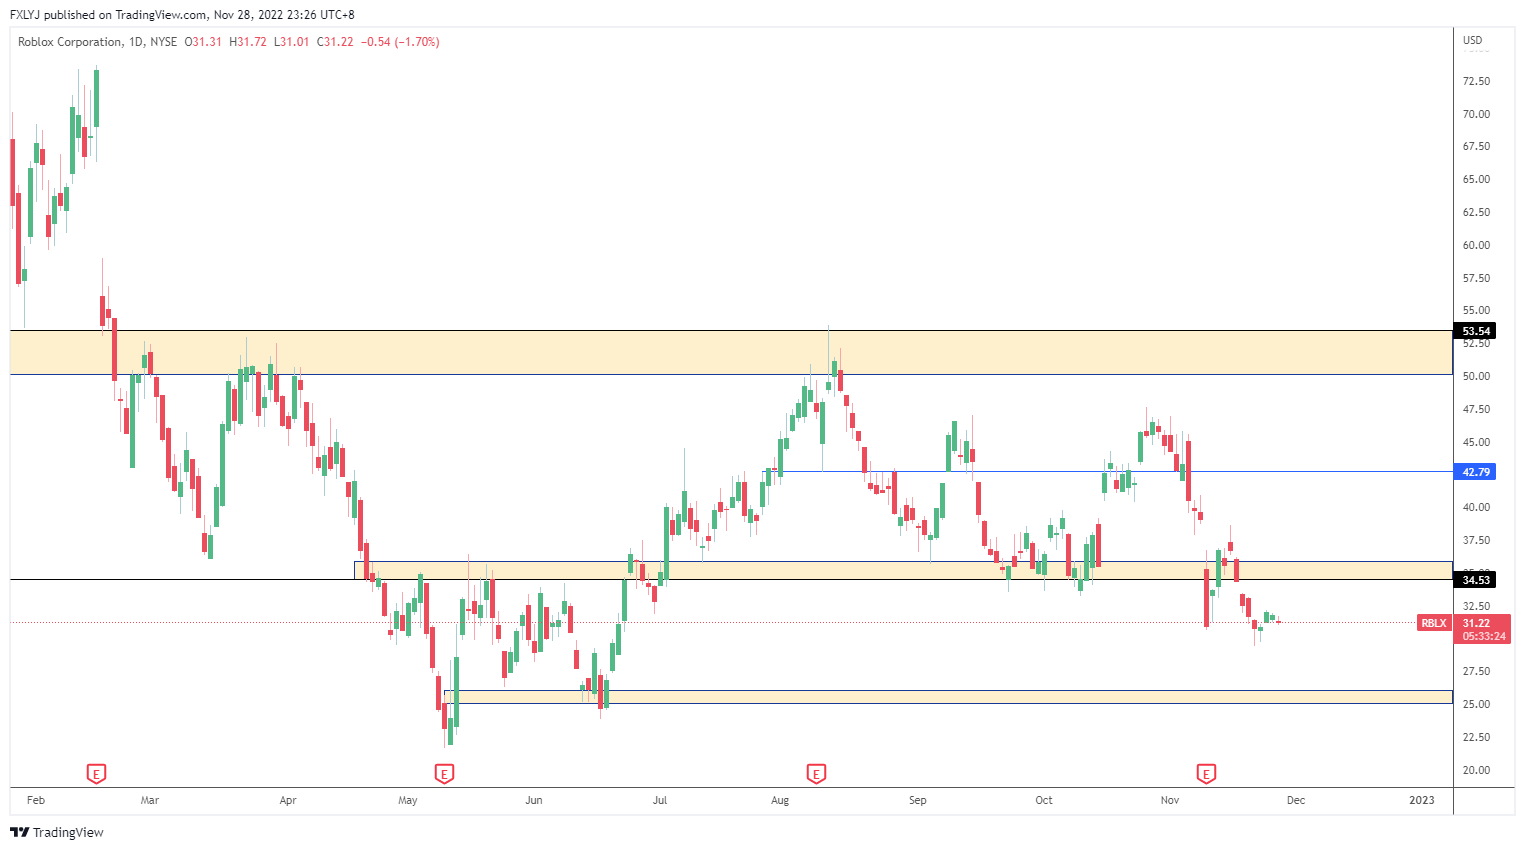
Status: Neutral
Support: USD 25.00 – USD 26.00
Resistance: USD 36.00
Range-bound
Rivian Automotive (NASDAQ: RIVN)
RIVN Q3 earnings results missed expectations for both EPS and revenue. EPS was reported at USD 1.57 versus the expected value of USD 1.82. Revenue came in at USD 536 million versus the expected value of USD 553.6 million. The company mentioned that inflation had been a factor in its supply chain but reaffirmed its 25,000 vehicle production target for 2022, and cut its guidance for its full year capital expenditures from USD 2 billion to USD 1.75 billion. Currently, RIVN has over 114,000 pre-orders for its R1-series trucks and SUVs12. RIVN opened at USD 36.15 and fell to USD 32.04, a fall of 11.30%.
Technical analysis
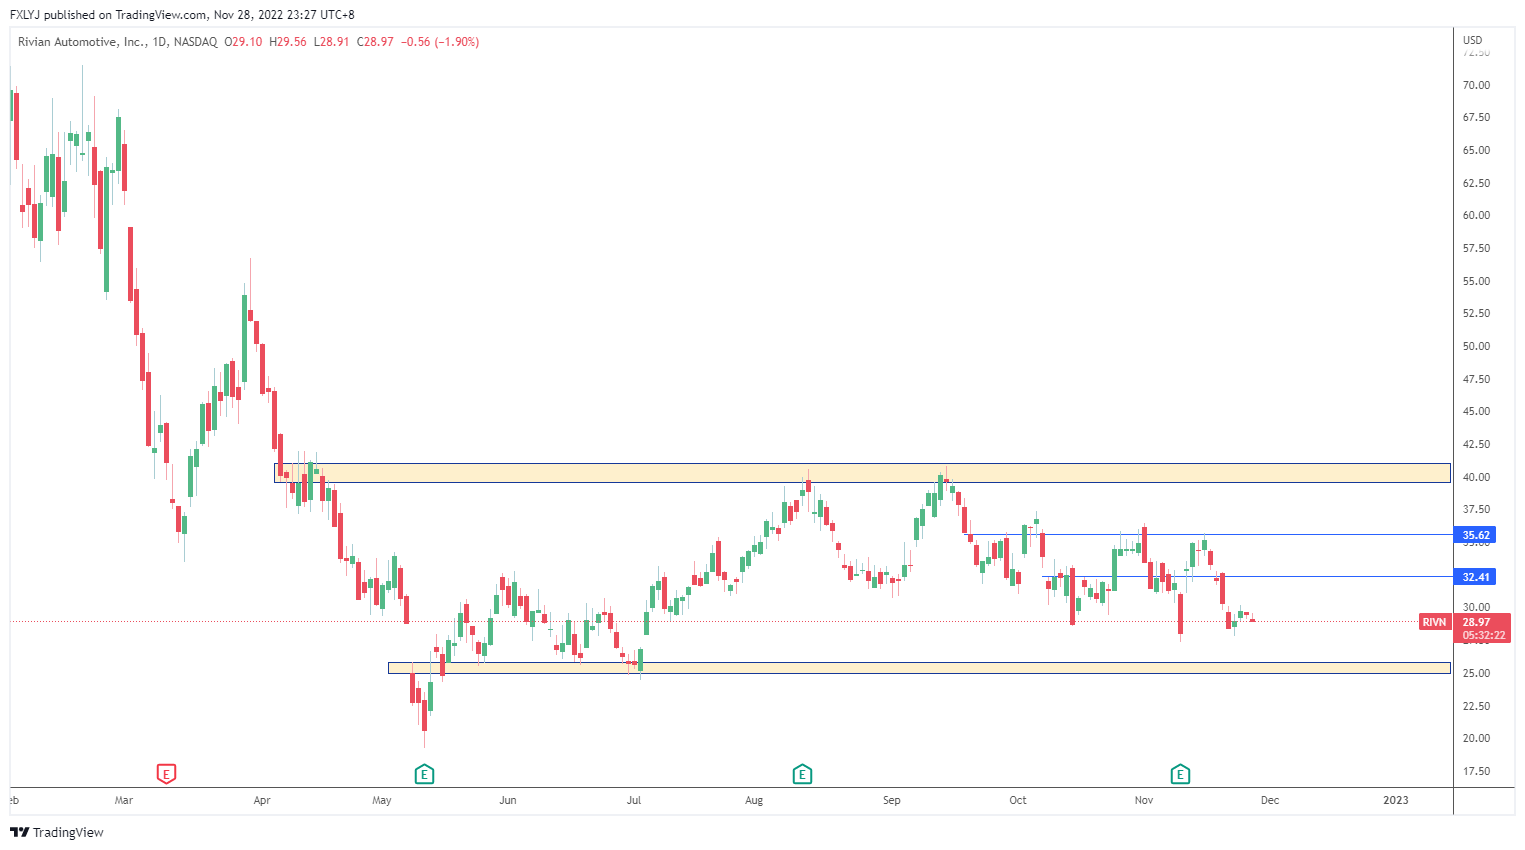
Status: Bullish
Support: USD 25.00 – USD 26.00
Resistance: USD 32.40
Range-bound
Nio Inc (NASDAQ: NIO)
NIO Q3 earnings results missed expectations for both EPS and revenue despite having a higher sales revenue compared to a year ago. EPS was reported at -RMB2.11(USD 0.30) versus the expected value of -RMB 1.08(USD 0.15), revenue came in at RMB13 billion(USD 1.8 billion) versus the expected value RMB14 billion(USD 1.94 billion)13. The company was able to deliver 31,607 vehicles, 29% more than from a year ago14, however the year-over-year margin decline was due to lower sales of regulatory credits and higher expenditure on its vehicles, charging and service networks. The firm guided Q4 to deliver about 43,000 to 48,000 vehicles, generating a total revenue of USD 2.4 billion to USD 2.7 billion.15
The firm also announced a partnership with Tencent, its largest institutional shareholder, to leverage the tech giant’s resources to accelerate the development of autonomous driving technology16. NIO opened at USD 10.33 and reached USD 12.78, a 23.72% gain.
Technical analysis
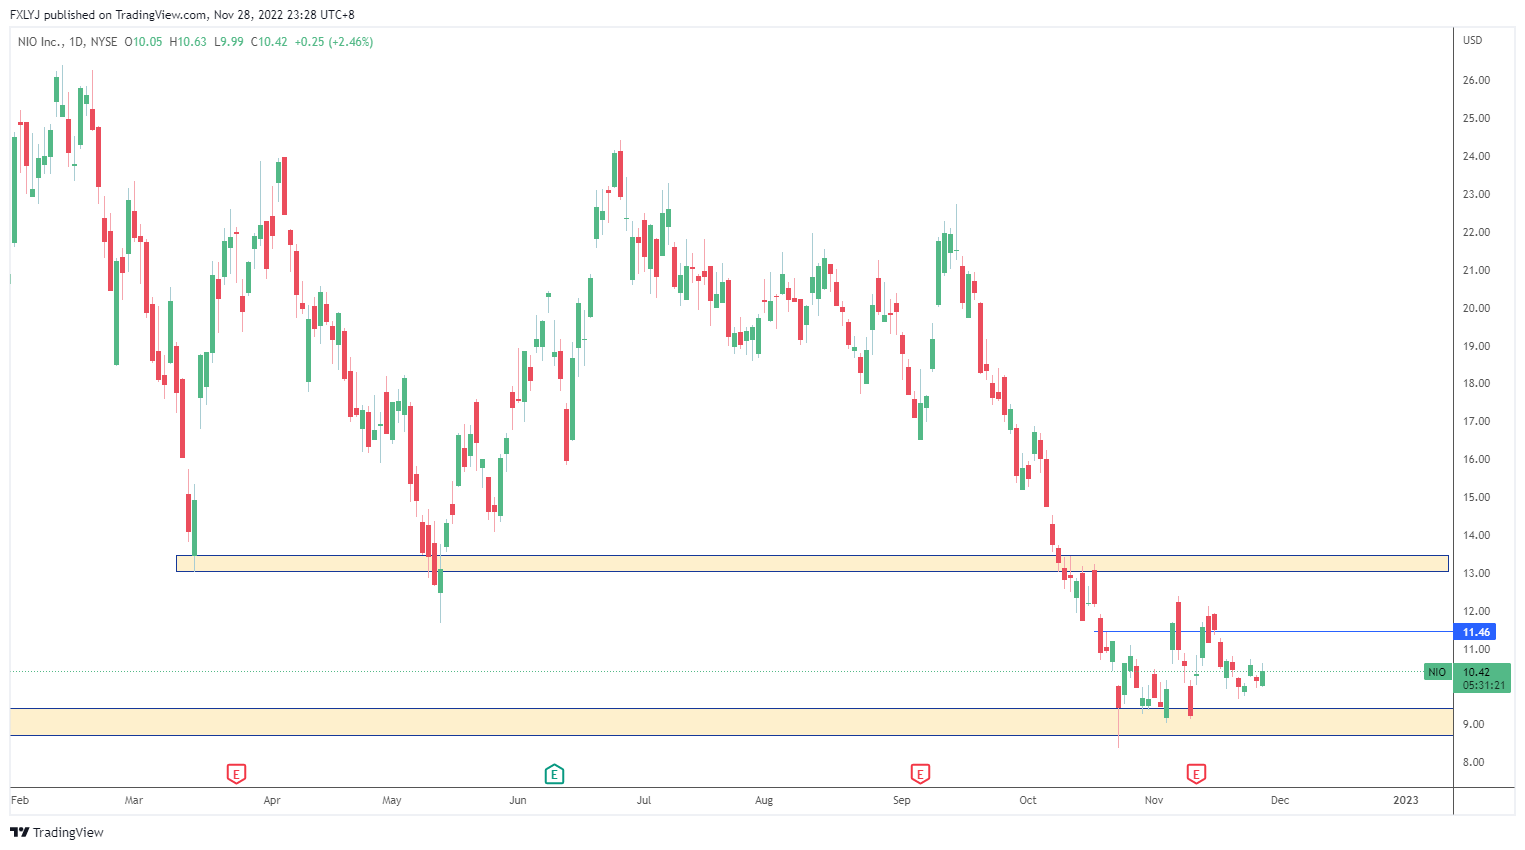
Status: Neutral
Support: USD 8.70 – USD 9.40
Resistance: USD 11.50
Range-bound but inclined towards the bearish side
The Volatility Index (VIX) which shows the implied volatility of S&P 500 Index options is closely followed. VIX is contrary to the performance of the market which leads to the idea of investing in the market when the VIX is high, and liquidating when the VIX is low. Investing directly in VIX is impossible but investors are able to do so through ETFs. Here are 2 ETFs that track market volatility:
VIX Mid-Term Futures ETF (NYSE-ARCA: VIXM)
VIXM is an ETF that tracks the performance of the S&P 500 VIX Mid-Term Futures Index17. The ETF is intended for short term use and investors can profit from the increase in expected volatility of the S&P 500. VIXM commenced on 3 January 2011 with an expense ratio of 0.85%. VIXM’s year-to-date performance as of 29 November 2022 is 3.78%. VIXM opened at USD 32.86 and lost 5.90% to close at USD 30.92 in November.
Technical analysis
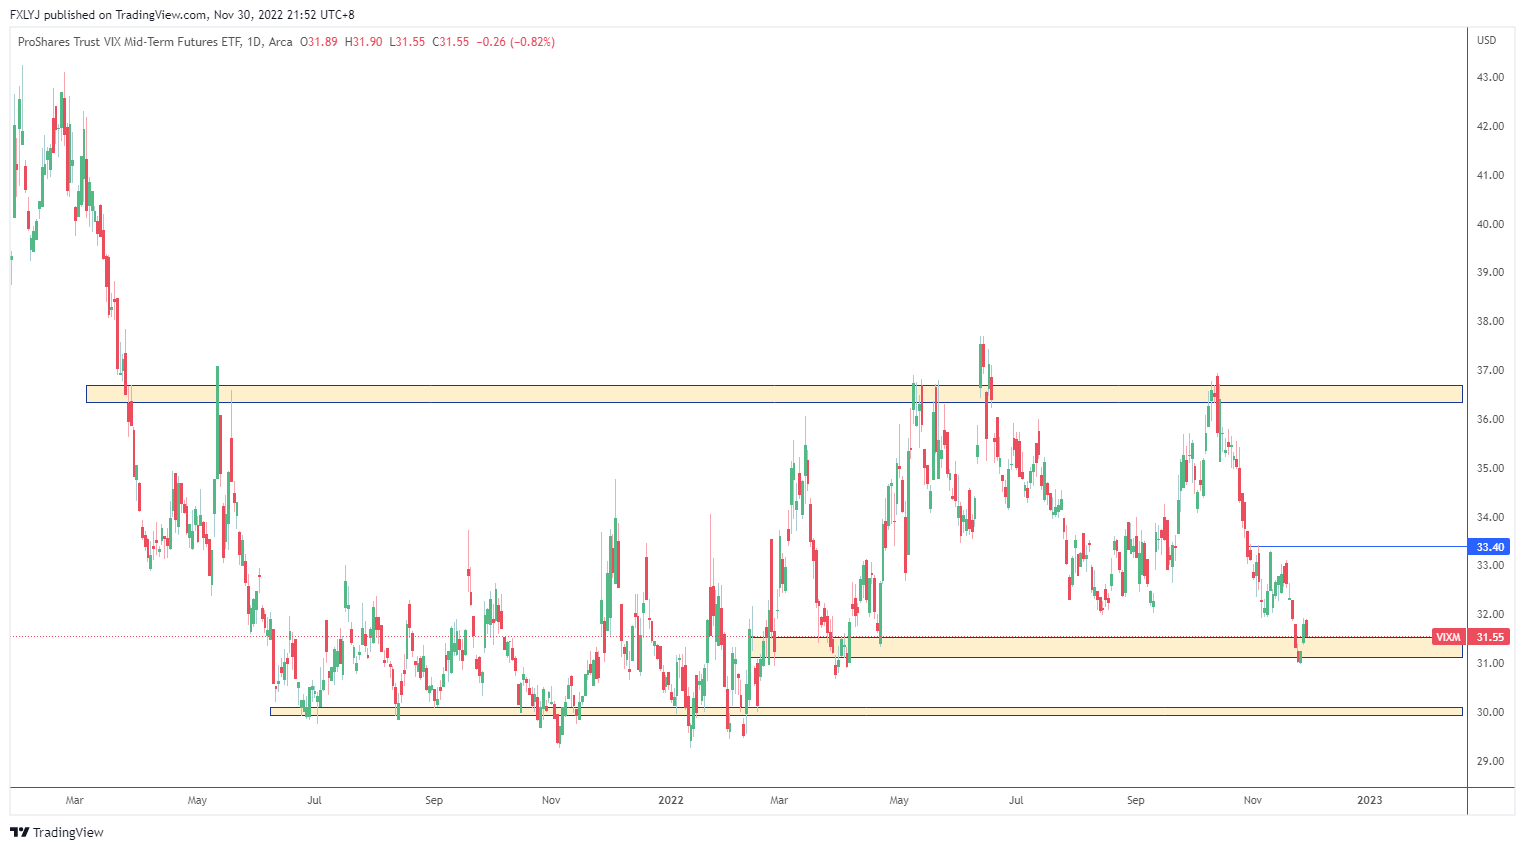
Status: Neutral
Support: USD 30.67 – USD 31.55
Resistance: USD 33.40
Range-bound
Simplify Volatility Premium ETF (NYSE-ARCA: SVOL)
SVOL is an ETF that seeks to provide investment results, before fees and expenses, that correspond to approximately one-fifth to three-tenths (-0.2x to -0.3x) of the inverse performance of the Cboe Volatility Index (VIX) short-term futures index while also seeking to mitigate extreme volatility18. SVOL is the first ETF to provide inverse VIX exposure. SVOL commenced on 12 May 2021 with an expense ratio of 0.54%. SVOL’s year-to-date performance as of 29 November 2022 is -20.76%. SVOL opened at USD 21.36 and gained 2.53% to close at USD 21.90 in November.
Technical analysis
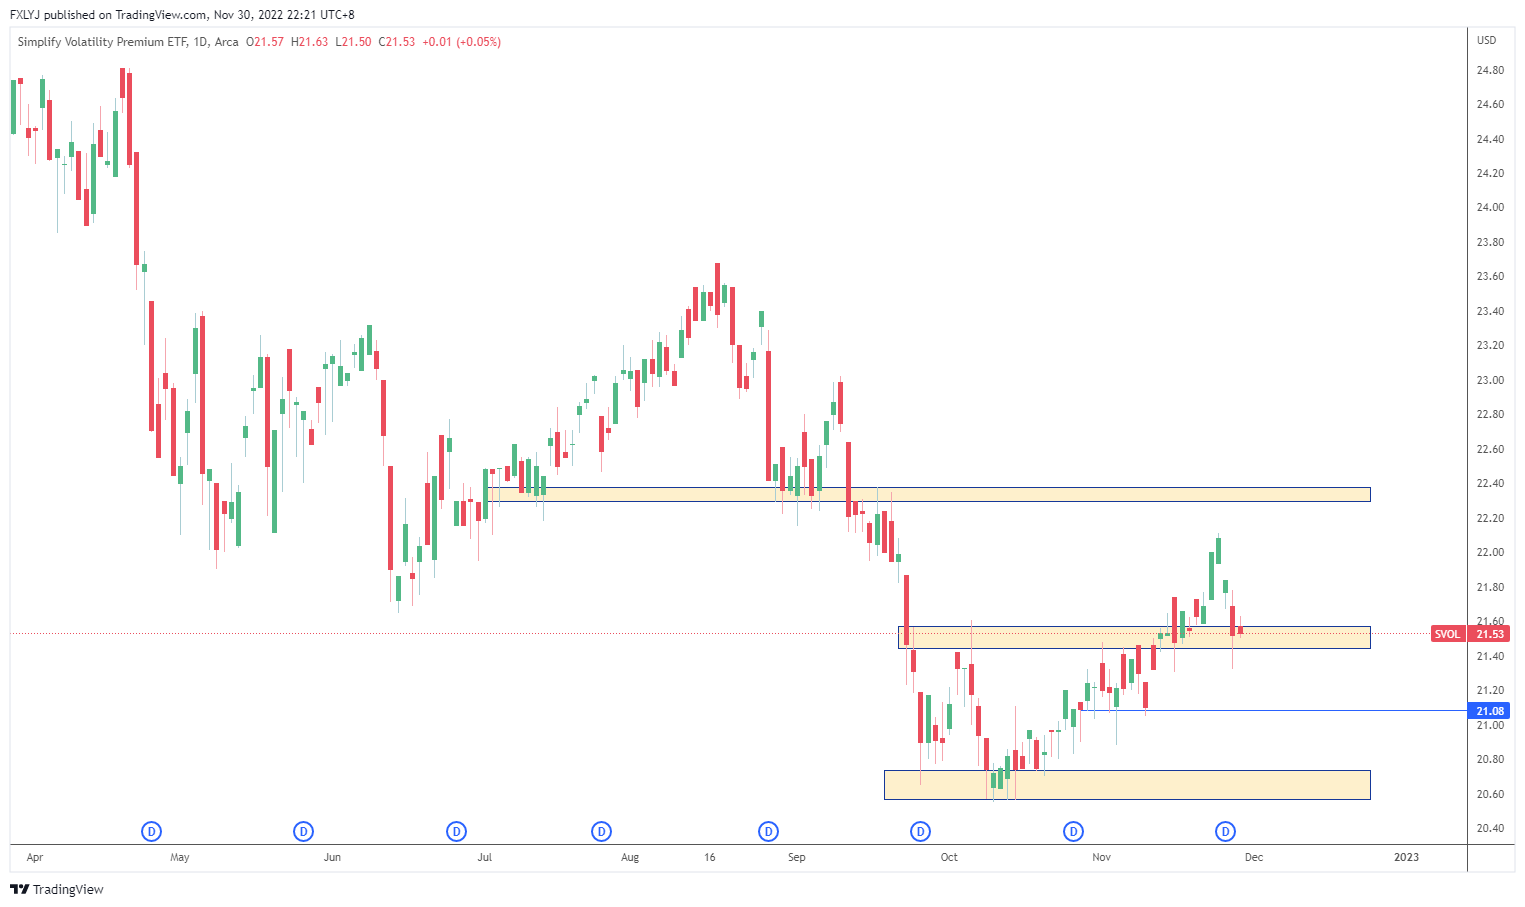
Status: Neutral
Support: USD 21.08 – USD 21.55
Resistance: USD 22.40
Bloomberg analysts’ recommendations
The table below shows the consensus ratings and average ratings of all analysts updated on Bloomberg in the last 12 months. Consensus ratings have been computed by standardising analysts’ ratings from a scale of 1 (Strong Sell) to 5 (Strong Buy). The table also shows a number of analysts’ recommendations to buy, hold or sell the stocks, as well as their average target prices.
| Security | Consensus Rating | BUY | HOLD | SELL | 12 Mth Target Price (US$) |
| Walt Disney (NYSE: DIS) | 4.7 | 28 (84.8%) | 5 (15.2%) | 0 | 130.97 |
| Nio Inc (NASDAQ: NIO) | 4.65 | 32 (86.5%) | 4 (10.8%) | 1 (2.7%) | 19.75 |
| Coupang Inc (NYSE: CPNG) | 4.13 | 11 (68.8%) | 3 (18.8%) | 2 (12.5%) | 24.01 |
| Rivian Automotive (NASDAQ: RIVN) | 4.1 | 13 (65%) | 5 (25%) | 2 (10%) | 45.93 |
| Roblox Corporation (NYSE: RBLX) | 3.68 | 16 (51.6%) | 10 (32.3%) | 5 (16.1%) | 39.23 |
| Occidental Petroleum Corporation (NYSE: OXY) | 3.35 | 7 (26.9%) | 17 (65.4%) | 2 (7.7%) | 76.12 |
To round up
There is finally progress made in the fight against inflation as the effects from the numerous monetary policy tightening measures have started to kick in with house prices and rent falling. Taking these into account, the Fed is likely working towards reducing their rate hikes to 50 basis points in the upcoming December FOMC meeting. The market is en route to a bullish quarter but is still down from the January highs.
Get yourself educated! Join our free webinar here!

With our newly launched POEMS Mobile 3 Trading App
Explore a myriad of useful features including TradingView chartings to conduct technical analysis with over 100 technical indicators available!
Take this opportunity to expand your trading portfolio with our wide range of products including Stocks, CFDs, ETFs, Unit Trusts and more across 15 global exchanges available for you anytime and anywhere to elevate you as a better trader using our POEMS Mobile 3 App!
Reference:
- [1] “Fed approves 0.75-point hike to take rates to highest since 2008 and ….” 2 Nov. 2022
- [2] “Fed Chair Powell says smaller interest rate hikes could start …..” 30 Nov 2022
- [3] “US Inflation Slows More Than Forecast, Gives Fed Downshift Room.” 10 Nov. 2022
- [4] “Wholesale prices rose 0.2% in October, less than expected … – CNBC.” 15 Nov. 2022
- [5] “Disney (DIS) earnings Q4 2022 – CNBC.” 8 Nov. 2022
- [6] “Disney Stock Rises After Bob Iger Named CEO to Replace Chapek.” 21 Nov. 2022
- [7] “CPNG Earnings Date & Report (Coupang LLC) – Investing.com.”
- [8] “Coupang, Inc. (CPNG) Q3 2022 Earnings Call Transcript.” 10 Nov. 2022
- [9] “OXY Earnings Date & Report (Occidental Petroleum) – Investing.com.”
- [10] “Occidental Petroleum (OXY) Q3 2022 Earnings Call Transcript.” 9 Nov. 2022
- [11] “Roblox shares sink after reporting bigger loss than expected – CNBC.” 9 Nov. 2022
- [12] “Rivian (RIVN) earnings Q3 2022 – CNBC.” 9 Nov. 2022
- [13] “NIO Earnings Date & Report (Nio Inc Class A ADR) – Investing.com.”
- [14] “NIO Inc. Reports Unaudited Third Quarter 2022 Financial Results.” 10 Nov. 2022
- [15] “Nio Q3 2022 earnings revenue loss guidance – CNBC.” 10 Nov. 2022
- [16] “NIO partners with Tencent to expedite smart driving R&D – CnEVPost.” 29 Nov. 2022
- [17] “VIXM | VIX Mid-Term Futures ETF – ProShares.”
- [18] “SVOL Simplify Volatility Premium ETF.”
Disclaimer
These commentaries are intended for general circulation. It does not have regard to the specific investment objectives, financial situation and particular needs of any person who may receive this document. Accordingly, no warranty whatsoever is given and no liability whatsoever is accepted for any loss arising whether directly or indirectly as a result of any person acting based on this information. Opinions expressed in these commentaries are subject to change without notice. Investments are subject to investment risks including the possible loss of the principal amount invested. The value of the units and the income from them may fall as well as rise. Past performance figures as well as any projection or forecast used in these commentaries are not necessarily indicative of future or likely performance. Phillip Securities Pte Ltd (PSPL), its directors, connected persons or employees may from time to time have an interest in the financial instruments mentioned in these commentaries. Investors may wish to seek advice from a financial adviser before investing. In the event that investors choose not to seek advice from a financial adviser, they should consider whether the investment is suitable for them.
The information contained in these commentaries has been obtained from public sources which PSPL has no reason to believe are unreliable and any analysis, forecasts, projections, expectations and opinions (collectively the “Research”) contained in these commentaries are based on such information and are expressions of belief only. PSPL has not verified this information and no representation or warranty, express or implied, is made that such information or Research is accurate, complete or verified or should be relied upon as such. Any such information or Research contained in these commentaries are subject to change, and PSPL shall not have any responsibility to maintain the information or Research made available or to supply any corrections, updates or releases in connection therewith. In no event will PSPL be liable for any special, indirect, incidental or consequential damages which may be incurred from the use of the information or Research made available, even if it has been advised of the possibility of such damages. The companies and their employees mentioned in these commentaries cannot be held liable for any errors, inaccuracies and/or omissions howsoever caused. Any opinion or advice herein is made on a general basis and is subject to change without notice. The information provided in these commentaries may contain optimistic statements regarding future events or future financial performance of countries, markets or companies. You must make your own financial assessment of the relevance, accuracy and adequacy of the information provided in these commentaries.
Views and any strategies described in these commentaries may not be suitable for all investors. Opinions expressed herein may differ from the opinions expressed by other units of PSPL or its connected persons and associates. Any reference to or discussion of investment products or commodities in these commentaries is purely for illustrative purposes only and must not be construed as a recommendation, an offer or solicitation for the subscription, purchase or sale of the investment products or commodities mentioned.
About the author
Global Markets Desk US Dealing Team
The Global Markets Desk US Dealing team specialise in handling the US Markets in the Global Markets Desk.
Their responsibilities and capabilities extend from managing and taking orders from clients trading in the US market, to content generation, Technical Analysis and providing educational content to POEMS clients.

 Back in Business: The Return of IPOs & Top Traded Counters in March 2024
  From $50 to $100: Unveiling the Impact of Inflation
  How to soar higher with Positive Carry!
  Why 2024 Offers A Small Window of Opportunity and How to Position Yourself to Capture It


