Why Pros Prefer Indexes over Individual Counters for Trading and Investing November 10, 2022
This article will explore:
- Why veteran investors prefer to invest in indexes over individual companies in for trading and investing
- Advantages of using Indexes
- The 2 main ways indexes are weighted & their sector weightage of key indexes
- The current macro news and headwinds market participants need to know about and how to potentially take advantage of them
- Conclusion

“Never put all your eggs in one basket”
As suggested by Modern Portfolio Theory, investors can optimise the expected returns of a portfolio by reducing unsystematic risk (diversifiable risk) through diversification. The theory states that investors are only rewarded based on systematic risk (market risk) of their portfolio, and that company specific risk (diversifiable risk) are not compensated as it is diversifiable.
Stock picking is incredibly difficult
In 2008, veteran investor Warren Buffet challenged the Hedge Fund Industry of professional stock pickers with large amounts of resources and information, to a $1 million bet. The challenge was to see who would give investors the most returns after 10 years – active investing (Hedge Funds) or passive investing (index funds) after fees. The index fund (Vanguard 500 Index Fund) beat the hedge fund (Protégé Partners LLC) which admitted defeat in 2015 [1]. Stock picking be it for trading or investing carries a lot of unforeseen risks compared to the index.
Lower cost and spreads
The index with ETFs or Contract for Differences (CFDs) offers high diversity at incredibly low costs (0.03%) [2], compared to buying large amounts of individual stocks (>30) [3] to achieve a similar level of benefit from diversification. Index counters have high liquidity, result in lower spreads and offer the capacity to easily short sell, beneficial to both traders and investors. Indexes are reviewed and rebalanced on average 1-4 times a year.
Identifying the 2 main ways indexes are weighted
Price-Weighted Index
Prices-weighted indexes weigh their components depending on their share prices. Higher-priced shares will result in a higher weighting. The Nikkei 225 is a price-weighted index comprising Japan’s top 225 blue-chip companies traded on the Tokyo Stock Exchange [4]. The tables below show the top 5 companies with the highest weightage in the Nikkei 225 price-weighted index and the sector weightage (As of 28 October 2022).
| Name | Weightage | Price (¥) | Market Cap (¥) |
| FAST RETAILING LTD | 10.32% | 83,040.00 | 8.93T | TOKYO ELECTRON LTD | 4.90% | 39,450.00 | 6.20T | SOFTBANK GROUP CORP | 4.44% | 5,949.00 | 10.53T | KDDI CORP | 3.28% | 4,402.00 | 10.07T | DAIKIN INDUSTRIES LTD | 2.72% | 21,905.00 | 6.45T |
Source: BlackRock https://www.blackrock.com/jp/individual-en/en/products/251897/ishares-nikkei-225-fund
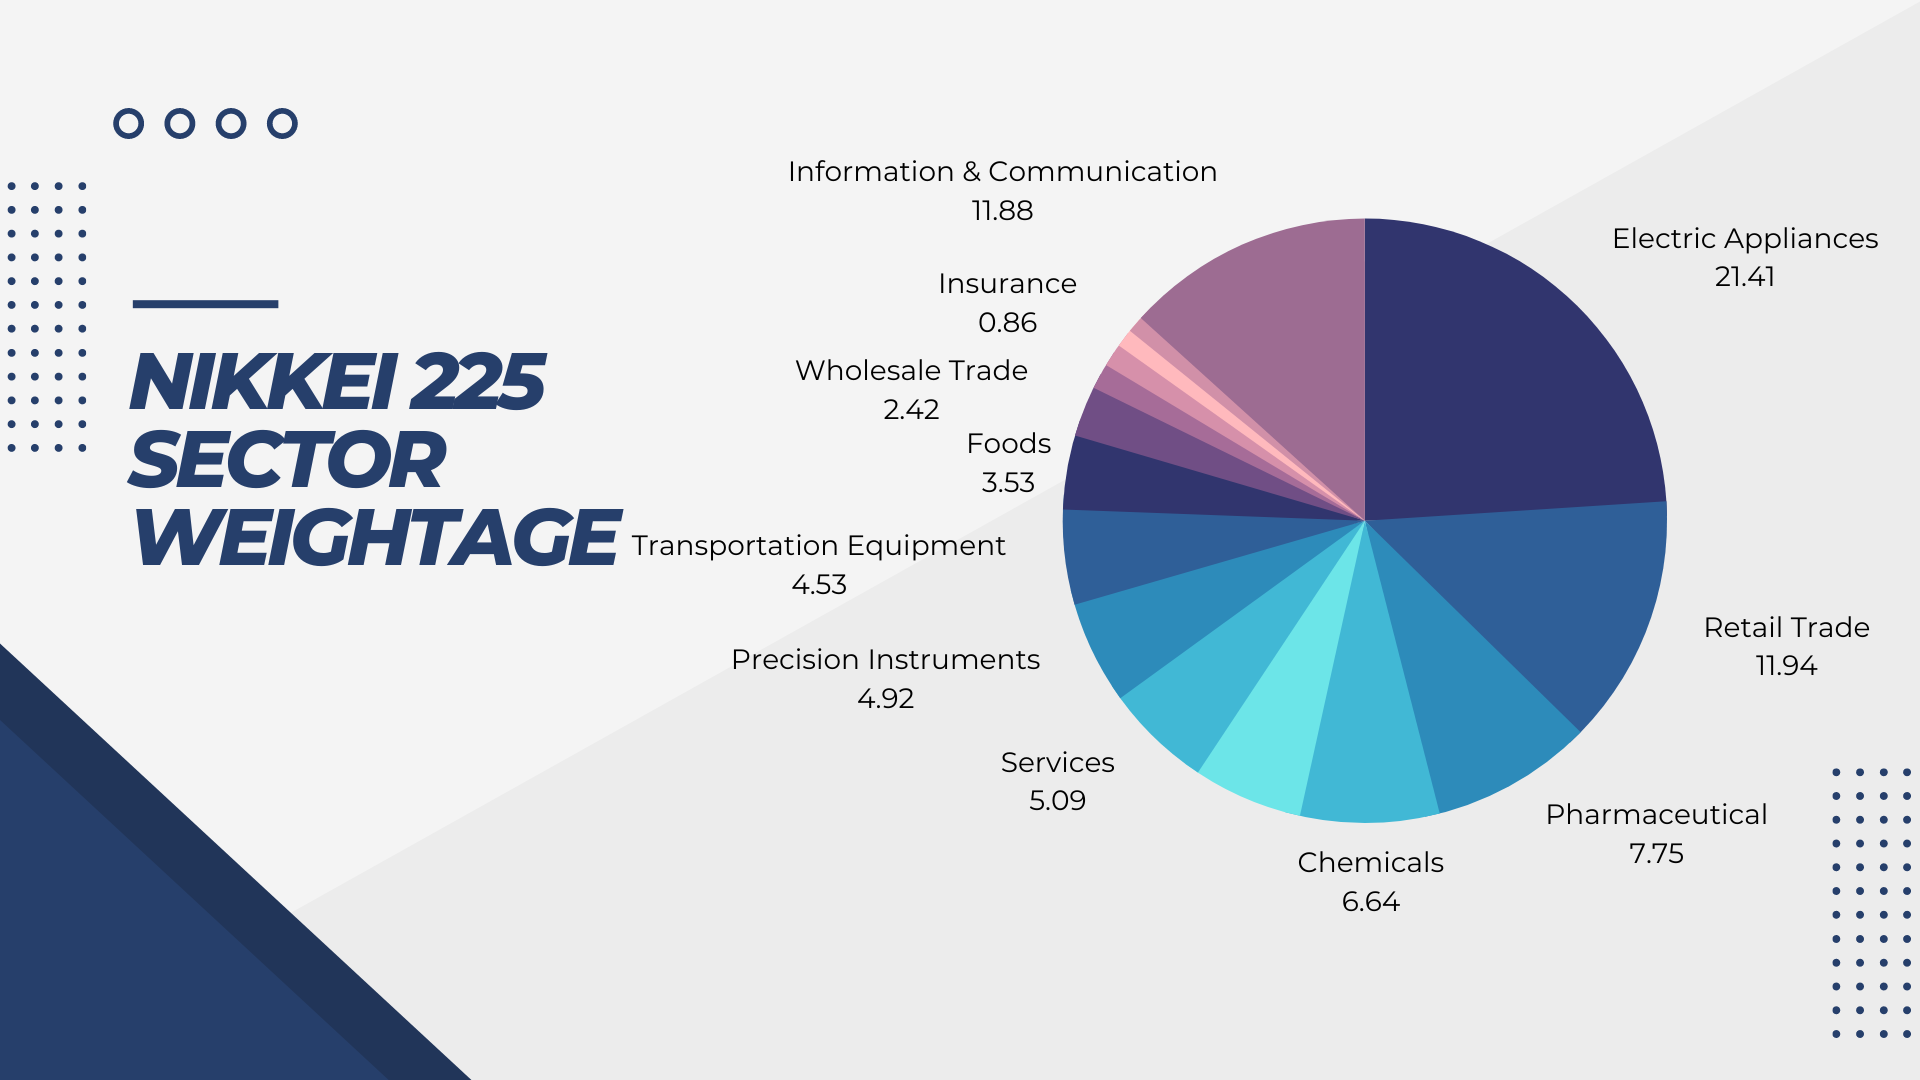
Softbank Group and KDDI Corp’s stock prices are lower than Daikin Industries but have higher weightage due to a stock split. Thus, it can be seen that by investing in the Nikkei 225 Index, about ~10% will go to Fast Retailing Ltd as it has the highest share price even though it does not have the largest market capitalisation. Movements on higher priced stocks will overshadow movements on lower priced stocks in a price-weighted index like the Nikkei 225 (Japan 225) and Dow Jones (Wall Street) Index.
Market Cap – Weighted Index
The Market Capitalisation Weighted Index is a more widely used method of constructing indexes, as companies with higher market value (share price x total number of shares outstanding) have a higher weightage over companies with a lower market cap. Standard and Poor’s 500 (S&P500 / US SP 500) is regarded as the best gauge of large-cap US equities [5], and is one of the most well-known indexes in the world. There are also market cap weighted indexes in Asia, ranging from China’s A50 Index and Hong Kong’s Hang Seng Index, to the Hang Seng Tech Index and Singapore’s Straits Times Index. The table below shows the top 5 with the highest weightage in the S&P500 market cap weighted index and sector weightage (As of 28 October 2022)
| Name | Market Value USD | Weightage | Price USD |
| APPLE INC | 2.4T | 7.08% | 152.34 | MICROSOFT CORP | 1.73T | 5.75% | 250.66 | ALPHABET INC CLASS A + C | 1.24T | 3.66% | 104.48 | AMAZON COM INC | 1.18T | 3.29% | 120.6 | TESLA INC | 703.90B | 1.82% | 222.41 |
Source: Black Rock https://www.blackrock.com/us/individual/products/239726/ishares-core-sp-500-etf
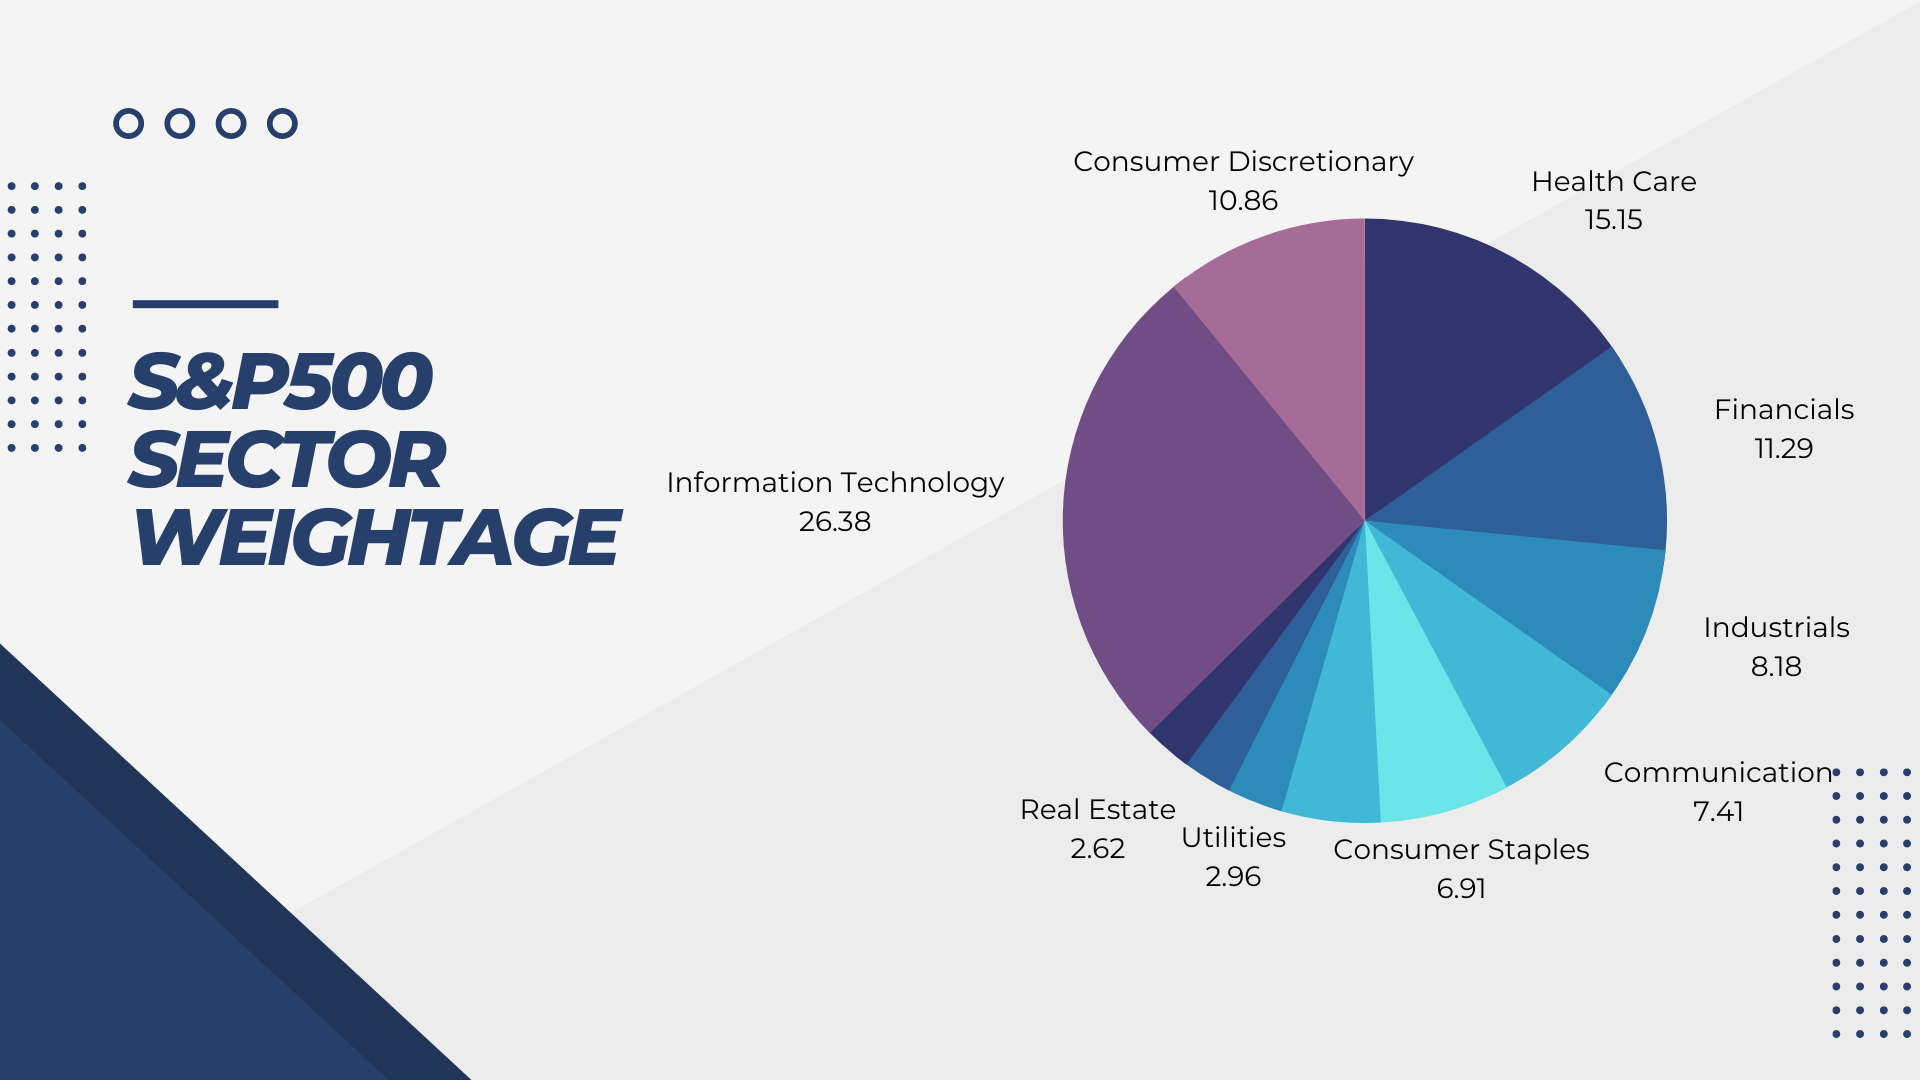
As seen from the table above, Apple Inc has the highest market value of USD 2.4T, and has the highest weightage of 7.08% without having the highest share price. Intrinsically, buying into a market cap weighted index will put emphasis on bigger market cap companies while reducing weightage on smaller cap companies. This rewards companies, as they grow bigger in size but penalise them when their market cap decreases, as more funds are allocated to companies with higher weightage.
While the Hang Seng Tech Index (HK Tech Index) is free-float market capitalisation weighted, it has a condition to prevent a small number of companies from dominating the entire index –a cap of 8% on an individual constituent’s weighting [6]. The table below shows the top 5 with the highest weightage in the Hang Seng Tech Index (as of September 2022).
| Name | Market Value HKD | Weightage | Price HKD |
| MEITUAN – W | 819.41B | 8.78% | 132.20 | TENCENT | 2.05T | 8.07% | 213.60 | BABA – SW | 1.58T | 8.03% | 64.75 | JD – SW | 496.01B | 7.88% | 157.10 | XIAOMI – W | 229.64B | 7.75% | 9.18 |
The Hang Seng Tech Index represents the 30 largest technology companies listed on the Hong Kong exchange, with high exposure to themes like Cloud, Digital, E-Commerce, Fintech and the internet [6]. This allows traders and investors to gain exposure to a basket of 30 tech companies easily. Below is a chart that covers the sectors represented in the Hang Seng Tech Index.
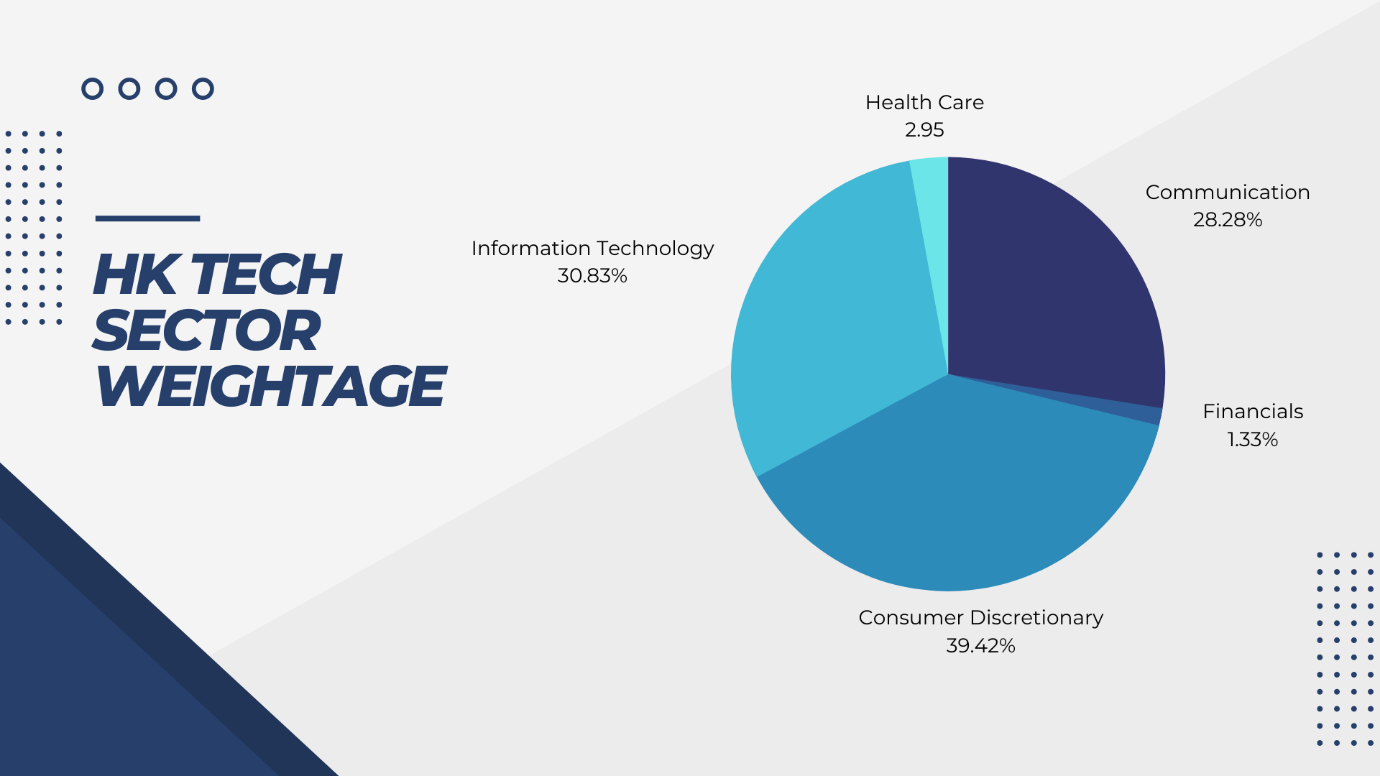
Traders and investors should at the very least know the Top 10 highest weightage components of an index before deciding to trade or invest. As index components change over time through reviews and rebalancing, market participants should keep themselves updated. The sector weightage is also as equally important because as time passes, there is usually a shift in sector weightage in the index. This can give market participants a rough gauge about which sectors are leading the index and which sectors are laggards. Market participants can also create trading/investing strategies based on shifting sector weightage and expected performance of large cap vs small cap. For example, investors can consider overweighting the S&P500 Equal Weighted Index over investing in the S&P500 market cap weighted index if they believe that the large cap will underperform against the smaller cap companies. Market participants who expect macro environment news to shift focus from one sector to another, can choose to underweight/short the index affected, and overweight/long the index that will benefit. During the COVID-19 pandemic, market participants were overweight on the tech-heavy Nasdaq, while they were underweight on the more diversified S&P500.
Current Major Macro News – East Asia & US (As of 1 Nov 2022)
On 23 October, China’s President Xi Jinping was elected for a third term as the General Secretary of the Chinese Communist Party. Market participants sold off Hong Kong Tech companies like Meituan, Tencent, Baba, JD and Xiaomi when the markets opened on 24 October closing at 2,782 points, the lowest levels seen since the inception of the Hang Seng Tech Index as shown in the graph below.
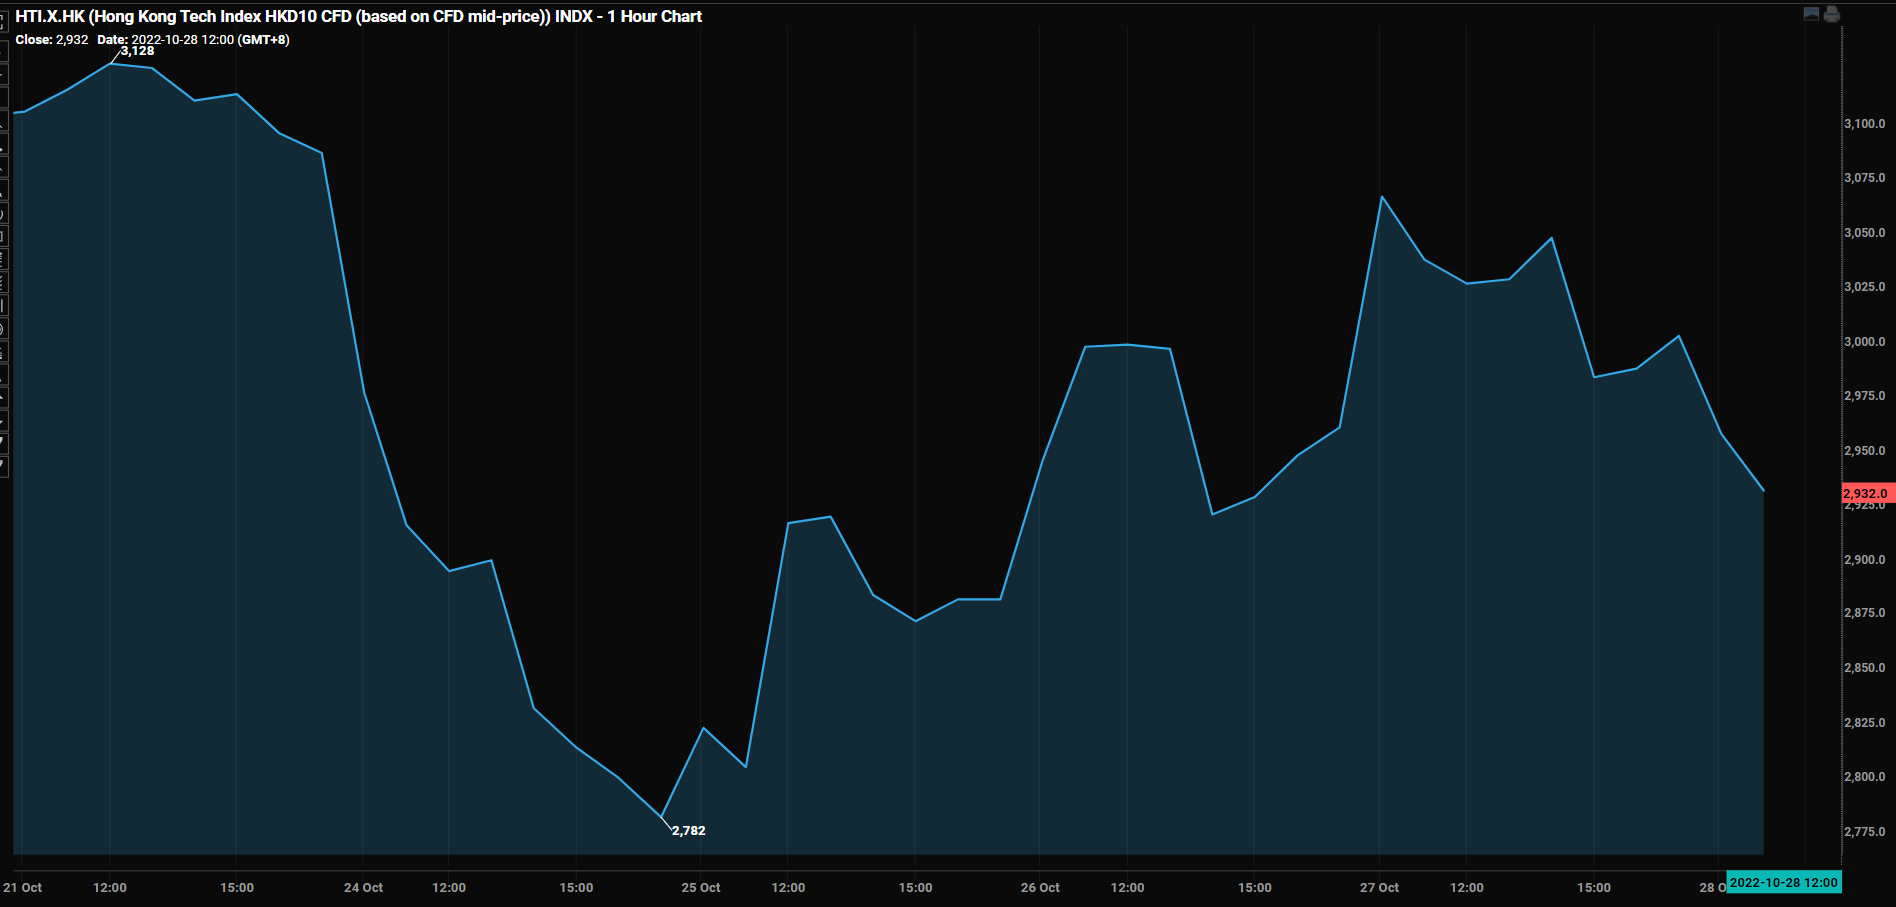
Market participants were pricing in high inflation, high interest rates, regulatory crackdowns, interventions and more frictions between China and US. Analysts believe that President Xi will prioritise national security over economic growth, maintain existing crackdowns on businesses to keep them in check and continue with the zero-COVID policy, which are all viewed as bearish news that will negatively impact the HK indexes & China A50 companies [7].
On a positive note, China’s gross domestic product increased by 3.9% YoY for a 3rd quarter, beating economists’ expectations [8], showing the strength and resilience of China’s economy even with the zero-COVID policy and lockdowns. With most of the potential negative scenarios being priced in, any positive news can result in an explosive rally in index prices. This kind of volatility presents a great opportunity for traders to apply both fundamental analysis and technical analysis.
US major macro news
The recent data on corporate earnings, housing markets and the semi-conductor space have been negative, with major tech companies like Meta, Alphabet, Amazon and NVIDIA falling short of analysts’ expectations. Mortgage rates are also increasing as seen in the graph below,

Source: FRED (https://fred.stlouisfed.org/series/MORTGAGE30US)
cooling down the housing market that was in hype during the phase of low interest rate phase. Retailers (Gap Inc, Target Corp), which received a huge influx of orders due to the re-opening of the economy, now face excess supply of inventory as inflation affect demand [9]. On the face of it, these developments are bad news, but market participants are seeing it as inflation slowing down and this might result in the Federal Reserve (Fed) pivoting their interest rate hikes. As the Fed pays close attention to inflation data, upcoming inflation data will be crucial in determining if inflation is in fact under control and if a potential pivoting of monetary policy is near.
In conclusion, the only thing certain is that volatility is expected in the near future, as there are still uncertainties clouding the world economy – from inflation and interest rates to geopolitical events like the war in Ukraine and US-China tensions. These may present as great opportunities for traders to take advantage of, and investors can potentially look for an entry point when risk vs reward ratios fits their preferences.
For a limited time from 3 October to 31 December 2022, Phillip CFD is having a Trade East with Ease Promotion that charges no commissions on selected East Asia Indexes. Trade any of the following East Asia Indexes with ZERO commissions, Hong Kong Index HKD1 CFD, Hong Kong Index HKD5 CFD, Hong Kong Tech Index HKD10 CFD, H-Shares Index HKD1 CFD, China A50 Index USD1 CFD, Japan 225 Index JPY100 CFD and Tokyo Index JPY1000 CFD.

How to get started
As the pioneer of Singapore’s online trading, POEMS’s award-winning suite of trading platforms offers investors and traders more than 40,000 financial products across global exchanges.
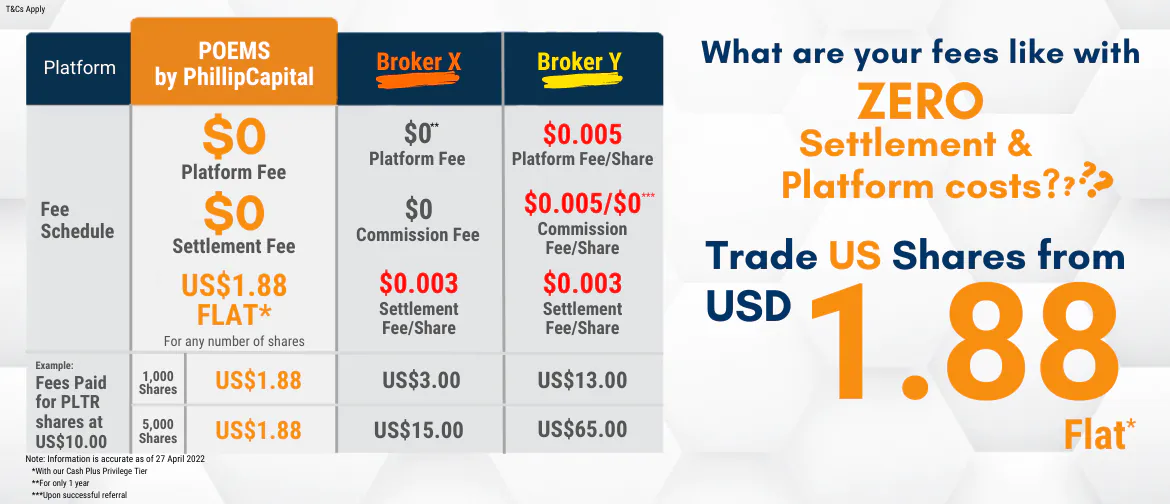
Explore an array of US shares with brokerage fees as low as US$1.88 flat* when you open a Cash Plus Account with us today. Find out more here (terms and conditions apply).
We hope that you have found value reading this article. If you do not have a POEMS account, you may visit here to open one with us today.
Lastly, investing with a community is much more fun. You will get to interact with us and other seasoned investors who are generous in sharing their experience and expertise.
In this community, you will be exposed to quality educational materials, stock analysis to help you apply the concepts, unwrap the mindset of seasoned investors, and even post questions.
We look forward to sharing more insights with you in our growing and enthusiastic Telegram community. Join us now!
For enquiries, please email us at cfd@phillip.com.sg.
Reference:
- [1] https://www.investopedia.com/articles/investing/030916/buffetts-bet-hedge-funds-year-eight-brka-brkb.asp
- [2] https://institutional.vanguard.com/investments/product-details/fund/0968
- [3] https://www.cambridge.org/core/journals/journal-of-financial-and-quantitative-analysis/article/abs/how-many-stocks-make-a-diversified-portfolio/CE5CDF2C7225FC1E0EDE3E700A3C66A7
- [4] https://indexes.nikkei.co.jp/nkave/archives/file/nikkei_stock_average_factsheet_en.pdf
- [5] https://www.spglobal.com/spdji/en/indices/equity/sp-500/#overview
- [6] https://www.hsi.com.hk/static/uploads/contents/en/dl_centre/factsheets/hsteche.pdf
- [7] https://www.bloomberg.com/news/articles/2022-10-27/experts-pessimistic-on-china-exiting-covid-zero-any-time-soon#xj4y7vzkg
- [8] https://www.china-briefing.com/news/chinas-q3-2022-economic-and-trade-data-roundup-recovery-better-than-expected/#:~:text=Compared%20to%20the%20previous%20year,percent%20year%2Don%2Dyear
- [9] https://theticker.org/8323/business/oversupply-burdens-big-retailers-amid-supply-chain-issues/
Disclaimer
These commentaries are intended for general circulation. It does not have regard to the specific investment objectives, financial situation and particular needs of any person who may receive this document. Accordingly, no warranty whatsoever is given and no liability whatsoever is accepted for any loss arising whether directly or indirectly as a result of any person acting based on this information. Opinions expressed in these commentaries are subject to change without notice. Investments are subject to investment risks including the possible loss of the principal amount invested. The value of the units and the income from them may fall as well as rise. Past performance figures as well as any projection or forecast used in these commentaries are not necessarily indicative of future or likely performance. Phillip Securities Pte Ltd (PSPL), its directors, connected persons or employees may from time to time have an interest in the financial instruments mentioned in these commentaries. Investors may wish to seek advice from a financial adviser before investing. In the event that investors choose not to seek advice from a financial adviser, they should consider whether the investment is suitable for them.
The information contained in these commentaries has been obtained from public sources which PSPL has no reason to believe are unreliable and any analysis, forecasts, projections, expectations and opinions (collectively the “Research”) contained in these commentaries are based on such information and are expressions of belief only. PSPL has not verified this information and no representation or warranty, express or implied, is made that such information or Research is accurate, complete or verified or should be relied upon as such. Any such information or Research contained in these commentaries are subject to change, and PSPL shall not have any responsibility to maintain the information or Research made available or to supply any corrections, updates or releases in connection therewith. In no event will PSPL be liable for any special, indirect, incidental or consequential damages which may be incurred from the use of the information or Research made available, even if it has been advised of the possibility of such damages. The companies and their employees mentioned in these commentaries cannot be held liable for any errors, inaccuracies and/or omissions howsoever caused. Any opinion or advice herein is made on a general basis and is subject to change without notice. The information provided in these commentaries may contain optimistic statements regarding future events or future financial performance of countries, markets or companies. You must make your own financial assessment of the relevance, accuracy and adequacy of the information provided in these commentaries.
Views and any strategies described in these commentaries may not be suitable for all investors. Opinions expressed herein may differ from the opinions expressed by other units of PSPL or its connected persons and associates. Any reference to or discussion of investment products or commodities in these commentaries is purely for illustrative purposes only and must not be construed as a recommendation, an offer or solicitation for the subscription, purchase or sale of the investment products or commodities mentioned.
About the author
Sam Hei Tung, Dealing
Sam graduated from National University of Singapore with a Master of Science in Finance. He personally manages his own investment portfolio and does equity and economic research in his free time. Sam believes that education and information is essential to making good financial decisions.

 Back in Business: The Return of IPOs & Top Traded Counters in March 2024
  From $50 to $100: Unveiling the Impact of Inflation
  Japan’s Economic Resurgence: Unveiling the Tailwinds Behind Nikkei 225’s Record Leap
  What Makes Forex Trading Attractive?


