
Apple Inc - Super-cycle in price, margins and product
20 Aug 2021- Record iPhone sales expected in FY21e and FY22e, topping its 4G super-cycle in 2015. 5G push for iPhone upgrading.
- Margins to stay elevated from fast-growing services and higher selling prices of new 5G products.
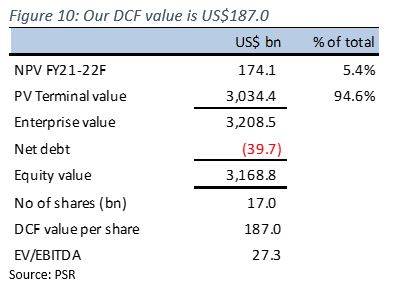
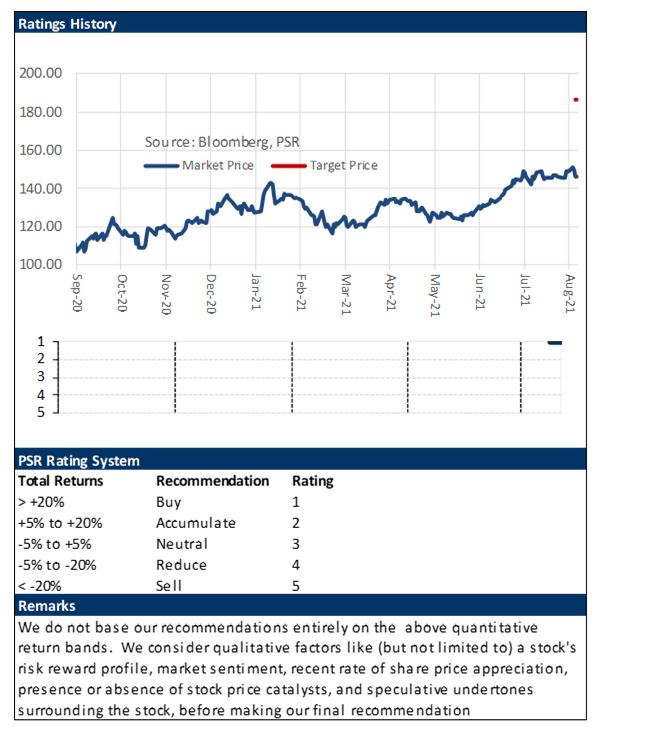
- Initiate coverage with BUY recommendation and DCF target price (WACC 5.8%) of US$187.0.
Company Background
Apple’s revenue comes from the iPhone (50% of FY20 revenue), iPad (9%), Mac (10%), wearables, home and accessories (11%), and services (20%). Main markets are the Americas (45%), Europe (25%), Greater China (15%), Japan (8%), and the rest of Asia Pacific (7%).
Investment Merits
- 5G to drive record iPhone sales. Apple’s flagship 5G iPhone 12 line-up launched in 2020 sold 100mn units two months earlier than the iPhone 11. Volumes were close to its iPhone 6 super-cycle during the 4G transition in 2015. Customers see 5G as a key reason for upgrading their iPhones after years of holding back replacements. Apple’s new iPhone 13 line-up is expected to be launched in September 2021, featuring up to 20% more efficiency and larger batteries to complement the power-hungry 5G phone. In anticipation of strong demand, Apple has ordered more than 100mn A15 chips from TSMC for the launch, 25% more than the 75mn chips for its 2020 iPhones. We expect the iPhone super-cycle to continue, with FY21e and FY22e sales potentially topping 2015’s record of 231mn units sold. This would be powered by upgrades from an estimated 48% of the iPhone users still using iPhone X and older. iPhone sales are Apple’s main cash cow, at 50% of sales in FY20.
- Margins to remain elevated. Strong growth in Apple’s services is expected to lift gross margins, together with higher ASPs of 5G devices in the product segment. Service margins of 66% are more than double product margins. Service revenue has also been expanding at a faster CAGR of 17% vs flat growth for iPhone. Growth is spearheaded by Apple’s ever-growing installed base, which topped 1.65bn in January 2021. Apple expects service growth to moderate after a bumper 3Q21 – when YoY growth was 33% from the COVID-19 rebound – to more sustainable double digits. Apple’s 5G products also allow it to raise weighted ASPs by more than 20% from a year ago, boosting product margins. We expect gross margins to track above 40% in FY21e and FY22e, higher than their 5-year historical average of 38%.
- Gaining market share through supply-chain dominance. As competitors grapple with chip shortages, Apple’s share of global smartphone sales breached 5-year highs, hitting 21% in 4Q21. In the high-end market, Samsung was hit by its Texas semiconductor fabrication plant’s month-long power shut-down and Vietnam factory suspensions due to COVID-19. Samsung’s new Galaxy Note’s launch in 2H21 may be delayed as a result. Apple managed to mitigate shortages in 3QFY21, with the revenue impact coming in lower than its US$3-4bn guidance. Apple holds buying power over suppliers through scale purchases and upfront cash payments, leaving competitors handling price shocks and shortages created by Apple deals.
We initiate coverage with a BUY rating. Our target price is US$187.0, based on DCF valuation with a WACC of 5.8% and terminal growth of 3.0%.
REVENUE
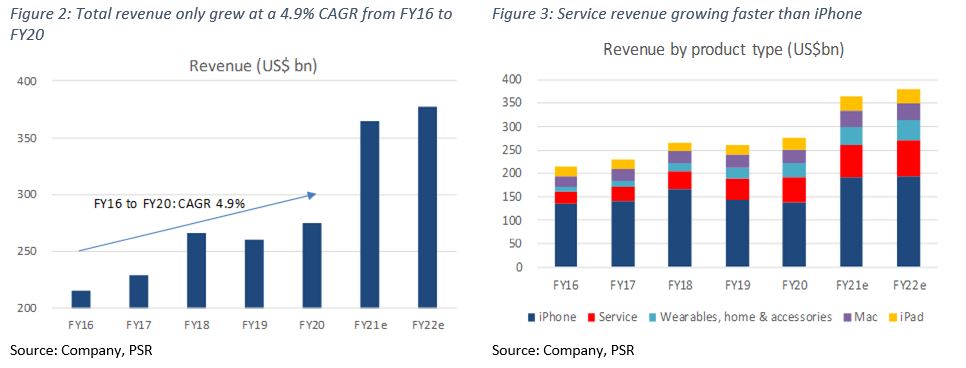
Apple has five revenue segments: iPhone (50% of sales), Mac (10%), iPad (9%), Wearables, Home and Accessories (11%), and Services (20%). The first four are grouped under products. Wearables, home and accessories consist of AirPods, Apple TV, Apple Watch, Beats products, HomePod, iPod touch and other Apple-branded and third-party accessories. Services are licensing, App Store, AppleCare, iCloud, Apple Music, Apple Pay and iTunes. Service revenue grew by a 17% CAGR from FY16 to FY20 to double from 9% to 20% of total revenue (Figure 3). iPhone revenue was flat in the same period but is expected to surge in FY21 and FY22.
EXPENSES
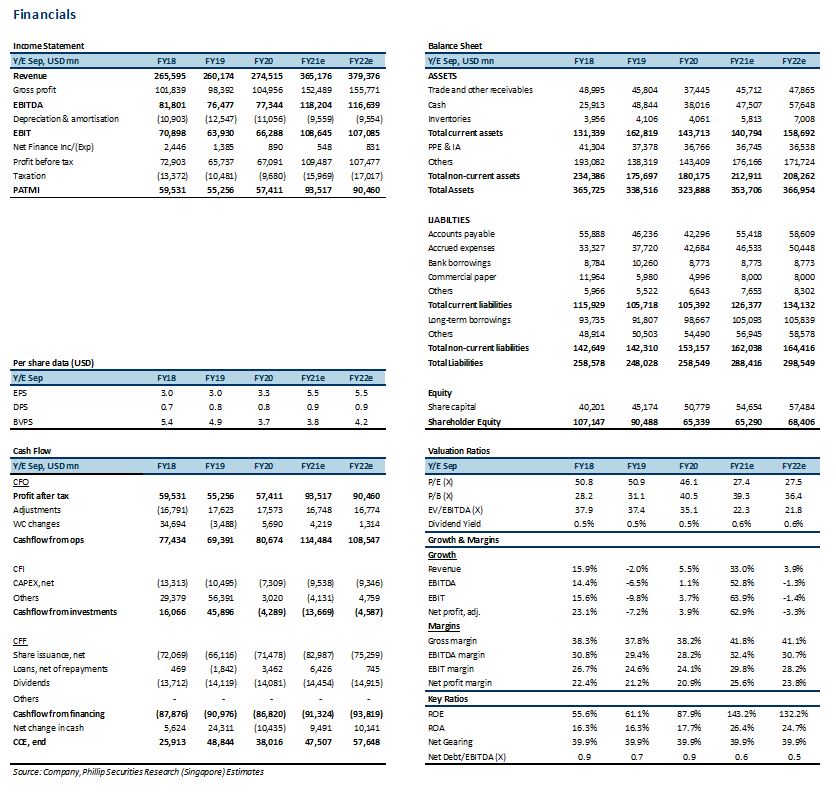
Cost of sales grew at a 5% CAGR from FY16 to FY20, in line with its revenue CAGR of 5%. Operating expenses include selling, general and administrative expenses (7% of sales) and research and development (7%). Over the past five years, SG&A consistently ranged at 6-7% of sales, while R&D grew from 5% to 7% of sales. Total operating expenses grew at a 8% CAGR.
MARGINS
Gross margins averaged 38% in the past five years. Margins for services averaged 61% in the past four years, almost double the product margins of 33%. We forecast elevated margins for both services and products for FY21 and FY22 on the back of higher ASPs of new 5G devices and a higher installed base for services boosting operating leverage. Normalisation of freight costs could jack up product margins further.
BALANCE SHEET
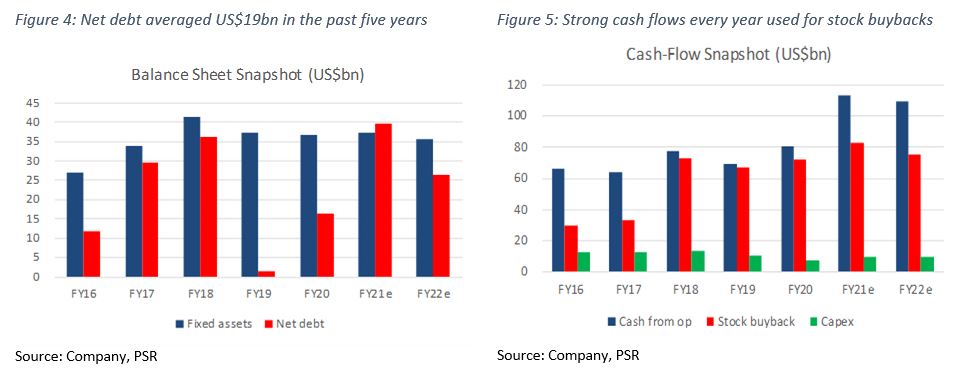
Assets: Fixed assets increased modestly by 36% in the past five years to US$37bn, roughly in line with revenue growth of 27% between FY16 to FY20. Fixed assets only comprised 8% of total assets as Apple outsources most of its manufacturing needs. Inventory grew 90% in the past five years to US$4bn, likely due to Apple’s wider range of product line-ups in recent years.
Liabilities: Net debt averaged US$19bn in the past five years. It was pared down to lower levels in FY19 and FY20 as fixed assets were flat in those years.
CASH-FLOW
Apple historically generates strong cash flows every year. Cash flow from operations in FY20 jumped 16% YoY to US$81bn from a strong iPhone 12 launch. Much of the cash was used for stock repurchases of US$72bn in that year. Meanwhile, capex averaged US$11bn in the last five years, largely stable.
|
BUSINESS MODEL Apple designs, makes and markets smartphones, personal computers, tablets, wearables and accessories, and sells a variety of related services. Customers are primarily in the consumer, small and mid-sized business, education, enterprise and government markets. Apple sells its products and resells third-party products in most of its markets directly to customers through retail and online stores and a direct sales force. It also distributes indirectly through third-party cellular network carriers, wholesalers, retailers and resellers. FY20 net sales through direct and indirect distribution channels accounted for 34% and 66%, respectively, of total net sales. No single customer accounted for more than 10% of net sales in 2020, 2019 and 2018. Main markets are the Americas (45% of FY20 sales), Europe (25%), Greater China (15%), Japan (8%), and the rest of Asia Pacific (7%).
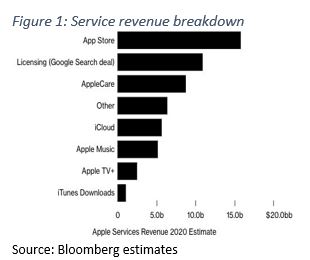
In the service segment, the main revenue contributor is the App Store, which takes in 30% of revenue from in-app purchases of games, app sales, and app subscriptions. Next is licensing, which includes payments from companies like Google to be featured on Apple products. Other services include AppleCare, which is Apple’s extended warranty service with a price range that depends on the product. iCloud generates revenue through subscription fees for use of cloud data. Apple Music also generates subscription fees as well as revenue from carrier partnerships. Apple Pay earns a percentage of transaction fees from users and banks. New to services and not yet meaningfully contributing are Apple TV, which earns subscription fees, and Apple Card, where Apple likely takes a cut of the interest charged by its partner bank. |
|
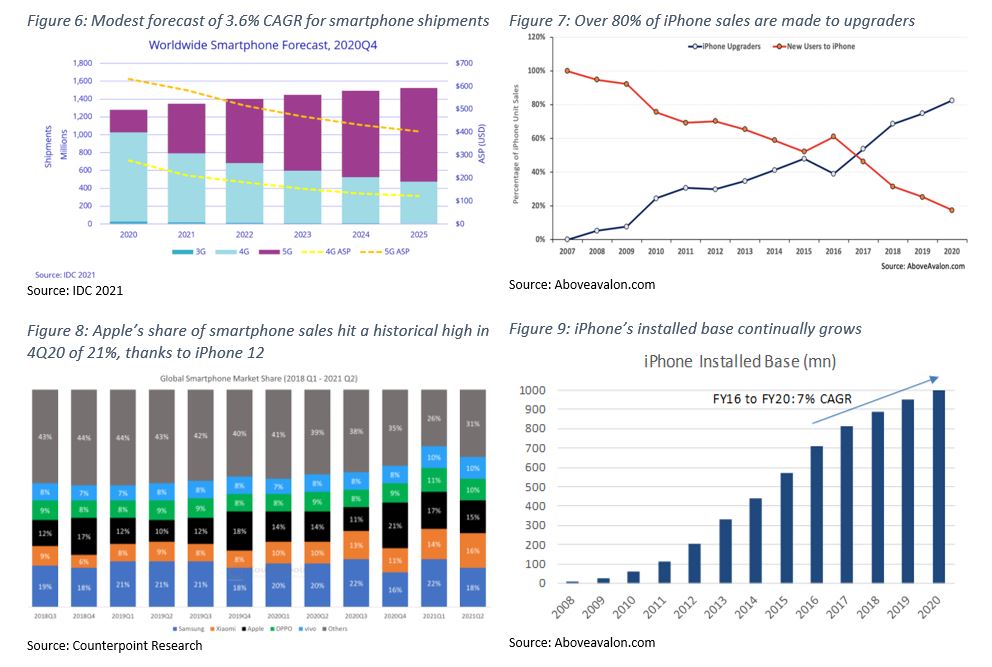
INDUSTRY The high-end smartphone market is predominantly served by Apple and Samsung. Huawei has fallen out of the ranks following U.S. sanctions. Apple’s share of global smartphone sales averaged 14% in the past three years, hitting a historical high of 21% in 4Q20 on the back of the iPhone 12 launch (Figure 8). The International Data Corporation (IDC) expects the global smartphone market to grow at a 3.6% CAGR over 2020-2025 (Figure 6). Apple’s key markets, China (18% of sales) and the US (45%), are forecast to grow 6.0% and 3.5% respectively.
Despite tepid market growth, Apple can rely on its consistently growing ecosystem of installed users to outperform the market. The iPhone’s installed base breached 1bn in 2020 (Figure 9), growing by a stronger 5-year CAGR of 7% than the pre-pandemic smartphone sales CAGR of 2%. Most iPhones are sold to upgraders in its installed base (Figure 7). |
Risks
- Antitrust laws could affect service revenue. Apple could lower its App Store fees for larger developers as a result of lawsuits. Apple last year lowered its fee to 15% for smaller developers making less than US$1mn per year from their apps. But App Store revenue is largely driven by its larger developer base, contributing 30% fees.
- China’s gaming crackdown could hit App Store spending. China’s gaming revenue contributed an estimated US$2bn or 13% to App Store revenue in FY19. That said, even if China’s gaming crackdown intensifies, we believe the impact will be minimal as China’s gaming revenue translated to less than 1% of FY19 revenue.
Chip supply shortage. Apple guided for a US$3-4bn of impact from chip shortages earlier this year. This will affect iPhone and iPad sales in the coming quarter. There is a risk of the impact coming in at the higher end of the range.
Valuation
We initiate coverage on Apple Inc with a BUY recommendation. We have a DCF valuation of US$187.0, based on a WACC of 5.8% and terminal growth rate of 3.0%.
Important Information
This report is prepared and/or distributed by Phillip Securities Research Pte Ltd ("Phillip Securities Research"), which is a holder of a financial adviser’s licence under the Financial Advisers Act, Chapter 110 in Singapore.
By receiving or reading this report, you agree to be bound by the terms and limitations set out below. Any failure to comply with these terms and limitations may constitute a violation of law. This report has been provided to you for personal use only and shall not be reproduced, distributed or published by you in whole or in part, for any purpose. If you have received this report by mistake, please delete or destroy it, and notify the sender immediately.
The information and any analysis, forecasts, projections, expectations and opinions (collectively, the “Research”) contained in this report has been obtained from public sources which Phillip Securities Research believes to be reliable. However, Phillip Securities Research does not make any representation or warranty, express or implied that such information or Research is accurate, complete or appropriate or should be relied upon as such. Any such information or Research contained in this report is subject to change, and Phillip Securities Research shall not have any responsibility to maintain or update the information or Research made available or to supply any corrections, updates or releases in connection therewith.
Any opinions, forecasts, assumptions, estimates, valuations and prices contained in this report are as of the date indicated and are subject to change at any time without prior notice. Past performance of any product referred to in this report is not indicative of future results.
This report does not constitute, and should not be used as a substitute for, tax, legal or investment advice. This report should not be relied upon exclusively or as authoritative, without further being subject to the recipient’s own independent verification and exercise of judgment. The fact that this report has been made available constitutes neither a recommendation to enter into a particular transaction, nor a representation that any product described in this report is suitable or appropriate for the recipient. Recipients should be aware that many of the products, which may be described in this report involve significant risks and may not be suitable for all investors, and that any decision to enter into transactions involving such products should not be made, unless all such risks are understood and an independent determination has been made that such transactions would be appropriate. Any discussion of the risks contained herein with respect to any product should not be considered to be a disclosure of all risks or a complete discussion of such risks.
Nothing in this report shall be construed to be an offer or solicitation for the purchase or sale of any product. Any decision to purchase any product mentioned in this report should take into account existing public information, including any registered prospectus in respect of such product.
Phillip Securities Research, or persons associated with or connected to Phillip Securities Research, including but not limited to its officers, directors, employees or persons involved in the issuance of this report, may provide an array of financial services to a large number of corporations in Singapore and worldwide, including but not limited to commercial / investment banking activities (including sponsorship, financial advisory or underwriting activities), brokerage or securities trading activities. Phillip Securities Research, or persons associated with or connected to Phillip Securities Research, including but not limited to its officers, directors, employees or persons involved in the issuance of this report, may have participated in or invested in transactions with the issuer(s) of the securities mentioned in this report, and may have performed services for or solicited business from such issuers. Additionally, Phillip Securities Research, or persons associated with or connected to Phillip Securities Research, including but not limited to its officers, directors, employees or persons involved in the issuance of this report, may have provided advice or investment services to such companies and investments or related investments, as may be mentioned in this report.
Phillip Securities Research or persons associated with or connected to Phillip Securities Research, including but not limited to its officers, directors, employees or persons involved in the issuance of this report may, from time to time maintain a long or short position in securities referred to herein, or in related futures or options, purchase or sell, make a market in, or engage in any other transaction involving such securities, and earn brokerage or other compensation in respect of the foregoing. Investments will be denominated in various currencies including US dollars and Euro and thus will be subject to any fluctuation in exchange rates between US dollars and Euro or foreign currencies and the currency of your own jurisdiction. Such fluctuations may have an adverse effect on the value, price or income return of the investment.
To the extent permitted by law, Phillip Securities Research, or persons associated with or connected to Phillip Securities Research, including but not limited to its officers, directors, employees or persons involved in the issuance of this report, may at any time engage in any of the above activities as set out above or otherwise hold an interest, whether material or not, in respect of companies and investments or related investments, which may be mentioned in this report. Accordingly, information may be available to Phillip Securities Research, or persons associated with or connected to Phillip Securities Research, including but not limited to its officers, directors, employees or persons involved in the issuance of this report, which is not reflected in this report, and Phillip Securities Research, or persons associated with or connected to Phillip Securities Research, including but not limited to its officers, directors, employees or persons involved in the issuance of this report, may, to the extent permitted by law, have acted upon or used the information prior to or immediately following its publication. Phillip Securities Research, or persons associated with or connected to Phillip Securities Research, including but not limited its officers, directors, employees or persons involved in the issuance of this report, may have issued other material that is inconsistent with, or reach different conclusions from, the contents of this report.
The information, tools and material presented herein are not directed, intended for distribution to or use by, any person or entity in any jurisdiction or country where such distribution, publication, availability or use would be contrary to the applicable law or regulation or which would subject Phillip Securities Research to any registration or licensing or other requirement, or penalty for contravention of such requirements within such jurisdiction.
This report is intended for general circulation only and does not take into account the specific investment objectives, financial situation or particular needs of any particular person. The products mentioned in this report may not be suitable for all investors and a person receiving or reading this report should seek advice from a professional and financial adviser regarding the legal, business, financial, tax and other aspects including the suitability of such products, taking into account the specific investment objectives, financial situation or particular needs of that person, before making a commitment to invest in any of such products.
This report is not intended for distribution, publication to or use by any person in any jurisdiction outside of Singapore or any other jurisdiction as Phillip Securities Research may determine in its absolute discretion.
IMPORTANT DISCLOSURES FOR INCLUDED RESEARCH ANALYSES OR REPORTS OF FOREIGN RESEARCH HOUSE
Where the report contains research analyses or reports from a foreign research house, please note:
- recipients of the analyses or reports are to contact Phillip Securities Research (and not the relevant foreign research house) in Singapore at 250 North Bridge Road, #06-00 Raffles City Tower, Singapore 179101, telephone number +65 6533 6001, in respect of any matters arising from, or in connection with, the analyses or reports; and
- to the extent that the analyses or reports are delivered to and intended to be received by any person in Singapore who is not an accredited investor, expert investor or institutional investor, Phillip Securities Research accepts legal responsibility for the contents of the analyses or reports.


 Phillip Macro Update - Fed delivers 3rd cut and one more in 2026
 Singapore Banking Monthly – Loan and deposit growth continue rising
 OUE REIT - Proceeds in, gearing to decline
 LHN Ltd – Steeper growth ahead