
Manulife US REIT – Outperforming market occupancy & sub-leasing
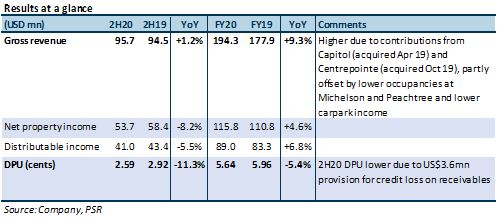
10 Feb 2021- FY20 DPU of 5.64 US cents (-5.4% YoY) missed, at 88% of our estimate, mainly due to a lower-than forecasted NPI and NPI margins.
- Rental collection was 99%, after US$1.8m writeback in credit losses. Portfolio reversions were +4.7%, stripping out a marked-to-market lease.
- Gearing rose from 37.7% to 40.1%% YoY following a 4.9% YoY decline in valuation.
- DDM TP (COE 9.1%) cut from US$0.92 to US$0.84 as we lower FY21-24e DPUs by 10.2-11.7% to reflect leasing weakness. Still, maintain BUY as we are forecasting FY21e DPU yield of 8.3%.
The Positives
+ Rental collections improved from 94% to 97% in 4Q20. MUST booked a US$3.6mn impairment for receivables in 4Q20, mainly from one retail and several F&B leases. Half of its credit provision was attributed to this retail tenant. In February 2021, MUST managed to get the tenant to agree to repay the arrears in full. Writing back the arrears, collection rate would have been 99%.
+ Executed 279k sq ft of leases in FY20, accounting for 5.9% of NLA. Leases signed were mainly from traditional office-using sectors such as legal, real estate, information, finance and insurance. New leases, renewals and expansion accounted for 35.6%, 58.7% and 5.7% of the leases signed. One legal company at Figueroa increased space by 25.5% with positive reversions. Legal (21%), finance and insurance (18%), retail trade (14%), real estate (7%) and information (7%) contributed the most to MUST’s GRI. Unemployment rates in these sectors ranged from 2.8% to 5.9%, below the national average of 6.7%.
The Negatives
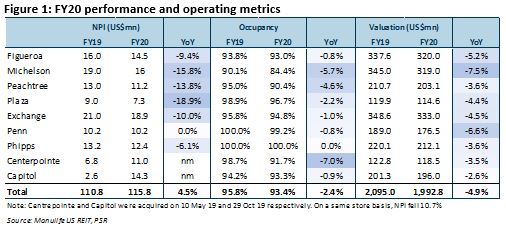
– NPI fell due to lower occupancy and carpark income. Portfolio occupancy declined YoY from 95.8 to 93.4% due to a handful of non-renewals. Occupancy at Michelson, Peachtree and Centrepointe was the most affected (Figure 1). Carpark income contributed 7% to FY19 revenue. This income took a 25% hit from remote working which reduced physical occupancy in offices to about 15% during the year. Remote working also lowered parking usage by the patrons of surrounding entertainment venues.
– Portfolio reversions flat at 0.1%, (1H20: +7.9%). The figure was dragged down by a double-digit negative reversion at Centrepointe where the lease was marked-to-market upon renewal. The tenant has been in the building for years on a lease with 2% annual rental escalations. As such, passing rents have overrun market rents, resulting in a negative marked-to-market reversion. Stripping out this lease, FY20 reversions would have been +4.7%.
Outlook
Eyeing tenants in New Economy sectors and business parks. After enlarging its AUM from US$834mn during IPO to US$1.99bn, MUST is ready for its next phase of growth. Its next acquisition will likely be a sizeable one of above US$100mn. Management wants to increase exposure to tenants in future-centric sectors by 20%. Such sectors include healthcare, life sciences, technology and new/knowledge industries. As tenants from these industries lean towards high-quality business parks, and the management is open to adding low-lying business parks of 2-3 storeys in suburban areas to the MUST portfolio.
Softer leasing expected, near term. According to JLL, subletting in the cities that MUST operates in is significantly lower, at 6.4-21.2%, versus gateway cities of San Francisco, Seattle and New York where subletting ranges 28-32%. Subleasing within MUST’s portfolio is below average level in the cities they are in. MUST’s tenants are seeking to sublease 4.8% of NLA, with 3.3% already on the sublease market. Gateway cities are experiencing higher subletting as they have larger exposure to remote-work-friendly industries. In recent years, there has also been a marked demographic shift in the US towards more affordable cities. In 4Q20, an additional 18.4mn sq ft of sublease space hit the US market, lifting total space to more than 141.5mn sq ft. This surpassed dot.com levels. Over the course of the pandemic, the sublease market has expanded by another 47.65mn sq ft or 50.7% YoY. While average vacancy rate was 17.1% at year-end, MUST’s portfolio vacancy was 6.6%. Its trophy and Class-A assets continue to attract flight-to-quality tenants taking advantage of lower rents and more generous incentives to relocate to best-in-class buildings.
Tenants also continue to opt for or renew on shorter leases. Incentive and free-rent expectations have similarly increased. Nonetheless, lease expiries in FY21 are low at 5.8% of GRI. Limited new supply, positive rental-growth forecasts averaging 1.2% in MUST’s cities and mostly below-market or at-market in-place rents in its portfolio should allow for flat to mildly positive reversions.
US$3mn interest savings expected from refinancing. About US$223.7mn or 26% of borrowings at a 3.2% interest will be up for renewal in FY21. Refinancing earlier in the year was done at 1.85%. We are expecting US$3mn p.a. in interest savings upon refinancing in FY21, and weighted average interest rate to decline to c.2.9%.


 JPMorgan Chase & Co - NII continues to rise, guidance maintained
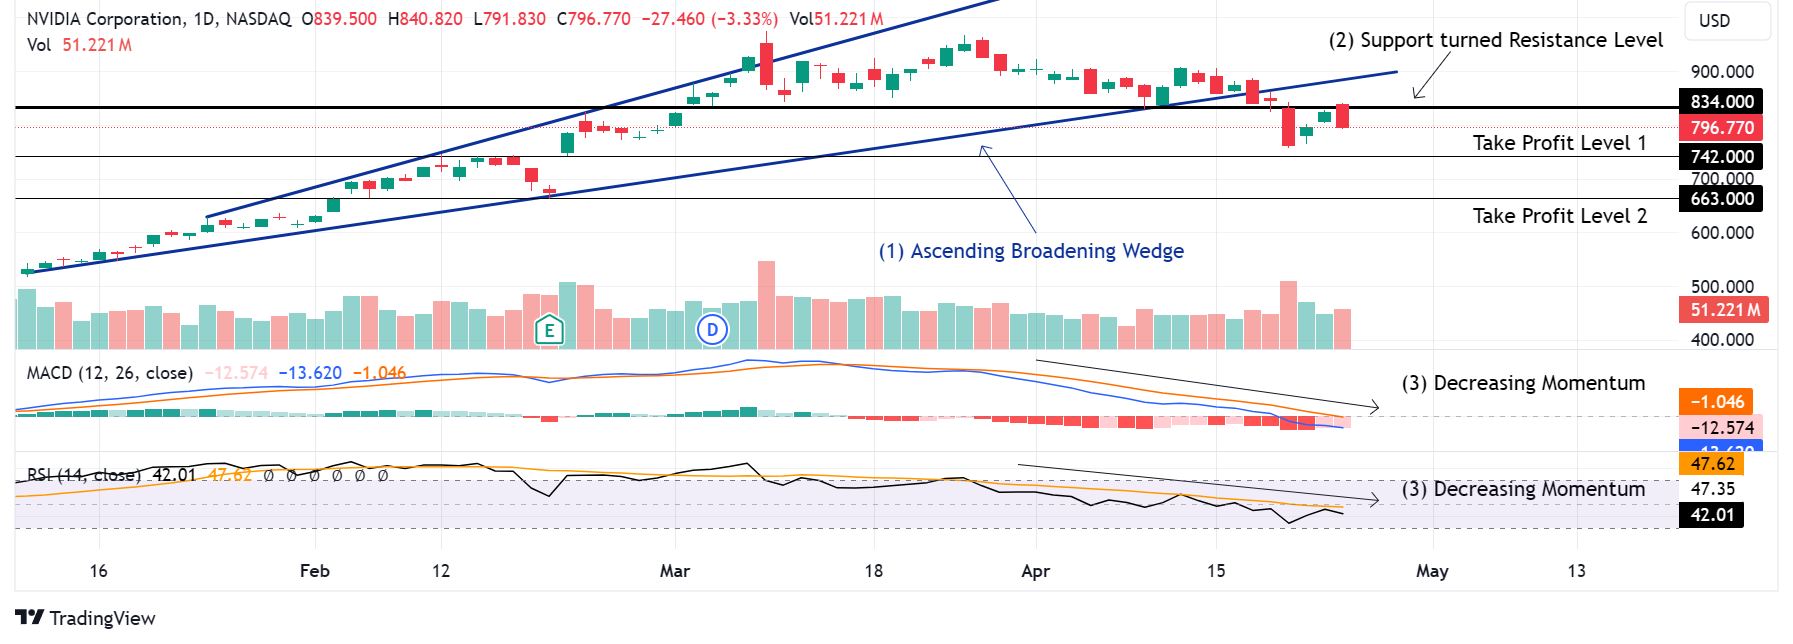 Trade of the Day - NVIDIA Corporation (NASDAQ: NVDA)
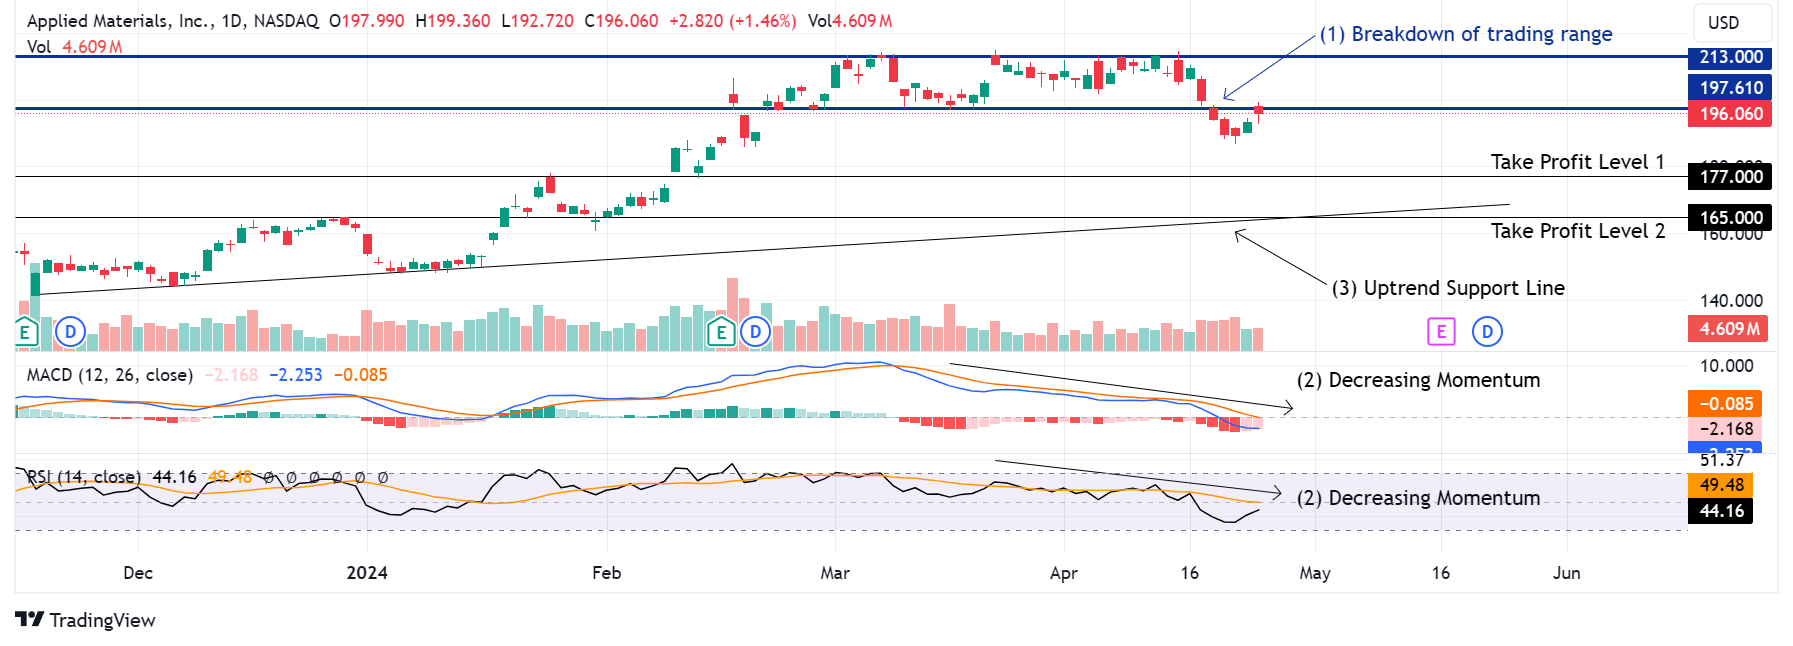 Trade of the Day - Applied Materials, Inc. (NASDAQ: AMAT)
 CapitaLand Ascott Trust - Occupancy to improve with ADRs stabilising