Demystifying Forex Trading – Technical Analysis March 12, 2024

In the world of financial markets, the Forex market stands out as the largest, most liquid, and most volatile, attracting many participants to trade in it. Therefore, finding the appropriate Forex trading style and analysis method in such a complex economic environment becomes particularly crucial.
There are two primary methods for Forex trading analysis: Fundamental Analysis and Technical Analysis. This article will primarily focus on Technical Analysis.
What is Forex?
Forex, or FX, short for foreign exchange, refers to the global marketplace where currencies are traded against each other. The FX pair is always displayed in the form of GBP/USD, with the base currency (GBP) listed first, followed by the quoted currency (USD).

Singapore is the third-largest Forex centre globally after London and New York and the largest in Asia Pacific. Based on official data from MAS (the Monetary Authority of Singapore), Singapore’s foreign exchange (FX) average daily trading volumes (ADTV) rose to US$864 billion in October 2023, significantly increasing by 134% over the past decade [1].
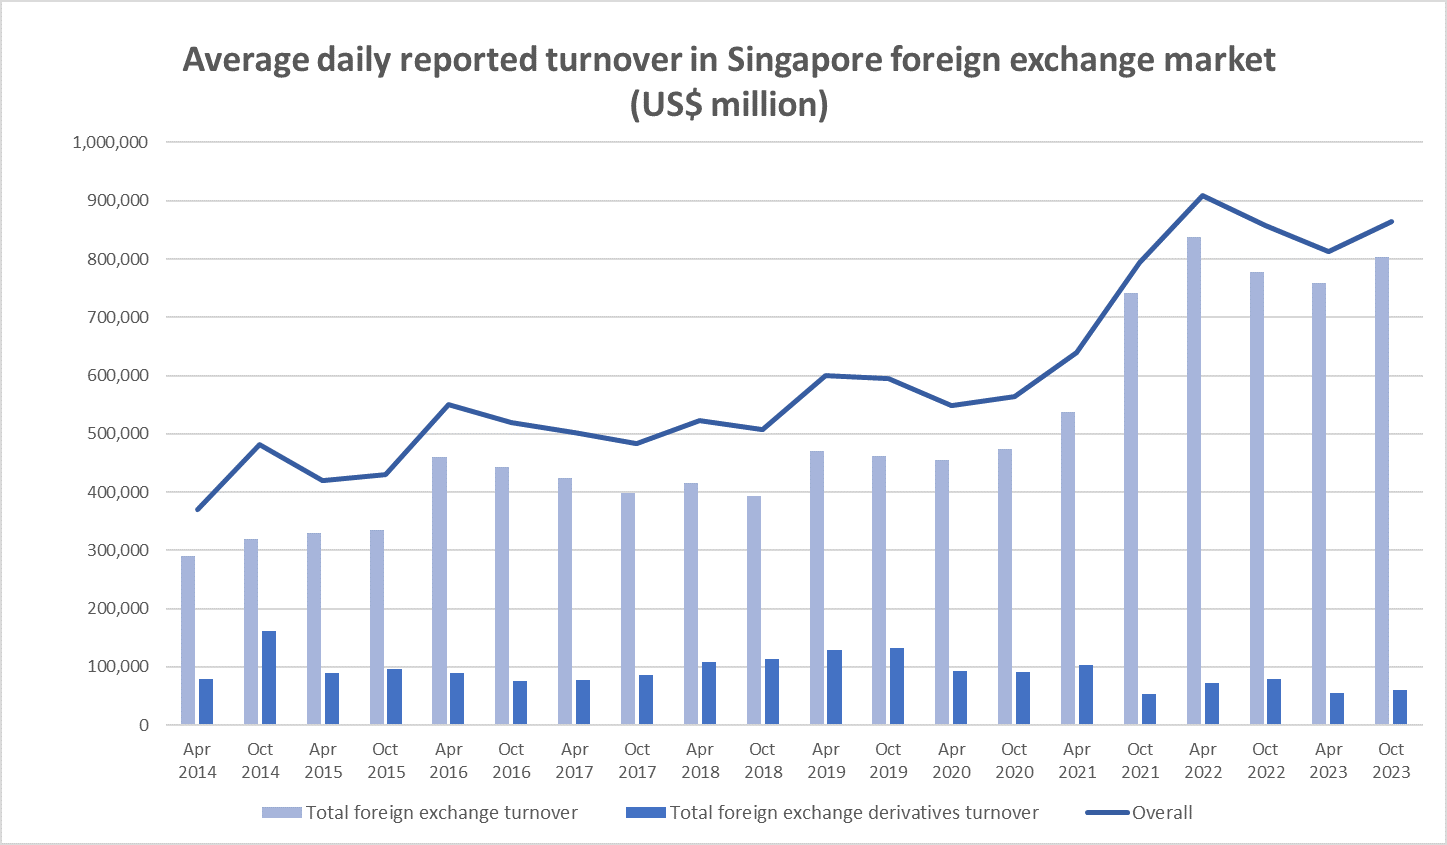 Source: Singapore Foreign Exchange Market Committee (SFEMC) Semi-Annual Survey of Singapore FX Volume
What is Forex Trading Analysis – Technical Analysis?
Forex Trading analysis involves evaluating various factors to predict currency movements, with the goal of profiting from buying or selling FX pairs at opportune moments in the Forex market.

Technical analysis is the analysis based on trends and ranges within the historical data of the currency in FX pairs.
Here are some examples of key indicators that investors widely use:
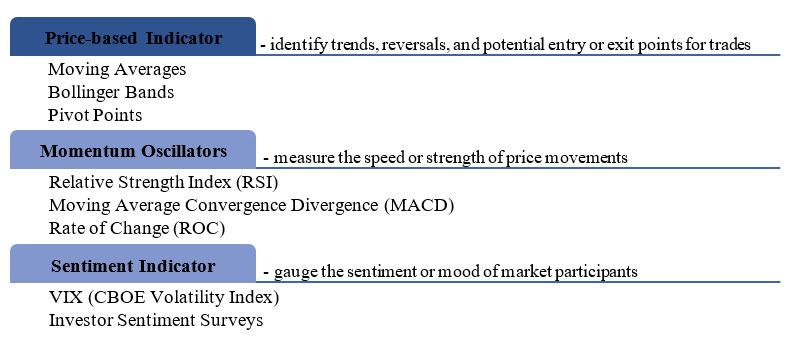
One of the most popular indicators – Relative Strength Index (RSI)
Relative Strength Index (RSI), one of the key momentum oscillators developed by J. Welles Wilder, measures the speed and change of price movements [2].

How to use it?
-
Identify Overbought and Oversold signalsThe RSI typically ranges between 0 and 100.
 Source: U.S. Dollar / Japanese Yen, TradingView
Generally, when the RSI crosses 70, it is considered overbought, suggesting that the asset may be due for a price correction or reversal. Conversely, an RSI below 30 is considered oversold, indicating that the asset may be undervalued and due for a potential price rebound.
-
Identify Centreline CrossoversCentreline crossovers occur when the RSI crosses above or below the 50 level. A move above 50 indicates bullish momentum, while a move below 50 suggests bearish momentum.
Let’s back up the example with fundamental analysis. During the FOMC press conference on 31 Jan [3], which started at 2:00 pm EST, the market was influenced by the morning’s released ADP National Employment Report data [4], which resulted in negative sentiment. Consequently, the RSI crossed the centreline from above to below 50, which led to a price decline. However, around 3:00 pm EST, following the Federal Reserve’s indication that largely ruled out the possibility of a rate cut in March, the RSI crossed back above 50 from below, leading to a price increase.
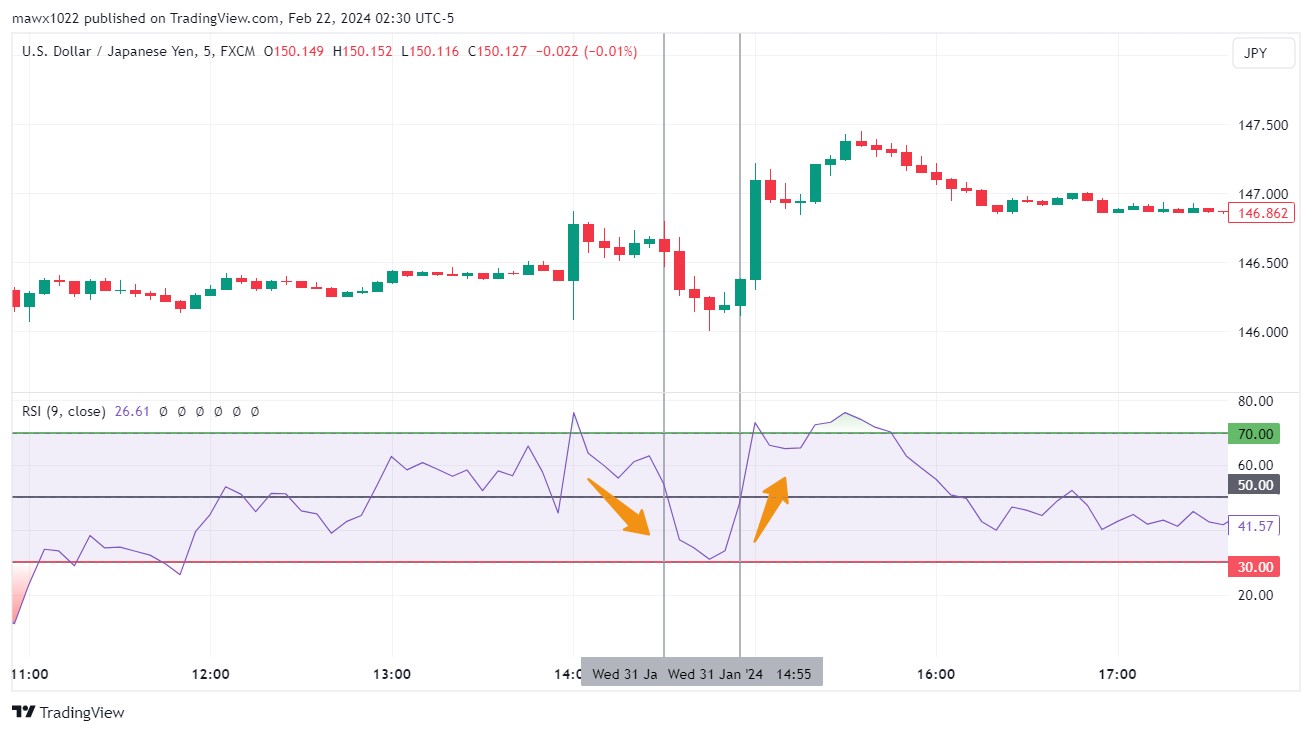 Source: U.S. Dollar / Japanese Yen, TradingView
 -
Identify DivergenceAn RSI divergence occurs when the price of an asset moves in the opposite direction of the RSI.As you can see in the following chart, a bullish divergence occurs when the price makes lower lows while the RSI makes higher lows, indicating a potential bullish reversal.
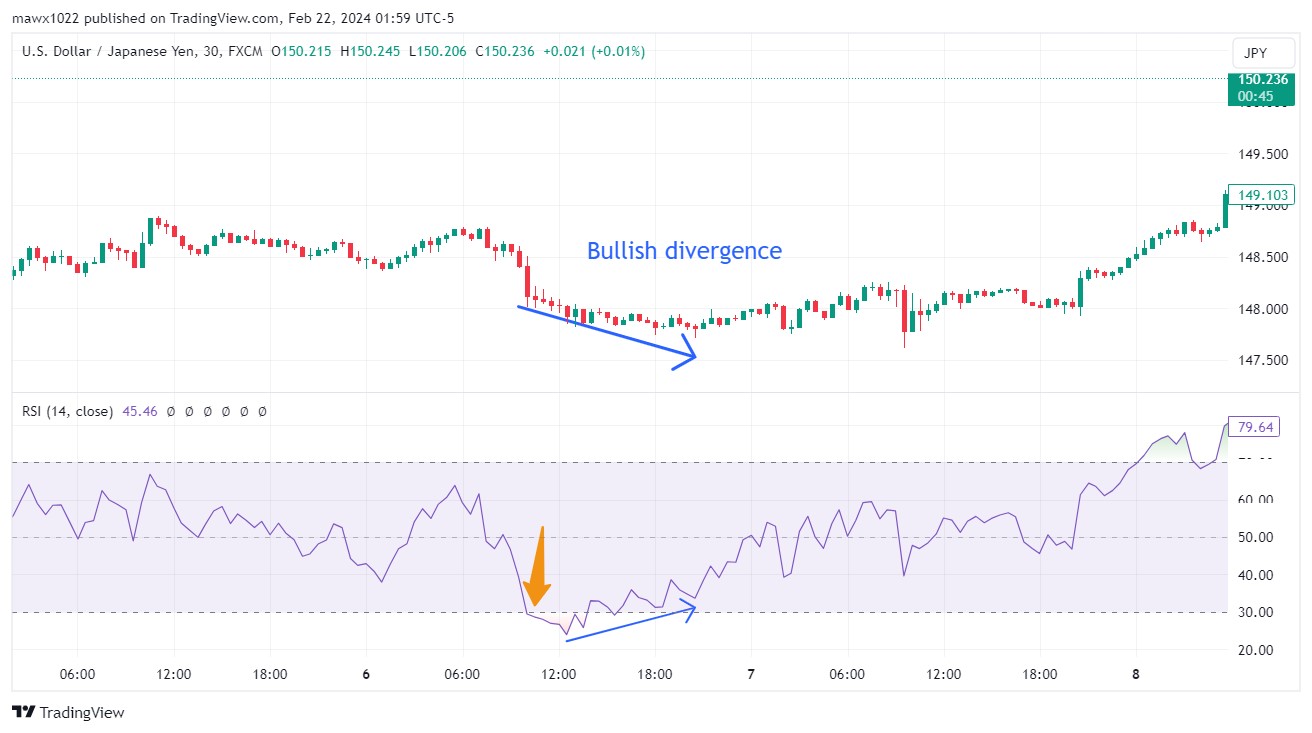 Source: U.S. Dollar / Japanese Yen, TradingView
Conversely, bearish divergence occurs when the price makes higher highs while the RSI makes lower highs, suggesting a potential bearish reversal.
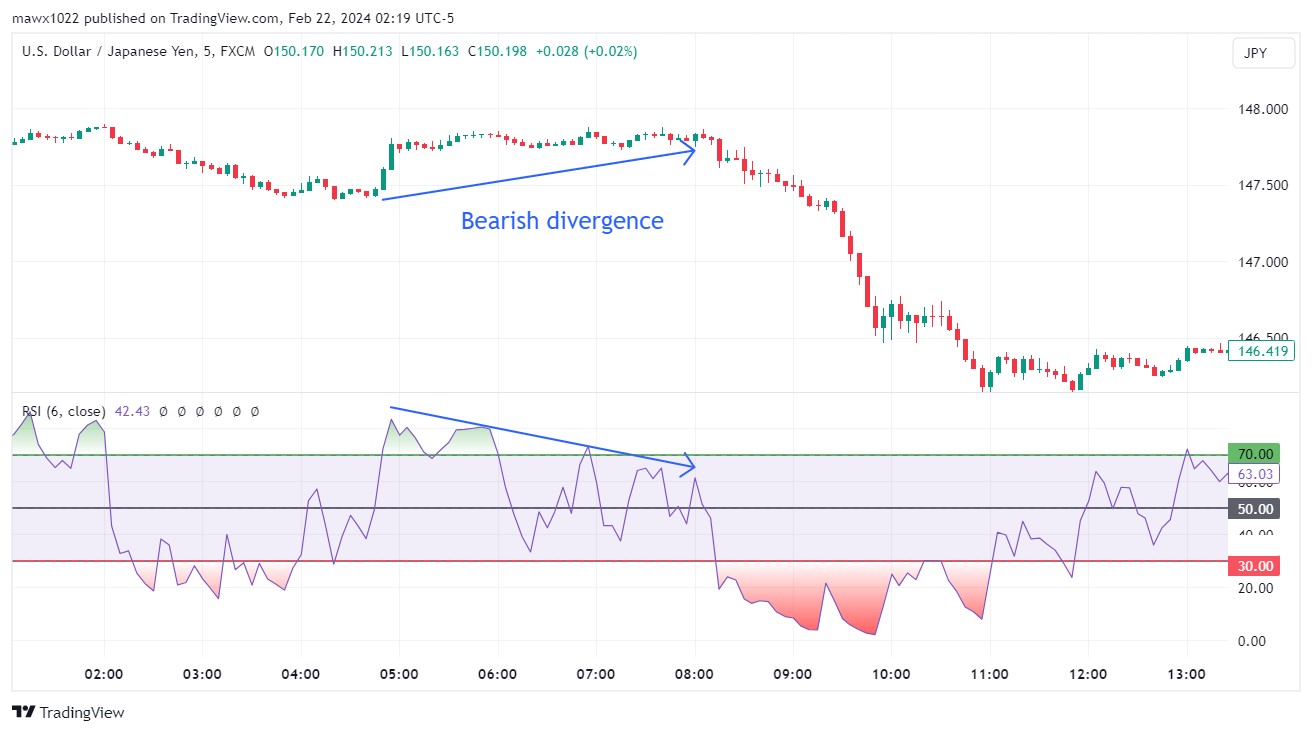 Source: U.S. Dollar / Japanese Yen, TradingView
 -
Identify long-term trendsRSI can be used to confirm the strength and direction of a trend in the long term. In an uptrend, the RSI tends to remain above 50, while in a downtrend, it tends to remain below 50. Crosses above or below the 50 level may signal potential trend reversals or shifts in momentum.As shown in the USD/JPY trend chart below, over the past two years, when the RSI is mostly above 50 in stages 1,2 and 4, USD/JPY tends to be in an upward trend. Conversely, during stages 3 and 5, when the RSI is below 50, USD/JPY trends downward.
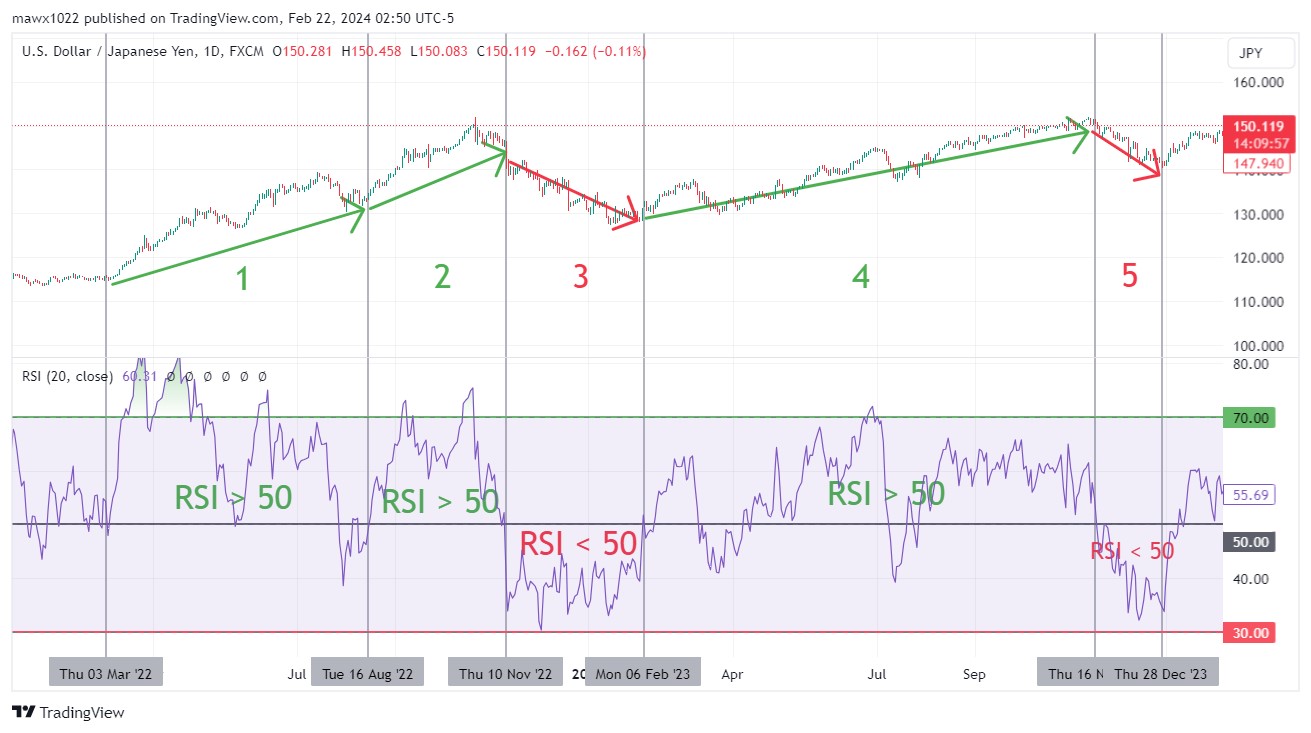 Source: U.S. Dollar / Japanese Yen, TradingView
Similarly, in the trend chart of EUR/USD over the past seven years, during stages 1, 3 and 5, when the RSI is predominantly above 50, EUR/USD demonstrates an upward trend. On the other hand, during stages such as 2 and 4, when the RSI is below 50, EUR/USD exhibits a downward trend.
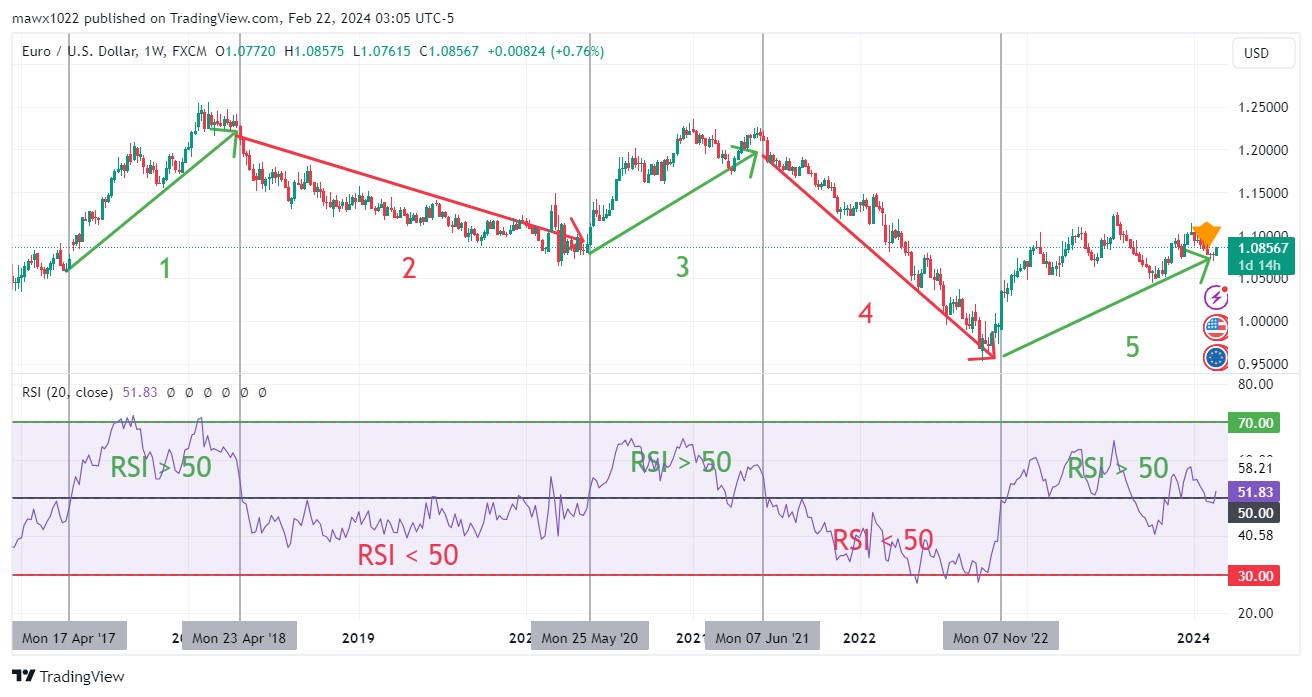 Source: U.S. Dollar / Japanese Yen, TradingView
 -
Adjust periodYou may have noticed that the charts before used different RSI periods. Investors should adjust the default period of RSI calculation to suit their trading strategies and the characteristics of the asset being analysed.
>
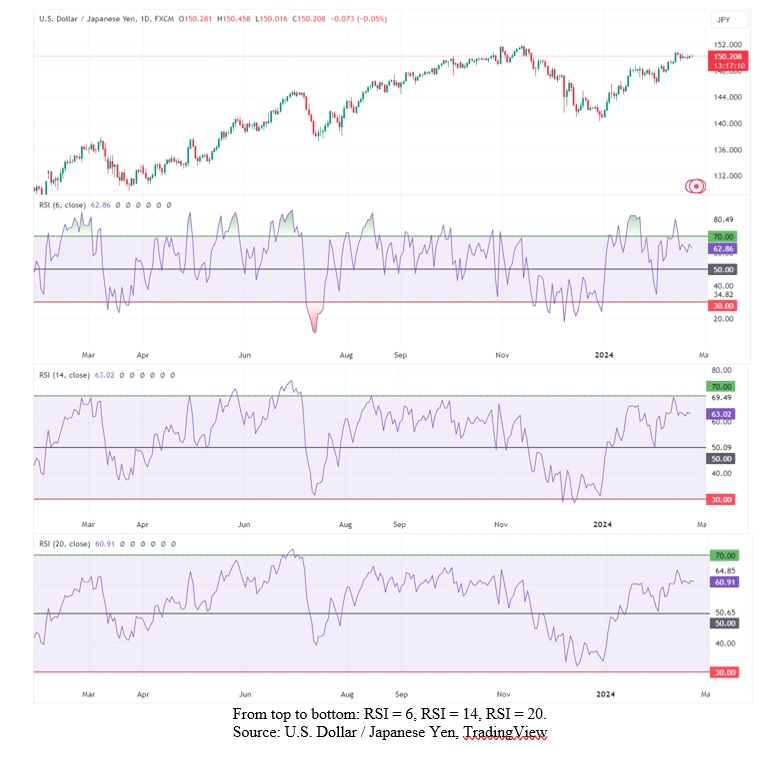
Shorter periods (e.g., 6 or 9 days) may generate more signals and provide more sensitive indications, which are more suitable for short-term investors to determine the immediate trend of the chart and take long or short positions. When interpreting stable data, reducing the time frame might be beneficial as it provides more data to work with. However, it could also result in more false signals,
Longer periods (e.g., 14 or 20 days) may provide fewer and smoother signals, which are more suitable and reliable for long-term investors. Given the high volatility of the FX market, shorter timeframes may result in an overwhelming number of signals, which could make RSI interpretation challenging. Increasing the time frame helps smooth the curve slightly and get into more reasonable positions. But sometimes, it could lag behind price movements.
Below is the chart of USD/JPY over the past one year. When setting the RSI periods to 6, 14 and 20, it can be observed that with a period of 6, there are more signals with greater RSI fluctuations, whereas with a period of 20, there are fewer signals and a smoother RSI trend.
Please remember that RSI is typically not used for extremely long-term trading.
Conclusion
In summary, technical analysis is a powerful forex trading analysis method. The aim of technical analysis is for investors to better understand the trends and ranges within historical data. Investors should pick out their preferred technical indicators, such as the RSI, learn and customise them for their trading strategy. This can help them make informed decisions, identify and capitalise on trading opportunities in the Forex market. Lastly, investors can also consider combining different indicators to achieve long-term success in Forex trading.
Reference:
- [1] https://www.mas.gov.sg/development/foreign-exchange
- [2] https://www.investopedia.com/terms/r/rsi.asp
- [3] https://www.federalreserve.gov/monetarypolicy/fomccalendars.htm
- [4] https://adpemploymentreport.com/
Disclaimer
This material is provided to you for general information only and does not constitute a recommendation, an offer or solicitation to buy or sell the investment product mentioned. It does not have any regard to your specific investment objectives, financial situation or any of your particular needs. Accordingly, no warranty whatsoever is given and no liability whatsoever is accepted for any loss arising whether directly or indirectly as a result of your acting based on this information.
Investments are subject to investment risks. The risk of loss in leveraged trading can be substantial. You may sustain losses in excess of your initial funds and may be called upon to deposit additional margin funds at short notice. If the required funds are not provided within the prescribed time, your positions may be liquidated. The resulting deficits in your account are subject to penalty charges. The value of investments denominated in foreign currencies may diminish or increase due to changes in the rates of exchange. You should also be aware of the commissions and finance costs involved in trading leveraged products. This product may not be suitable for clients whose investment objective is preservation of capital and/or whose risk tolerance is low. Clients are advised to understand the nature and risks involved in margin trading.
You may wish to obtain advice from a qualified financial adviser, pursuant to a separate engagement, before making a commitment to purchase any of the investment products mentioned herein. In the event that you choose not to obtain advice from a qualified financial adviser, you should assess and consider whether the investment product is suitable for you before proceeding to invest and we do not offer any advice in this regard unless mandated to do so by way of a separate engagement. You are advised to read the trading account Terms & Conditions and Risk Disclosure Statement (available online at www.poems.com.sg) before trading in this product.
Any CFD offered is not approved or endorsed by the issuer or originator of the underlying securities and the issuer or originator is not privy to the CFD contract. This advertisement has not been reviewed by the Monetary Authority of Singapore (MAS).
About the author
Wenxuan
Wenxuan, holds a Master's degree in Applied Finance from SMU, and dual Bachelor's degrees in Mathematical Finance and Electronic Science and Technology from Xiamen University. With a profound belief in the synergy between mathematics and finance, she perceives this fusion as instrumental in enhancing analytical capabilities and refining investment strategies and endeavours to leverage this interdisciplinary expertise for financial analysis and investment decisions.

 Predicting Trend Reversals with Candlestick Patterns for Beginners
  Japan’s Economic Resurgence: Unveiling the Tailwinds Behind Nikkei 225’s Record Leap
  What Makes Forex Trading Attractive?
  Playing Defence: Diversification in Forex Trading


