The Law of Large Numbers October 1, 2018

In an earlier article I wrote “Beating the Efficient Market Hypothesis” where I tested for “momentum” in the markets, one of our readers responded by emailing in:

Yes, it was by design that I did it in deciles. Also I have more than two hundred stocks per decile per rebalancing period. But why so many?
This is because of the Law of Large Numbers (LLN).
LLN states that given a sufficiently large enough sample size of independent results, the mean of the sample size is roughly equal to the mean of the population.
To put it simply, if I group enough momentum stocks together, their returns on average will be “momentum-like”. There may be outliers such as outperformers or laggards in the group but aggregating their performance will cancel the effects of those out. The more momentum stocks there are in the group, the more “momentum-like” the portfolio will be on average. Variation of individual returns in the portfolio is likely to be lower as well.
You can test this out yourself with a six-sided dice.
Getting Dicey?
Given a normal six-sided dice with the faces labelled from 1 to 6, the theoretical mean of each throw is (1 + 2 + 3 + 4 + 5 + 6) / 6 = 3.5.
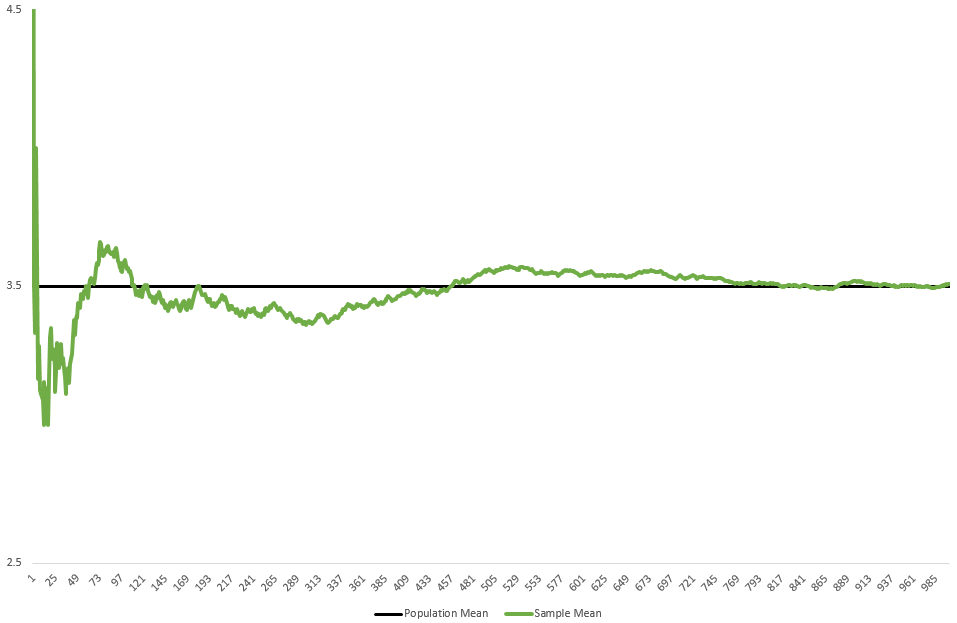
Whether it is luck or skill, our first few throws may give us 1s or 6s, throwing our averages off the theoretical value. As the number of throws increase towards 1,000, the sample mean converges around the theoretical mean at 3.5.
Try doing this in Microsoft Excel with the formula =RANDBETWEEN(1,6).
I have simulated different numbers of throws and produced the results in the table below.
| Number of throws | 1 | 5 | 10 | 20 | 50 | 100 | 200 | 300 | 500 | 1000 |
| Sample Mean | 6.00 | 3.60 | 3.10 | 3.35 | 3.44 | 3.59 | 3.43 | 3.37 | 3.55 | 3.51 |
| Theoretical Mean | 3.5 | 3.5 | 3.5 | 3.5 | 3.5 | 3.5 | 3.5 | 3.5 | 3.5 | 3.5 |
| Difference | 2.500 | 0.100 | 0.400 | 0.150 | 0.060 | 0.090 | 0.070 | 0.130 | 0.054 | 0.009 |
We can also capture the idea visually with a graph:
 Fig 1
Fig 1
Back to the Lab
I started off with “The best performing stocks in the past will continue to be the best performing stocks in the future.”
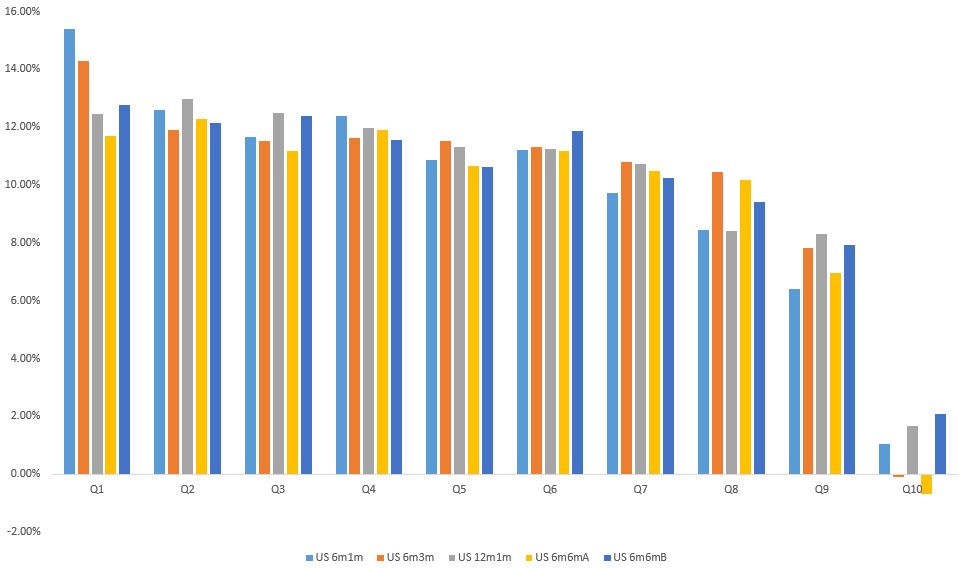
I consider two hundred as a meaningful enough number for each decile to be averaged to “momentum-like”.
The returns of each decile is almost linear. We can see almost immediately:
a. The top half (Q1 to Q5) outperforms the bottom half
b. The top quintile (Q1 & Q2) outperforms the next four quintiles
c. The top decile (Q1) outperforms the rest of the nine deciles
 Fig 2
Fig 2
La crème de la crème?
This got another of our readers thinking:

Surely the cream of the crop is the best?
I can also rephrase the above email, along with the previous email, as such:
How low can we go? What is the minimum number to make this work?
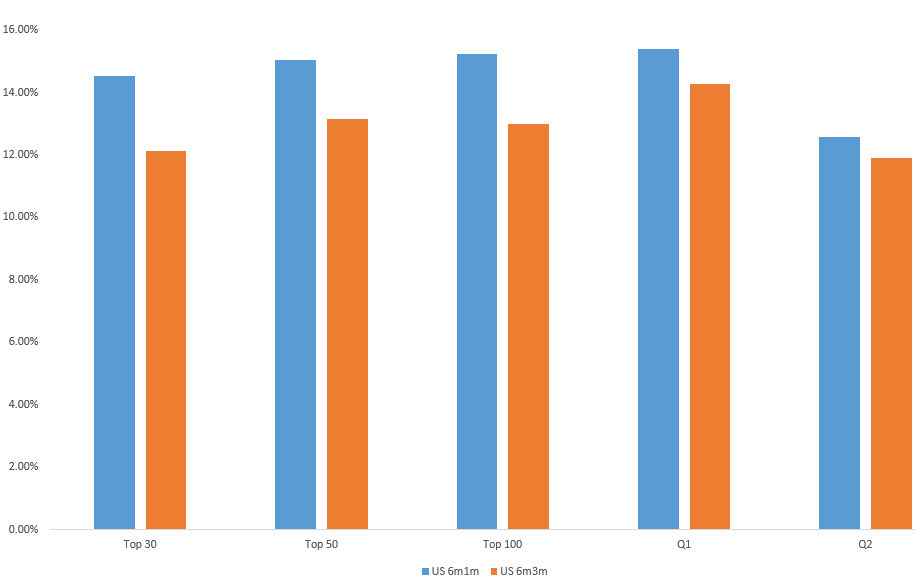
In the previous sample tested, there were about two thousand stocks during the earlier years to about two thousand eight hundred stocks in the recent years. The top decile of the top decile (10% of 10%) is about 20 to 28 stocks per rebalancing period. I’ve decided to round it up for consistency’s sake and chose the top 30 stocks per rebalance period. The top 50 and 100 are also included for good measure. This has produced rather mixed results.
a. While the Top 30 underperforms Q1 (Top 1% underperforms Top 10%)
b. The Top 30/50/100 still outperforms Q2 (although only slightly in 6m3m’s case)
| Top 30 | Top 50 | Top 100 | Q1 | Q2 | |
| US 6m1m | 14.54% | 15.03% | 15.22% | 15.41% | 12.59% |
| US 6m3m | 12.12% | 13.15% | 12.98% | 14.28% | 11.91% |
 Fig 3
Fig 3
The number of stocks to hold also suggests a trade-off between diversification and practical application.
Going by the decile implies a lower standard deviation of returns. Remember LLN? As the number of stocks held increases, sample mean converges to theoretical mean whereas going by an absolute number (Top 30/50/100) is more digestible for a layman.
Now, if only there is something we can do to have the best of both worlds…
Stay tuned for more next time!
(*Please note that information contained in this article is given for educational purposes only. Past performances are not indicative of future returns. All information and opinions provided in this piece do not constitute as investment advice.)
Disclaimer
These commentaries are intended for general circulation. It does not have regard to the specific investment objectives, financial situation and particular needs of any person who may receive this document. Accordingly, no warranty whatsoever is given and no liability whatsoever is accepted for any loss arising whether directly or indirectly as a result of any person acting based on this information. Opinions expressed in these commentaries are subject to change without notice. Investments are subject to investment risks including the possible loss of the principal amount invested. The value of the units and the income from them may fall as well as rise. Past performance figures as well as any projection or forecast used in these commentaries are not necessarily indicative of future or likely performance. Phillip Securities Pte Ltd (PSPL), its directors, connected persons or employees may from time to time have an interest in the financial instruments mentioned in these commentaries. Investors may wish to seek advice from a financial adviser before investing. In the event that investors choose not to seek advice from a financial adviser, they should consider whether the investment is suitable for them.
The information contained in these commentaries has been obtained from public sources which PSPL has no reason to believe are unreliable and any analysis, forecasts, projections, expectations and opinions (collectively the “Research”) contained in these commentaries are based on such information and are expressions of belief only. PSPL has not verified this information and no representation or warranty, express or implied, is made that such information or Research is accurate, complete or verified or should be relied upon as such. Any such information or Research contained in these commentaries are subject to change, and PSPL shall not have any responsibility to maintain the information or Research made available or to supply any corrections, updates or releases in connection therewith. In no event will PSPL be liable for any special, indirect, incidental or consequential damages which may be incurred from the use of the information or Research made available, even if it has been advised of the possibility of such damages. The companies and their employees mentioned in these commentaries cannot be held liable for any errors, inaccuracies and/or omissions howsoever caused. Any opinion or advice herein is made on a general basis and is subject to change without notice. The information provided in these commentaries may contain optimistic statements regarding future events or future financial performance of countries, markets or companies. You must make your own financial assessment of the relevance, accuracy and adequacy of the information provided in these commentaries.
Views and any strategies described in these commentaries may not be suitable for all investors. Opinions expressed herein may differ from the opinions expressed by other units of PSPL or its connected persons and associates. Any reference to or discussion of investment products or commodities in these commentaries is purely for illustrative purposes only and must not be construed as a recommendation, an offer or solicitation for the subscription, purchase or sale of the investment products or commodities mentioned.
About the author
Tan Chek Ann
I sleep in the day and head the dealing desk at night. In my nightly work, I attempt to do analysis and scout around for trading ideas. The work I do tends to lean towards math and science as I’m not too much of an artistically-inclined person. Join me on my journey as I share my thoughts on various topics – though mostly still financial stuff. Reach me at tanca@phillip.com.sg

 Back in Business: The Return of IPOs & Top Traded Counters in March 2024
  From $50 to $100: Unveiling the Impact of Inflation
  How to soar higher with Positive Carry!
  Why 2024 Offers A Small Window of Opportunity and How to Position Yourself to Capture It


