
Adobe Inc - Massive growth as all things go digital
8 Mar 2022- Creative Cloud revenue expanded at 21% CAGR in the past three years. We expect Creative to see significant growth (total addressable market of US$63bn by 2024) ahead due to shift to digital, explosive content creation, and rising e-commerce penetration.
- Document Cloud business momentum was strong in FY21, with 100% YoY growth of Acrobat Web monthly active users and 85% YoY growth in Adobe Sign transactions in Acrobat. We model Document Cloud revenue growth of 19% YoY in FY22e driven by expansion of digital document use cases, e-signatures, and collaboration features.
- Adobe’s margins (gross and operating margins of 88% and 37% in FY21) are impressive and generate massive amounts of FCF. We initiate coverage with a BUY recommendation and DCF-based target price (WACC 6.2%) of US$658.
Company Background
Adobe (ADBE) offers software for creative content and marketing purposes, with an emphasis on user experience. Its revenue segments are Digital Media (73% of FY21 revenue), Digital Experience (25%), and Publishing and Advertising (2%). While most people are familiar with Adobe’s Acrobat product, Adobe’s Creative Cloud segment includes more than 20 photo and video edit applications, including Photoshop (Figure 1) and Illustrator.
Investment Merits
- Digital content creation is rising. Adobe’s Creative Cloud caters to the demands of creative professionals. The Creative Cloud segment grew its revenue by a CAGR of 21% over the last three years. It reported an impressive US$10.2bn in annual recurring revenue (ARR) in FY21. Adobe’s management expects its Creative Cloud total addressable market (TAM) to reach US$63bn by 2024. The main drivers for this expected growth are rising demand for content creation by consumers (i.e Facebook, Instagram, and TikTok), digitization (fueled in part by the COVID-19 pandemic), expansion of non-professional creatives, upskilling, and greater individual usage (particularly with rise of mobile). We expect Creative Cloud to continue strong revenue growth of 13% YoY in FY22e.
- A strong player in digital signatures. The COVID-19 pandemic enhanced the digital signature industry and cloud document management. Adobe’s Document Cloud boosts document productivity by fueling the paper-to-digital transition and enabling all document activities seamlessly across web, desktop, and mobile. The company witnessed significant growth in Acrobat Web, with monthly active users up over 100% YoY in FY21. Also, Adobe’s strategy of combining Adobe Sign and Acrobat is paying off, with Adobe Sign transactions in Acrobat up 85% YoY. Document Cloud ARR grew to US$1.9bn in FY21, representing 31% YoY growth. Even when the economy recovers, we believe paper-to-digital movement will continue to be a strong tailwind for ADBE for several years to come. We expect Document Cloud revenue growth of 19% YoY in FY22e.
- Adobe generates incredible margins. Adobe’s subscription revenue grew 25% YoY in FY21 and reported an impressive gross margin of 88%. Operating margin also expanded to 37% as lots of new customers signed up for Adobe’s myriad of services. We expect operating margins to track above 35% in FY22e and FY23e.
We initiate coverage with a BUY rating. Our target price is US$658 based on a DCF valuation with a WACC of 6.2% and terminal growth of 4.0%.
REVENUE
Adobe has three revenue segments: Digital Media (73% of FY21 revenue) comprising revenue from two major business units Creative Cloud and Document Cloud; Digital Experience (25%) including revenue from Experience Cloud Subscription; and Publishing and Advertising (2%) consisting of revenue from a diverse range of legacy products and services. Main markets are the Americas (57%), EMEA (27%), and the APAC (16%).
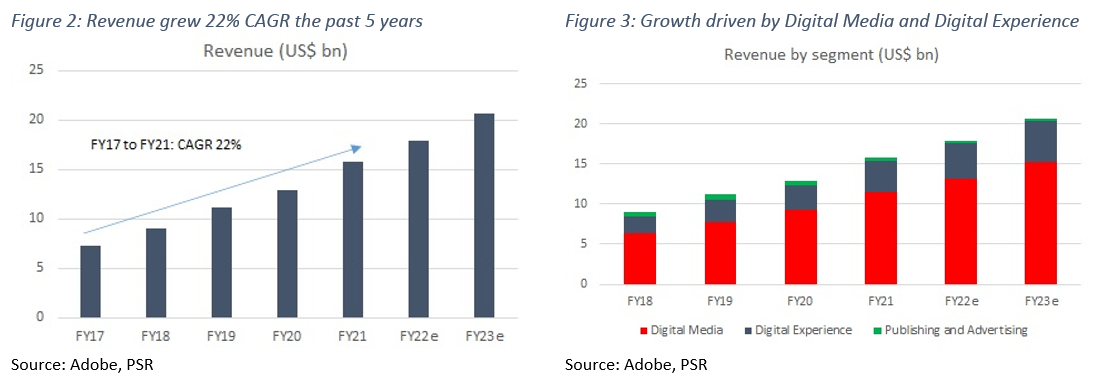
Total revenue expanded at 22% CAGR in the past five years (Figure 2). Growth was driven by Digital Media and Digital Experience which grew at 22% and 23% CAGR respectively in the past three years (Figure 3). We expect these two segments to continue strong growth driven by digital transformation initiatives, solid demand for cloud document management (Figure 4), and enterprise momentum with Digital Experience. Acquisitions like Frame.io and WorkFront, as well as new product launches, might contribute incrementally.
EXPENSES
Cost of sales and total operating expenses grew 18% CAGR in the past five years. Cost of sales was 12% of FY21 revenue, while Research and Development (16%), Sales and Marketing (27%), General and Administrative (7%), and Amortization of Intangibles (1%) made up operating expenses. Total Operating Expense as a percentage of revenue has been reducing over the last 5 years, from 61% in FY16 to 51% in FY21, leading to improved operating and gross margins.
MARGINS
Gross margins hit an all-time high of 88% in FY21, up by 160 basis points (bps) from FY20. Gross margins appear to be on an upward trend over the past five years, and we expect this to continue because of the increased scalability of the business.
Net margins (reported) in FY21 were 31%, down from 41% the previous year. The change is primarily because of the one-time tax benefits completed during FY20. Adobe anticipates margins to fall slightly because some savings (such as T&E) are expected to be rolled back into the model in FY22e.
BALANCE SHEET
Assets: Cash and cash equivalents decreased by about US$0.6bn YoY in FY21 to US$3.8bn, largely due to share repurchases and acquisitions. Plant, property and equipment for FY21 was US$1.7bn, an increase of US$156mn from the previous year, largely due to ongoing CAPEX spending. The company’s current ratio for FY21 was 1.2x.
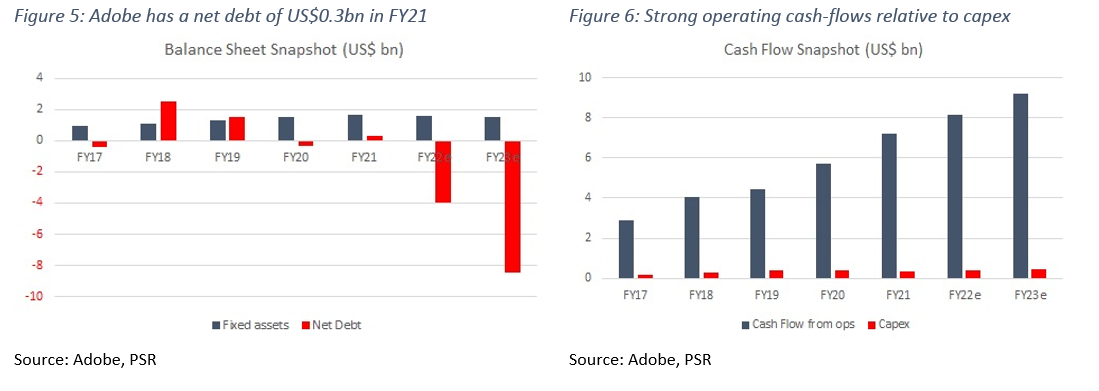
Liabilities: Current liabilities for FY21 were US$6.9bn, almost US$1.4bn more than FY20. This increase was mainly due to a rise in accrued expenses and deferred revenue. Non-current liabilities saw a jump of US$4mn in FY21. Adobe had a net debt position of US$279mn in FY21 (Figure 5). ADBE’s debt-to-equity ratio remains low at only 0.3x.
CASH-FLOW
Cash-flow from operations has steadily grown at 27% CAGR to US$7.2bn (Figure 6) from FY17 to FY21. CAPEX stood at US$0.3bn in FY21, at 11% CAGR over FY17-21. In FY21, Adobe generated US$6.9bn in free cash flow. This translates to an enviable 44% free cash flow margin. Adobe’s ability to generate large amounts of cash allows it to acquire firms or return cash to shareholders (repurchase). The software company has a share repurchase authorization of up to US$13.1bn expiring in 2024.
BUSINESS MODEL
The rise of digital content has been the secular tailwind driving Adobe’s growth story over the last few years. As of FY21, about 92% of ADBE’s revenue is recurring and derived from subscription models.
Digital Media (73% FY21 revenue). ADBE reported Digital Media revenue of US$11.5bn, representing 25% YoY growth. Products in this segment fall under two categories:
1) Creative Cloud – This provides applications and services for photography, video/film, animation, design; and
2) Document Cloud – This offers solutions to create, edit, approve, share, scan, and sign secured digital documents.
Creative Cloud is the core of ADBE’s business, as it has consistently accounted for ~60% of total revenue over the last few years. It grew from US$5.3bn in FY18 to US$9.5bn in FY21 (Figure 7). And on an ARR basis, Creative Cloud accounted for 84% of total Digital Media ARR in FY21. Creative Cloud revenue growth was driven by new user acquisitions on the ADBE website, strength in the Creative Cloud Teams product offering, and focus on co-selling Frame.io with its Creative Cloud enterprise offerings. Frame.io is a cloud-based video collaboration platform that enables editors and key project stakeholders to collaborate using cloud-based workflows. Furthermore, content creation and consumption across devices is growing. We expect that Creative Cloud adoption will continue to rise at a healthy rate even when the economy recovers.
Within Creative Cloud, Adobe has developed a robust and comprehensive platform that eliminates the need for users to have external sources for fonts, storage, and stock photos. In addition, we think Adobe could capture market share across several emerging technologies like 3D and augmented reality. Adobe has identified a US$63bn TAM for Creative Cloud in 2024, up from US$41bn in 2023. This TAM comprises US$25bn from creative professionals, US$31bn from communicators, and US$7bn from consumers. We expect Creative Cloud revenue to grow 13% in FY22e.
ADBE reported Document Cloud revenue of US$2bn in FY21, representing 32% YoY growth (Figure 8). The COVID-19 pandemic drove business operations online from offline at an accelerated pace. Business operations that were previously done on paper had to be converted to a digital format overnight. This has fueled the company’s Document Cloud business, and we expect it to continue to do so. Adobe estimates its Document Cloud business to represent a US$32bn opportunity in 2024, up 52% from US$21bn in 2023. We expect Document Cloud revenue to grow 19% in FY22e.
Digital Experience (25%). Digital Experience provides tools to analyze marketing spend, optimize advertisements, and manage ad campaigns. The Experience Cloud platform includes four product categories:
- Content and commerce – This provides tools to assist both mid-market and enterprise organizations in creating and managing e-commerce experiences (Adobe Experience Manager and Adobe Commerce).
- Data insights and audiences – This provides real-time analytics (Adobe Analytics, Real-time Customer Data Platform, and Audience Manager).
- Customer journey management – This enables businesses to manage marketing and advertising campaigns across B2B, B2C, and B2E use cases (Adobe Campaign and Marketo Engage).
- Workflow management – Through the acquisition of Workfront in 2020, Adobe offers work management software to assist businesses in managing their marketing and creative workflows.
ADBE reported total Digital Experience revenue of US$3.9bn in FY21, representing 24% YoY growth (Figure 9). Experience Cloud Subscription revenue was US$3.4bn with a growth of 27% YoY. This was driven by a seasonally solid quarter for Enterprise activity with subscription bookings increasing by more than 50% YoY in the fourth quarter of 2021. Also, Adobe Experience Platform customers increased by 300% YoY in FY21.
In Experience Cloud, we believe Adobe is well-positioned to benefit from the significant surge in e-commerce and rising demand for enhanced customer experiences anytime, anywhere. We also see Adobe’s strategic acquisition of Workfront as a significant growth driver for this segment. Adobe projects Digital Experience TAM to be US$110bn by 2024, a 29% increase from the 2023 estimated TAM. We expect Digital Experience revenue to grow 14% in FY22e.
Publishing and Advertising (2% FY21 revenue). The publishing and advertising segment is the legacy portion of ADBE’s business. It includes printing technology, e-learning solutions, and web conferencing applications. This business’ revenue has been falling, but only makes up 2-3% of the company’s total revenue.
INDUSTRY
The surge in digital content over the last decade is a long-term growth driver to Adobe’s numerous businesses, and we believe that trend will not slow down anytime soon.
Creative Cloud. The market for Creative Cloud remains significant and growing. According to Statista, the global creative software segment is expected to see a CAGR of 5% between 2022 and 2026 to reach US$10.8bn. The growth in creative jobs, adoption of latest mediums, high-quality innovative communication, and surge in people posting on social media platforms are all broadening the customer universe. ADBE’s key competitors in the Creative Cloud market include CorelDRAW, Affinity, Autodesk, and Getty Images.
Document Cloud. According to MarketsandMarkets, the global e-signature market is expected to see a CAGR of 33% between 2021 and 2026 to reach US$16.8bn. The primary reasons that are expected to fuel the growth of the e-signature market include increased spending on digital documents by government agencies and companies, improved security with a regulated and seamless workflow, and enhanced end-to-end customer experience.
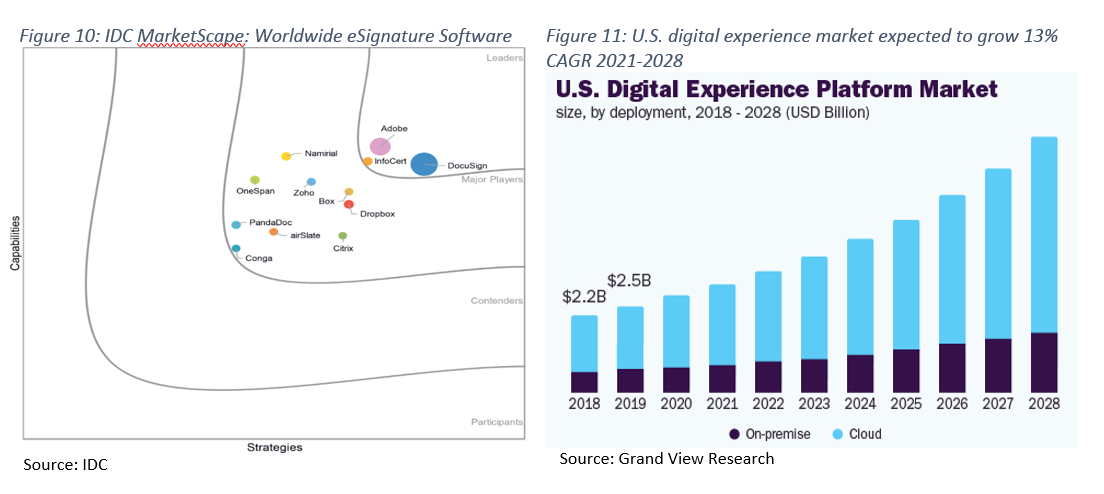
Notably, research firm IDC recently recognized Adobe as the leading provider of e-signature software, though DocuSign is ahead (Figure 10). ADBE’s other competitors in the e-signature market are Box and Dropbox.
Digital Experience. According to Grand View Research, the global digital experience platform market size, valued at an estimated US$10.2bn in 2021, is set to reach US$22.9bn in value by 2028, which indicates a 12% CAGR. The US digital experience market size is expected to see a CAGR of 13% (Figure 11). The main drivers for this expected growth are increased preference of companies to deliver personalized and optimized user experience and engagement across several marketing channels. ADBE’s key competitors in the market include Salesforce.com, Microsoft, and Oracle.
Risks
- Weak advertisement and marketing spend could hurt Adobe. Adobe’s business is closely linked to the marketing spending and the macro economic situation. If the spending environment significantly slows, either as a result of the impacts of COVID-19 pandemic or an economic downturn, ADBE’s business across the board could get hurt.
- Piracy poses a significant risk. Adobe defends its intellectual property rights, but the company loses revenue as a result of the illegal use of its software. Adobe’s business can suffer if piracy rises.
- Fierce competition. The level of competition in the marketplaces in which ADBE competes (mainly for Digital Media and Experience) is increasing, with the opportunity for new entrants to win market share through modern technology.
Valuation
We initiate coverage on Adobe Inc. with a BUY rating and a price target of US$658.00. Our valuation is based on DCF valuation, using a 6.2% WACC and 4.0% terminal growth rate (Figure 12).
Rule of 40
The Rule of 40 is a metric that measures the balance between growth and profitability. It considers revenue growth and EBITDA margin, the total of which must be more than 40% to satisfy the criteria.
The sum of ADBE’s three-year average revenue growth of 20% and EBITDA margin of 42% equals 62%, which fulfils the Rule of 40 criteria.
About the author
Ambrish Shah
US Technology Analyst (Software/Services)
PSR
Important Information
This report is prepared and/or distributed by Phillip Securities Research Pte Ltd ("Phillip Securities Research"), which is a holder of a financial adviser’s licence under the Financial Advisers Act, Chapter 110 in Singapore.
By receiving or reading this report, you agree to be bound by the terms and limitations set out below. Any failure to comply with these terms and limitations may constitute a violation of law. This report has been provided to you for personal use only and shall not be reproduced, distributed or published by you in whole or in part, for any purpose. If you have received this report by mistake, please delete or destroy it, and notify the sender immediately.
The information and any analysis, forecasts, projections, expectations and opinions (collectively, the “Research”) contained in this report has been obtained from public sources which Phillip Securities Research believes to be reliable. However, Phillip Securities Research does not make any representation or warranty, express or implied that such information or Research is accurate, complete or appropriate or should be relied upon as such. Any such information or Research contained in this report is subject to change, and Phillip Securities Research shall not have any responsibility to maintain or update the information or Research made available or to supply any corrections, updates or releases in connection therewith.
Any opinions, forecasts, assumptions, estimates, valuations and prices contained in this report are as of the date indicated and are subject to change at any time without prior notice. Past performance of any product referred to in this report is not indicative of future results.
This report does not constitute, and should not be used as a substitute for, tax, legal or investment advice. This report should not be relied upon exclusively or as authoritative, without further being subject to the recipient’s own independent verification and exercise of judgment. The fact that this report has been made available constitutes neither a recommendation to enter into a particular transaction, nor a representation that any product described in this report is suitable or appropriate for the recipient. Recipients should be aware that many of the products, which may be described in this report involve significant risks and may not be suitable for all investors, and that any decision to enter into transactions involving such products should not be made, unless all such risks are understood and an independent determination has been made that such transactions would be appropriate. Any discussion of the risks contained herein with respect to any product should not be considered to be a disclosure of all risks or a complete discussion of such risks.
Nothing in this report shall be construed to be an offer or solicitation for the purchase or sale of any product. Any decision to purchase any product mentioned in this report should take into account existing public information, including any registered prospectus in respect of such product.
Phillip Securities Research, or persons associated with or connected to Phillip Securities Research, including but not limited to its officers, directors, employees or persons involved in the issuance of this report, may provide an array of financial services to a large number of corporations in Singapore and worldwide, including but not limited to commercial / investment banking activities (including sponsorship, financial advisory or underwriting activities), brokerage or securities trading activities. Phillip Securities Research, or persons associated with or connected to Phillip Securities Research, including but not limited to its officers, directors, employees or persons involved in the issuance of this report, may have participated in or invested in transactions with the issuer(s) of the securities mentioned in this report, and may have performed services for or solicited business from such issuers. Additionally, Phillip Securities Research, or persons associated with or connected to Phillip Securities Research, including but not limited to its officers, directors, employees or persons involved in the issuance of this report, may have provided advice or investment services to such companies and investments or related investments, as may be mentioned in this report.
Phillip Securities Research or persons associated with or connected to Phillip Securities Research, including but not limited to its officers, directors, employees or persons involved in the issuance of this report may, from time to time maintain a long or short position in securities referred to herein, or in related futures or options, purchase or sell, make a market in, or engage in any other transaction involving such securities, and earn brokerage or other compensation in respect of the foregoing. Investments will be denominated in various currencies including US dollars and Euro and thus will be subject to any fluctuation in exchange rates between US dollars and Euro or foreign currencies and the currency of your own jurisdiction. Such fluctuations may have an adverse effect on the value, price or income return of the investment.
To the extent permitted by law, Phillip Securities Research, or persons associated with or connected to Phillip Securities Research, including but not limited to its officers, directors, employees or persons involved in the issuance of this report, may at any time engage in any of the above activities as set out above or otherwise hold an interest, whether material or not, in respect of companies and investments or related investments, which may be mentioned in this report. Accordingly, information may be available to Phillip Securities Research, or persons associated with or connected to Phillip Securities Research, including but not limited to its officers, directors, employees or persons involved in the issuance of this report, which is not reflected in this report, and Phillip Securities Research, or persons associated with or connected to Phillip Securities Research, including but not limited to its officers, directors, employees or persons involved in the issuance of this report, may, to the extent permitted by law, have acted upon or used the information prior to or immediately following its publication. Phillip Securities Research, or persons associated with or connected to Phillip Securities Research, including but not limited its officers, directors, employees or persons involved in the issuance of this report, may have issued other material that is inconsistent with, or reach different conclusions from, the contents of this report.
The information, tools and material presented herein are not directed, intended for distribution to or use by, any person or entity in any jurisdiction or country where such distribution, publication, availability or use would be contrary to the applicable law or regulation or which would subject Phillip Securities Research to any registration or licensing or other requirement, or penalty for contravention of such requirements within such jurisdiction.
This report is intended for general circulation only and does not take into account the specific investment objectives, financial situation or particular needs of any particular person. The products mentioned in this report may not be suitable for all investors and a person receiving or reading this report should seek advice from a professional and financial adviser regarding the legal, business, financial, tax and other aspects including the suitability of such products, taking into account the specific investment objectives, financial situation or particular needs of that person, before making a commitment to invest in any of such products.
This report is not intended for distribution, publication to or use by any person in any jurisdiction outside of Singapore or any other jurisdiction as Phillip Securities Research may determine in its absolute discretion.
IMPORTANT DISCLOSURES FOR INCLUDED RESEARCH ANALYSES OR REPORTS OF FOREIGN RESEARCH HOUSE
Where the report contains research analyses or reports from a foreign research house, please note:
- recipients of the analyses or reports are to contact Phillip Securities Research (and not the relevant foreign research house) in Singapore at 250 North Bridge Road, #06-00 Raffles City Tower, Singapore 179101, telephone number +65 6533 6001, in respect of any matters arising from, or in connection with, the analyses or reports; and
- to the extent that the analyses or reports are delivered to and intended to be received by any person in Singapore who is not an accredited investor, expert investor or institutional investor, Phillip Securities Research accepts legal responsibility for the contents of the analyses or reports.


 SATS Ltd - Strong cargo volumes, new contract wins drive growth
 LHN Ltd – Co-living franchise scaling faster