
Microsoft Corp - Winning the global enterprise on cloud and security
13 Dec 2021- Microsoft’s cloud business, Azure, has doubled its market share, leveraging on the installed base of 72% of global enterprise servers with attractive pricing.
- Cybersecurity demand is accelerating upgrades to MSFT’s higher-end licenses, helping sustain historically high operating margins above 40%.
- Core productivity software user base still growing in the teens, reaching 300mn in FY21. A further boost is recent price increases starting in March 2022. We initiate coverage with a BUY recommendation and DCF-based target price (WACC 6.2%) of US$405.
Company Background
Microsoft (MSFT) offers software and cloud-based solutions to enterprises and consumers, as well as hardware comprising laptops and gaming consoles. Its revenue segments are Productivity and Business Processes (32% of FY21 revenue), Intelligent Cloud (36%) and More Personal Computing (32%). The US contributes 50% of MSFT’s revenue.
Investment Merits
- Cloud adoption driven by vast enterprise installed base. Azure, MSFT’s cloud service and the 2nd largest global cloud provider, doubled its market share from 10% to 20% between 2017 and 2021. And it is expected to expand further as enterprises choose Azure as their primary cloud vendor due to existing relationships with MSFT. 72% of servers worldwide and 83% of global personal computers are licensed with the Windows operating system. Azure discounts for existing Windows and SQL Servers allow customers to pay 5x less (Figure 8) than for competitor Amazon Web Services (AWS). Customers also choose Azure over concerns about competition from AWS and Google, whose businesses are built on selling ads and products. Azure is MSFT’s fastest growing segment at 66% CAGR in the past five years. We expect it to continue strong revenue growth of 41% in FY22.
- Cybersecurity driving demand for premium licenses. MSFT’s highest-end E5 license user base as a percentage of MSFT’s total commercial Office 365 user base rose from 5% to 8% in FY21. Customers are upgrading for better security after major cyberattacks in 2021. Cybersecurity is price inelastic, with hackers demanding ransoms of up to US$18mn. MSFT’s scale as the largest global cybersecurity company with over 3,500 cybersecurity staff is seen as capable of managing larger contracts and being able to better respond to cyberattacks. An executive order also drove federal institutions to upgrade cybersecurity postures. License upgrades helped drive ARPU up 7% and operating margins to a 19-year high of 42% in FY21. We expect license upgrades to drive commercial cloud revenues up 30% in FY22, sustaining operating margins above 40%.
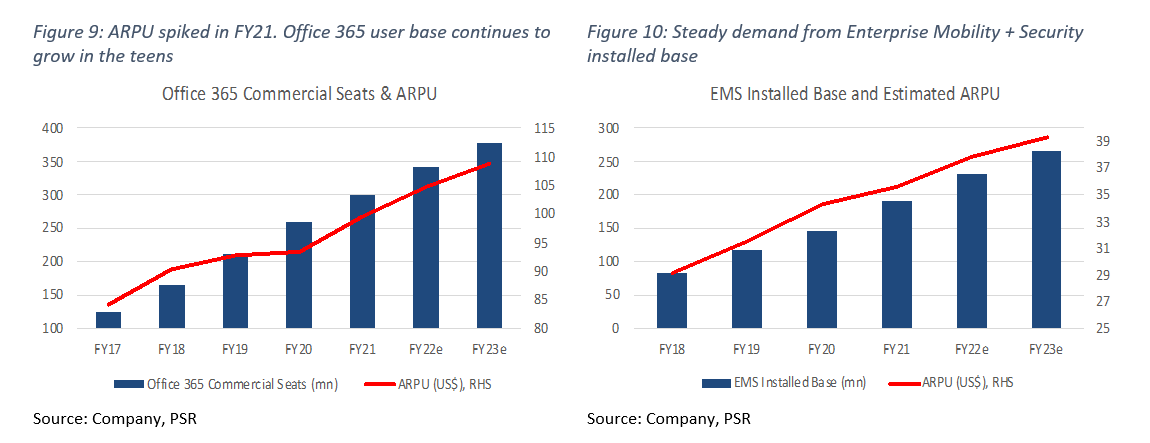
- Core productivity software still growing in double digits. Despite a high penetration of 89% share in the productivity software market, paid Office 365 Commercial seats are still growing in double digits, at 17% YoY to 300mn seats in FY21 (Figure 9). Continued economic recovery is driving demand from small and medium businesses. Future growth will also be driven by price increases of up to 25% kicking in on 1 March 2022 for MSFT’s commercial 365 products. Price increases are relatively higher for lower-end licenses which could incentivise new customers to purchase higher-end licenses. We expect the Productivity and Business Processes segment revenue to grow 17% in FY22, higher than the five-year average of 16%.
We initiate coverage with a BUY rating. Our target price is US$405 based on a DCF valuation with a WACC of 6.2% and terminal growth of 4.0%
REVENUE
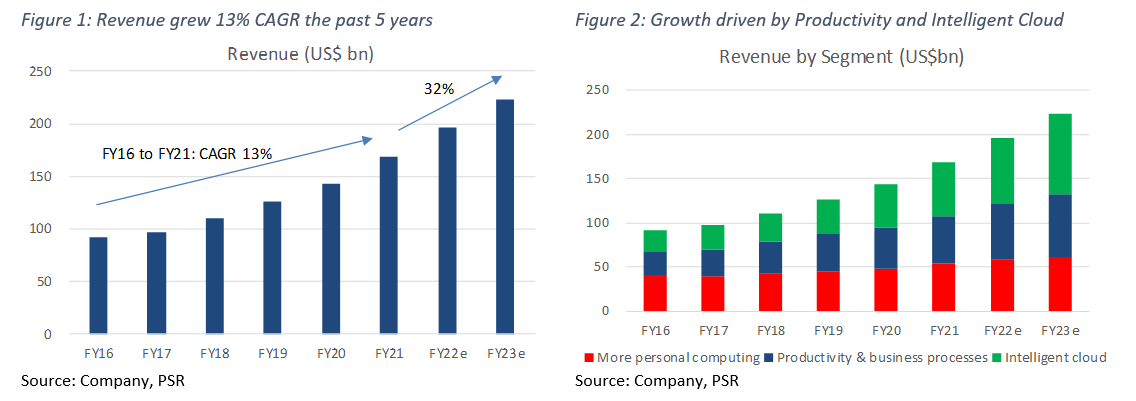
Microsoft has three revenue segments: Productivity and Business Processes (32% of FY21 revenue) comprising revenue from commercial Office products and LinkedIn; Intelligent Cloud (36%) including revenue from Azure, server and cloud services and other enterprise services; and More Personal Computing (32%) consisting of revenue from the Windows operating system, search advertising, device sales and gaming. The US contributed 50% of FY21 revenue, with the remainder coming from other countries.
Total revenue expanded at 13% CAGR in the past five years (Figure 1). Growth was driven by commercial Office products and Azure which grew at 59% and 12% CAGR respectively in the past three years (Figure 2). We expect these two segments to continue strong growth as MSFT’s vast installed base moves to the cloud, and cybersecurity, economic recovery and price increases provide tailwinds for MSFT’s software licenses.
EXPENSES
Cost of sales and total operating expenses grew 10% and 7% CAGR respectively in the past five years. Cost of sales was 31% of FY21 revenue, while Sales and Marketing (12%), General Administrative (3%) and Research and Development (12%) made up operating expenses. All expenses have grown at a slower rate than revenue over the past five years, leading to improved operating and gross margins.
MARGINS
Operating margins improved from 30% to 42% in the past five years as revenue growth outpaced expenses. Operating margins from Productivity and Business Processes are at a five-year high of 45%, up from 38% in FY17, driven by growing Office 365 commercial seats at 24% CAGR and rising ARPUs at 4% CAGR. Similarly for Intelligent Cloud, operating margins are up from 33% to 43% over the same period.
BALANCE SHEET
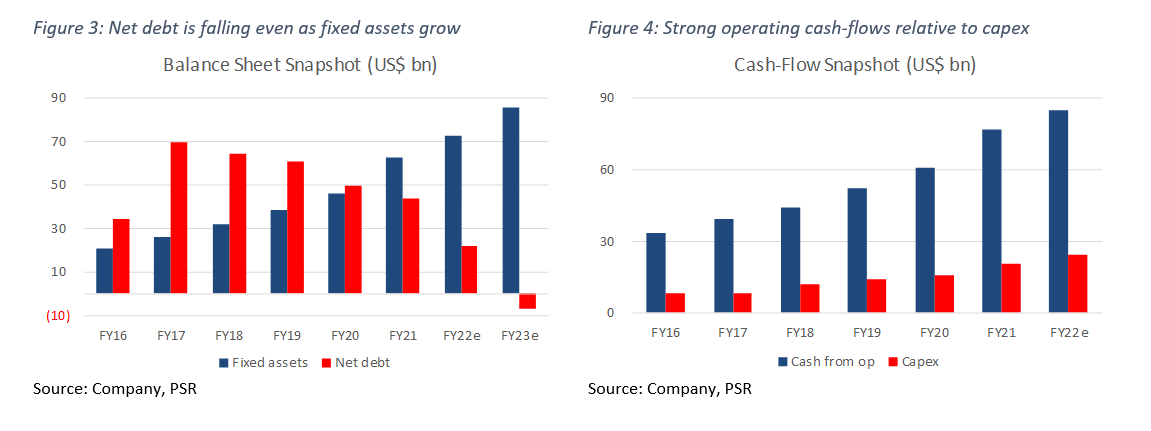
Assets: Fixed assets have grown 25% CAGR in the last five years to US$62bn (Figure 3) in FY21 as MSFT expanded its data centre portfolio. Fixed assets have risen from 10% to 19% of total assets in the period. Goodwill has also grown 23% CAGR to US$50bn following acquistions in LinkedIn and others in areas of cybersecurity, cloud and artificial intelligence.
Liabilities: MSFT has a net debt of US$44bn. Net debt has fallen over the years even as fixed assets have grown (Figure 3).
CASH-FLOW
Cash-flow from operations has steadily grown at 18% CAGR to US$77bn (Figure 4) from FY16 to FY21. Capex stood at US$21bn in FY21, growing at 20% CAGR.
BUSINESS MODEL
As of FY21, we estimate 70% of MSFT’s revenue is recurring and derived from subscription models.
Productivity and Business Processes (32% FY21 revenue). Products in this segment fall under three categories:
1) Commercial and consumer Office 365 – subscriptions and on-premise licenses comprising software for Office, Exchange, SharePoint, Microsoft Teams, Office 365 Security and Compliance, Skype for business and consumer, Outlook.com, and OneDrive;
2) LinkedIn – Talent Solutions, Marketing Solutions, Premium Subscriptions, Sales Solutions, and Learning Solutions; and
3) Dynamics 365 – a set of intelligent, cloud-based and on-premises applications such as Customer Insights, Power Apps, and Power Automate that encompass enterprise resource planning (ERP), customer relationship management (CRM) activities.
Office commercial products were 24% of FY21 revenue. They grew at 12% CAGR from US$24bn to US$40bn between FY17 and FY21, driven by a 24% CAGR rise in Office 365 commercial seats to 300mn and a 4% CAGR in ARPU to US$100. ARPU spiked 7% in FY21 (Figure 9), the fastest in three years, driven by higher demand for premium licenses. This has been attributed to cyberattacks in 2021 driving demand for MSFT’s higher-end security offerings, and increasing need for General Data Protection Regulation (GDPR) compliance in the European Union driving demand for MSFT’s higher-end compliance offerings. The major cyberattacks in 2021 included SolarWinds (US$18mn ransom), Microsoft Exchange, the Colonial pipeline (US$5mn), and the JBS meat processing plant (US$11mn) hacks. In FY21, MSFT’s highest-end E5 license user base as a percentage of MSFT’s total commercial Office 365 user base rose from 5% to 8%. Commercial Office 365 seat growth (Figure 9) is also being supported by continued economic recovery driving demand from small and medium businesses. We expect productivity and business processes revenue to grow 17% in FY22e, slightly higher than the five-year historical average of 16%.
In addition to the secular tailwinds in cybersecurity and compliance, MSFT announced maiden price increases for its 365 SKU licenses kicking in on 1 March 2022. Many customers may not experience the price increase until FY24/25 as enterprise agreements for the licenses are typically three years. However, we note that higher price increases for lower-end licenses could incentivise new customers to purchase higher-end SKUs. We do not expect much churn due to ongoing innovation and services that come with the licenses and there being no prior price increases historically.
Intelligent Cloud (36%). Microsoft is a provider of public, private, and hybrid server products and cloud services. These include Azure (MSFT’s cloud product), SQL Server, Windows Server, Visual Studio, System Center, related Client Access Licenses (CALs), and GitHub. This segment also includes Enterprise Services, including Premier Support Services and Microsoft Consulting Services.
Azure’s revenue, estimated to be 18% of FY21 revenue, is mainly derived through infrastructure-as-a-service (IaaS) and platform-as-a-service (PaaS) consumption-based services charged on a pay-as-you-go basis, and per user-based services through the Enterprise Mobility + Security licenses (Figure 10) which allow users to access MSFT applications via multiple devices securely. Azure is MSFT’s fastest growing business with revenue growing at 66% CAGR in the last five years. It is expected to grow 41% in FY22e as it remains a popular choice among global enterprises adopting cloud computing who are already clients of MSFT servers and software. Operating margins have also steadily improved from 33% to 43% from FY17 to FY21.
Azure’s strength also lies in its hybrid cloud focus. According to the RightScale State of the Cloud report 2019, hybrid cloud is the dominant enterprise strategy, with 58% of respondents stating that they prefer using private/on-premise cloud together with public cloud and not rely on the public cloud in totality. They need the private cloud for data sovereignty/regulatory challenges, and network challenges where they may not have enough bandwidth or don’t want to rely on internet connectivity for workloads to run. Microsoft Azure’s capability in hybrid cloud is superior to AWS and Google Cloud Platform and therefore captures this market more.
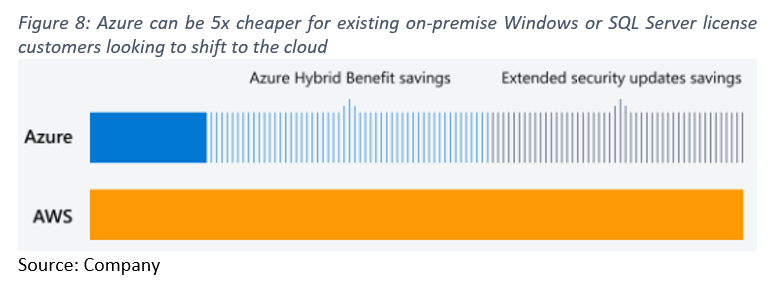
- Azure Hybrid Benefit is a cost-savings benefit for existing on-premises licenses shifting to Azure. Existing customers do not have to pay for a new license for SQL or Windows Server on Azure, which they will need to repurchase on other cloud providers.
- Azure offers free extended security updates for Windows server 2012/R2 for existing on-premise license customers for three more years.
More Personal Computing (32%). The products include: 1) Windows operating system (commercial and consumer), Windows Internet of Things, and MSN advertising; 2) Devices including Surface and PC accessories; 3) Gaming, including Xbox hardware and Xbox content and services, comprising digital transactions, Xbox Game Pass and other subscriptions, video games, third-party video game royalties, cloud services, and advertising; and 4) Search advertising – Bing and Microsoft Advertising. MSFT’s devices are primarily manufactured by third-party contract manufacturers.
Revenue from More Personal Computing grew at a modest 6% CAGR in the last five years, however operating margins have markedly improved from 15% to 36%. We believe this is due to stronger growth in the higher margin Windows, Search Advertising and Gaming segments, which grew 6%, 10% and 11% CAGR respectively compared to a decline in revenue from Devices of 3% CAGR.
INDUSTRY
Cloud computing. Gartner forecasts end-user spending on public cloud services to reach US$396bn in 2021, and grow 22% to reach US$482bn in 2022. Additionally, Gartner predicts public cloud spending by 2026 will exceed 45% of all enterprise IT spending, up from less than 17% in 2021. AWS currently holds a 33% share of the cloud infrastructure services market. It is followed by Microsoft Azure at 20%, and Google Cloud Platform at 10%. Azure’s market share has increased from 10% to 20% between 2017 and 2021 as an installed base of enterprises have chosen Azure as their primary cloud vendor.
Productivity software. The global productivity management software market size was valued at US$43bn in 2020 and is expected to grow at a CAGR of 14% from 2021 to 2028, according to Grand View Research. The rising need to manage tasks and workflow among the business and swiftly growing advancements in the areas of Machine Learning and Artificial Intelligence are the key factors driving market growth. Microsoft’s Office 365 is the clear leader with 89% market share in 2020 according to Gartner, with Google’s Workspace in second place with a 10% share. Other competitors for Office include software and global application vendors, such as Apple, Cisco Systems, Facebook, IBM, Okta, Proofpoint, Slack, Symantec, Zoom.
Risks
- Fiercer competition from AWS and Google Cloud Platform. AWS has had a seven-year headstart on Microsoft Azure in the cloud market and is ahead in the number of deals it owns. It is also ranked higher by Gartner in terms of ability to execute and reliability. MSFT sales partners have also seen a challenge from Google in deals where MSFT used to play successfully given its deep enterprise knowledge. However, the recent introduction of new cloud solutions for financial services, manufacturing and non-profits, as well as expansion of its cloud regions to 73, more than AWS’ 24 should help Azure continue to grow market share.
- Lower gross margins. In MSFT’s 4Q21 earnings call, management guided for lower gross margins impacted by a revenue mix shift to Azure (pay-as-you-go model), increasing investments to support customer success, and ongoing strategic investments across the business. Though we believe it is unlikely, there is a risk that gross margins may come in lower than expected. We have forecasted gross margins of 68% in FY22, down slightly from 69% in FY21.
Higher-than-expected supply chain impact on Surface laptop and Xbox. Ongoing supply chain and chip shortages have led to MSFT being unable to meet demand for its laptop and gaming console hardware. Shortages have resulted in significant lead times and supply volatility and could come in worse than expected. Despite this, management has kept a strong forecast of between US$16.35bn and US$16.75bn for its More Personal Computing segment.
Valuation
We initiate coverage on Microsoft Corp with a BUY recommendation. We have a DCF valuation of US$405.00 based on a WACC of 6.2% and a terminal growth rate of 4.0%, compared to the long-term average US GDP growth of 3.2%.
Rule of 40
The Rule of 40 is a benchmark that measures the balance between growth and profitability for Software-as-a-Service companies. It takes into account revenue growth and EBITDA margin, the sum of which needs to exceed 40% to fulfil the rule.
The sum of MSFT’s three-year average revenue growth of 15% and EBITDA margin of 48% equals 63%, which fulfils the Rule of 40 criteria.
Important Information
This report is prepared and/or distributed by Phillip Securities Research Pte Ltd ("Phillip Securities Research"), which is a holder of a financial adviser’s licence under the Financial Advisers Act, Chapter 110 in Singapore.
By receiving or reading this report, you agree to be bound by the terms and limitations set out below. Any failure to comply with these terms and limitations may constitute a violation of law. This report has been provided to you for personal use only and shall not be reproduced, distributed or published by you in whole or in part, for any purpose. If you have received this report by mistake, please delete or destroy it, and notify the sender immediately.
The information and any analysis, forecasts, projections, expectations and opinions (collectively, the “Research”) contained in this report has been obtained from public sources which Phillip Securities Research believes to be reliable. However, Phillip Securities Research does not make any representation or warranty, express or implied that such information or Research is accurate, complete or appropriate or should be relied upon as such. Any such information or Research contained in this report is subject to change, and Phillip Securities Research shall not have any responsibility to maintain or update the information or Research made available or to supply any corrections, updates or releases in connection therewith.
Any opinions, forecasts, assumptions, estimates, valuations and prices contained in this report are as of the date indicated and are subject to change at any time without prior notice. Past performance of any product referred to in this report is not indicative of future results.
This report does not constitute, and should not be used as a substitute for, tax, legal or investment advice. This report should not be relied upon exclusively or as authoritative, without further being subject to the recipient’s own independent verification and exercise of judgment. The fact that this report has been made available constitutes neither a recommendation to enter into a particular transaction, nor a representation that any product described in this report is suitable or appropriate for the recipient. Recipients should be aware that many of the products, which may be described in this report involve significant risks and may not be suitable for all investors, and that any decision to enter into transactions involving such products should not be made, unless all such risks are understood and an independent determination has been made that such transactions would be appropriate. Any discussion of the risks contained herein with respect to any product should not be considered to be a disclosure of all risks or a complete discussion of such risks.
Nothing in this report shall be construed to be an offer or solicitation for the purchase or sale of any product. Any decision to purchase any product mentioned in this report should take into account existing public information, including any registered prospectus in respect of such product.
Phillip Securities Research, or persons associated with or connected to Phillip Securities Research, including but not limited to its officers, directors, employees or persons involved in the issuance of this report, may provide an array of financial services to a large number of corporations in Singapore and worldwide, including but not limited to commercial / investment banking activities (including sponsorship, financial advisory or underwriting activities), brokerage or securities trading activities. Phillip Securities Research, or persons associated with or connected to Phillip Securities Research, including but not limited to its officers, directors, employees or persons involved in the issuance of this report, may have participated in or invested in transactions with the issuer(s) of the securities mentioned in this report, and may have performed services for or solicited business from such issuers. Additionally, Phillip Securities Research, or persons associated with or connected to Phillip Securities Research, including but not limited to its officers, directors, employees or persons involved in the issuance of this report, may have provided advice or investment services to such companies and investments or related investments, as may be mentioned in this report.
Phillip Securities Research or persons associated with or connected to Phillip Securities Research, including but not limited to its officers, directors, employees or persons involved in the issuance of this report may, from time to time maintain a long or short position in securities referred to herein, or in related futures or options, purchase or sell, make a market in, or engage in any other transaction involving such securities, and earn brokerage or other compensation in respect of the foregoing. Investments will be denominated in various currencies including US dollars and Euro and thus will be subject to any fluctuation in exchange rates between US dollars and Euro or foreign currencies and the currency of your own jurisdiction. Such fluctuations may have an adverse effect on the value, price or income return of the investment.
To the extent permitted by law, Phillip Securities Research, or persons associated with or connected to Phillip Securities Research, including but not limited to its officers, directors, employees or persons involved in the issuance of this report, may at any time engage in any of the above activities as set out above or otherwise hold an interest, whether material or not, in respect of companies and investments or related investments, which may be mentioned in this report. Accordingly, information may be available to Phillip Securities Research, or persons associated with or connected to Phillip Securities Research, including but not limited to its officers, directors, employees or persons involved in the issuance of this report, which is not reflected in this report, and Phillip Securities Research, or persons associated with or connected to Phillip Securities Research, including but not limited to its officers, directors, employees or persons involved in the issuance of this report, may, to the extent permitted by law, have acted upon or used the information prior to or immediately following its publication. Phillip Securities Research, or persons associated with or connected to Phillip Securities Research, including but not limited its officers, directors, employees or persons involved in the issuance of this report, may have issued other material that is inconsistent with, or reach different conclusions from, the contents of this report.
The information, tools and material presented herein are not directed, intended for distribution to or use by, any person or entity in any jurisdiction or country where such distribution, publication, availability or use would be contrary to the applicable law or regulation or which would subject Phillip Securities Research to any registration or licensing or other requirement, or penalty for contravention of such requirements within such jurisdiction.
This report is intended for general circulation only and does not take into account the specific investment objectives, financial situation or particular needs of any particular person. The products mentioned in this report may not be suitable for all investors and a person receiving or reading this report should seek advice from a professional and financial adviser regarding the legal, business, financial, tax and other aspects including the suitability of such products, taking into account the specific investment objectives, financial situation or particular needs of that person, before making a commitment to invest in any of such products.
This report is not intended for distribution, publication to or use by any person in any jurisdiction outside of Singapore or any other jurisdiction as Phillip Securities Research may determine in its absolute discretion.
IMPORTANT DISCLOSURES FOR INCLUDED RESEARCH ANALYSES OR REPORTS OF FOREIGN RESEARCH HOUSE
Where the report contains research analyses or reports from a foreign research house, please note:
- recipients of the analyses or reports are to contact Phillip Securities Research (and not the relevant foreign research house) in Singapore at 250 North Bridge Road, #06-00 Raffles City Tower, Singapore 179101, telephone number +65 6533 6001, in respect of any matters arising from, or in connection with, the analyses or reports; and
- to the extent that the analyses or reports are delivered to and intended to be received by any person in Singapore who is not an accredited investor, expert investor or institutional investor, Phillip Securities Research accepts legal responsibility for the contents of the analyses or reports.


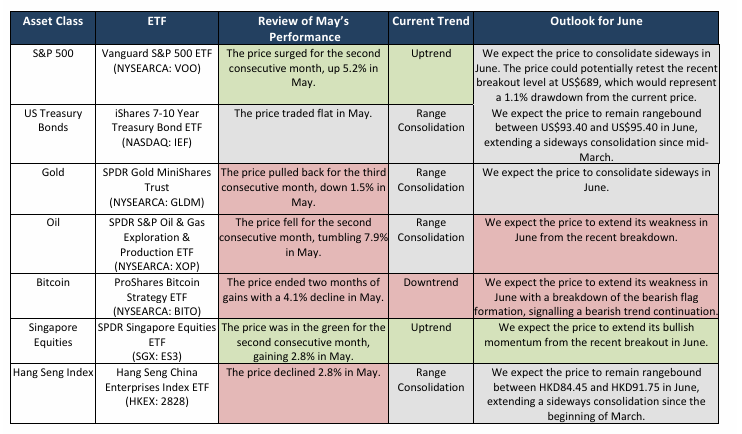 ETF Monthly: May 2026 - Singapore equities to outperform in June
 Yoma Strategic Holdings Ltd - Recovery broadening for this conglomerate
 Valuetronics Holdings Ltd- Returning more capital, but earnings sluggish