
Tesla - Stock Analyst Research
| Target Price* | 220.00 |
| Recommendation | SELL› SELL |
| Market Cap* | - |
| Publication Date | 27 Jul 2026 |
*At the time of publication
Tesla Inc. – Record deliveries but margins collapse
-
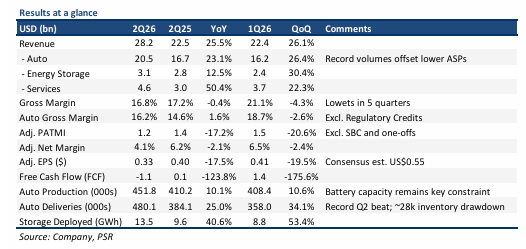
2Q26 results met our expectations with 1H26 revenue/adj. PATMI at 52%/51% of our FY26e forecasts. Adj. PATMI (excl. stock-based compensation, “SBC”) fell 17% YoY to US$1.2bn as a 47% YoY jump in OPEX, lower regulatory credits and a US$240mn energy warranty charge offset record deliveries and 26% YoY revenue growth.
-
480k deliveries (+25% YoY) marked a record 2Q, and deliveries exceeded production by 28k units, cutting inventory to 15 days of supply (1Q26: 27 days). Energy storage deployments of 13.5 GWh (+41% YoY) were the second highest ever. Active supervised FSD subscribers grew 56% YoY to 1.48mn. FCF turned negative at US$1.1bn as Capex more than doubled to US$5.8bn.
-
We maintain our SELL recommendation and an unchanged DCF target price of US$220 as our estimates remain unchanged. Our WACC/growth rate assumptions of 9%/5% remain unchanged. We remain cautious on TSLA: margins are compressing as Opex climbs and regulatory credits fade, while capex of >US$25bn in FY26e (2Q26: US$5.8bn) keeps FCF negative and adds up to US$30bn of new debt facilities. Meaningful revenue from FSD, Robotaxi and Optimus is still >5 years away, and at 216x PE FY26e the stock already prices in much of this upside optionality.
The Positives
+ Demand inflects: record deliveries and backlog. Deliveries rose 25% YoY to 480k, a record
2Q, with growth across the Americas, APAC, and EMEA, and record deliveries in several
markets including Japan, South Korea, and Australia. TSLA exited the quarter with its largest
order backlog since 2023, and revenue crossed US$100bn on a trailing 12-month basis for the
first time. Services and Other revenue grew 50% YoY to US$4.6bn with record gross profit of
US$648mn at a 14.1% margin, an all-time high. Management flagged production, not
demand, as the near-term constraint, with battery packs and electronic components the key
bottlenecks.
+ FSD monetisation is scaling. Active supervised FSD subscribers reached 1.48mn at end 2Q26
(+56% YoY), with record net new subscriptions. In North America, 55% of deliveries had an
FSD subscription enabled at delivery, a record attach rate, and management noted FSD is now
a primary purchase driver. Approvals were added in Lithuania, Estonia, Denmark and Belgium
following the Netherlands, supporting European monetisation. Robotaxi is now live in seven
US metros after unsupervised launches in Miami, Orlando and Tampa in July, and Cybercab
began production at Gigafactory Texas.
About the author

Glenn Thum
Research Analyst
PSR
Glenn covers the Banking and Finance sector. He has had 3 years of experience as a Credit Analyst in a Bank, where he prepared credit proposals by conducting consistent critical analysis on the business, market, country and financial information. Glenn graduated with a Bachelor of Business Management from the University of Queensland with a double major in International Business and Human Resources.
Important Information
This report is prepared and/or distributed by Phillip Securities Research Pte Ltd ("Phillip Securities Research"), which is a holder of a financial adviser’s licence under the Financial Advisers Act, Chapter 110 in Singapore.
By receiving or reading this report, you agree to be bound by the terms and limitations set out below. Any failure to comply with these terms and limitations may constitute a violation of law. This report has been provided to you for personal use only and shall not be reproduced, distributed or published by you in whole or in part, for any purpose. If you have received this report by mistake, please delete or destroy it, and notify the sender immediately.
The information and any analysis, forecasts, projections, expectations and opinions (collectively, the “Research”) contained in this report has been obtained from public sources which Phillip Securities Research believes to be reliable. However, Phillip Securities Research does not make any representation or warranty, express or implied that such information or Research is accurate, complete or appropriate or should be relied upon as such. Any such information or Research contained in this report is subject to change, and Phillip Securities Research shall not have any responsibility to maintain or update the information or Research made available or to supply any corrections, updates or releases in connection therewith.
Any opinions, forecasts, assumptions, estimates, valuations and prices contained in this report are as of the date indicated and are subject to change at any time without prior notice. Past performance of any product referred to in this report is not indicative of future results.
This report does not constitute, and should not be used as a substitute for, tax, legal or investment advice. This report should not be relied upon exclusively or as authoritative, without further being subject to the recipient’s own independent verification and exercise of judgment. The fact that this report has been made available constitutes neither a recommendation to enter into a particular transaction, nor a representation that any product described in this report is suitable or appropriate for the recipient. Recipients should be aware that many of the products, which may be described in this report involve significant risks and may not be suitable for all investors, and that any decision to enter into transactions involving such products should not be made, unless all such risks are understood and an independent determination has been made that such transactions would be appropriate. Any discussion of the risks contained herein with respect to any product should not be considered to be a disclosure of all risks or a complete discussion of such risks.
Nothing in this report shall be construed to be an offer or solicitation for the purchase or sale of any product. Any decision to purchase any product mentioned in this report should take into account existing public information, including any registered prospectus in respect of such product.
Phillip Securities Research, or persons associated with or connected to Phillip Securities Research, including but not limited to its officers, directors, employees or persons involved in the issuance of this report, may provide an array of financial services to a large number of corporations in Singapore and worldwide, including but not limited to commercial / investment banking activities (including sponsorship, financial advisory or underwriting activities), brokerage or securities trading activities. Phillip Securities Research, or persons associated with or connected to Phillip Securities Research, including but not limited to its officers, directors, employees or persons involved in the issuance of this report, may have participated in or invested in transactions with the issuer(s) of the securities mentioned in this report, and may have performed services for or solicited business from such issuers. Additionally, Phillip Securities Research, or persons associated with or connected to Phillip Securities Research, including but not limited to its officers, directors, employees or persons involved in the issuance of this report, may have provided advice or investment services to such companies and investments or related investments, as may be mentioned in this report.
Phillip Securities Research or persons associated with or connected to Phillip Securities Research, including but not limited to its officers, directors, employees or persons involved in the issuance of this report may, from time to time maintain a long or short position in securities referred to herein, or in related futures or options, purchase or sell, make a market in, or engage in any other transaction involving such securities, and earn brokerage or other compensation in respect of the foregoing. Investments will be denominated in various currencies including US dollars and Euro and thus will be subject to any fluctuation in exchange rates between US dollars and Euro or foreign currencies and the currency of your own jurisdiction. Such fluctuations may have an adverse effect on the value, price or income return of the investment.
To the extent permitted by law, Phillip Securities Research, or persons associated with or connected to Phillip Securities Research, including but not limited to its officers, directors, employees or persons involved in the issuance of this report, may at any time engage in any of the above activities as set out above or otherwise hold an interest, whether material or not, in respect of companies and investments or related investments, which may be mentioned in this report. Accordingly, information may be available to Phillip Securities Research, or persons associated with or connected to Phillip Securities Research, including but not limited to its officers, directors, employees or persons involved in the issuance of this report, which is not reflected in this report, and Phillip Securities Research, or persons associated with or connected to Phillip Securities Research, including but not limited to its officers, directors, employees or persons involved in the issuance of this report, may, to the extent permitted by law, have acted upon or used the information prior to or immediately following its publication. Phillip Securities Research, or persons associated with or connected to Phillip Securities Research, including but not limited its officers, directors, employees or persons involved in the issuance of this report, may have issued other material that is inconsistent with, or reach different conclusions from, the contents of this report.
The information, tools and material presented herein are not directed, intended for distribution to or use by, any person or entity in any jurisdiction or country where such distribution, publication, availability or use would be contrary to the applicable law or regulation or which would subject Phillip Securities Research to any registration or licensing or other requirement, or penalty for contravention of such requirements within such jurisdiction.
This report is intended for general circulation only and does not take into account the specific investment objectives, financial situation or particular needs of any particular person. The products mentioned in this report may not be suitable for all investors and a person receiving or reading this report should seek advice from a professional and financial adviser regarding the legal, business, financial, tax and other aspects including the suitability of such products, taking into account the specific investment objectives, financial situation or particular needs of that person, before making a commitment to invest in any of such products.
This report is not intended for distribution, publication to or use by any person in any jurisdiction outside of Singapore or any other jurisdiction as Phillip Securities Research may determine in its absolute discretion.
IMPORTANT DISCLOSURES FOR INCLUDED RESEARCH ANALYSES OR REPORTS OF FOREIGN RESEARCH HOUSE
Where the report contains research analyses or reports from a foreign research house, please note:
- recipients of the analyses or reports are to contact Phillip Securities Research (and not the relevant foreign research house) in Singapore at 250 North Bridge Road, #06-00 Raffles City Tower, Singapore 179101, telephone number +65 6533 6001, in respect of any matters arising from, or in connection with, the analyses or reports; and
- to the extent that the analyses or reports are delivered to and intended to be received by any person in Singapore who is not an accredited investor, expert investor or institutional investor, Phillip Securities Research accepts legal responsibility for the contents of the analyses or reports.


About the author
Glenn Thum
Research Analyst
PSR
Glenn covers the Banking and Finance sector. He has had 3 years of experience as a Credit Analyst in a Bank, where he prepared credit proposals by conducting consistent critical analysis on the business, market, country and financial information. Glenn graduated with a Bachelor of Business Management from the University of Queensland with a double major in International Business and Human Resources.
 SIA Engineering Co. Ltd - Temporarily grounded for overhaul
 Suntec REIT – Singapore assets continue to drive performance
 Keppel DC REIT – Acquisitions and higher rents drive 11% DPU growth