How to Use ChartView to Invest March 15, 2021
At a glance:
- Charting tools are commonly used to identify patterns and trend directions of counters.
- They assist traders and investors in locating the best entry and exit points into a stock or market.
- ChartView is POEMS Pro’s unique charting tool that provides high-performance, intuitive and fully-customisable charting solutions. The tool is packed with more than 40 trading indicators.
- With ChartView, users can study market trends using different time frames, of as short as a minute to a quarter.
Reading time: 20 minutes
Technical analysis is an integral part of trading. It helps traders make more informed investment decisions. With the help of charting tools, identifying patterns and trend directions becomes so much easier for traders and investors looking to locate the best entry and exit points into a market or stock.
A good charting tool can help you monitor markets with ease, make better trades and maximise your performance. In this guide, you will learn how to use ChartView to navigate markets and identify trading opportunities.
What is ChartView?
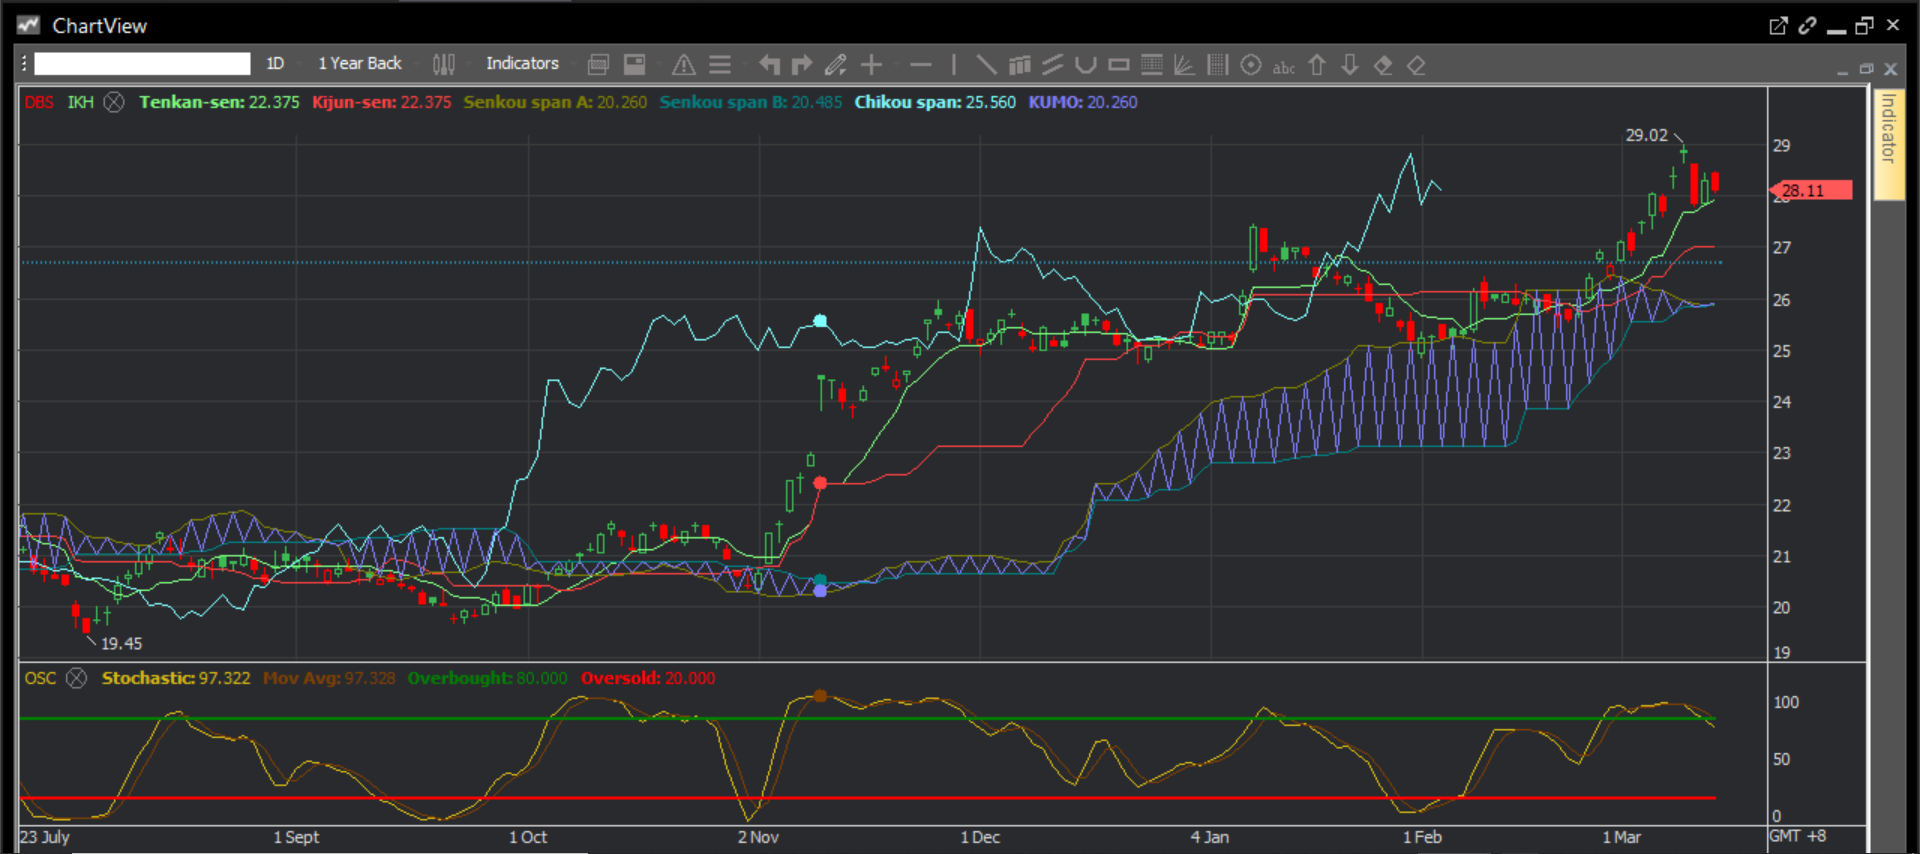
ChartView is POEMS Pro’s unique charting tool that provides high-performance, intuitive and fully-customisable charting solutions. Equipped with capabilities to enhance your trading experience, the tool is powered with an in-built smart memory for technical drawings, candlestick pattern recognition and colour scheme customisation.
In our previous article, we took you through Chart-Live, which can help you in your market and stock analysis. As both Chart-Live and ChartView are charting tools, you may ask, how are they different?
Their difference lies in technical breadth. ChartView is packed with more than 40 indicators, including the Ichimoku Cloud, Bollinger Bands and RSI. Traders can leverage its sheer diversity of offerings to analyse price and volume movements in greater detail and identify trends for trading decisions. On top of that, ChartView provides extensive drawing tools and more advanced features such as Candlestick Pattern Recognition.
How to use ChartView to invest
ChartView allows you to:
1. Study market trends using different time frames
Applying the right time frame is crucial to the accuracy of your price analysis. ChartView’s time frames cover periods as short as a minute to a day, a week, a month and a quarter. The intuitive charting tool also provides an extensive price history spanning up to 20 years. This is broad enough for price analysis over the long term, as well as short term.
Traders typically use different time frames to validate trends and derive a broader and more detailed reading of the market.

Time frames are chosen based on an individual’s trading strategy. For example:
- A swing trader who trades using daily charts can complement his/her analysis with weekly and 60-minute charts to define primary and short-term trends respectively
- A day trader who trades using 15-minute charts can complement his/her analysis with 60-minute and 5-minute charts to define primary and short-term trends respectively
- A long-term trader who trades using weekly charts can complement his/her analysis with monthly and daily charts to define primary and short-term trends respectively
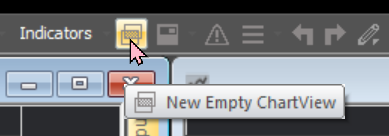
 Tip: ChartView allows you to add up to six charts in a single module so that you can monitor multiple counters at a glance. To compare multiple charts, simply click on the ‘New Empty ChartView’ button.
2. Determine trends with indicators
With over 40 indicators, ChartView ensures that you have everything you need as an advanced trader. In our Chart-Live article, we discussed how you can harness Trading Volume, RSI, Bollinger Bands® and Simple Moving Average to spot trends. In this article, we will touch on two of the most commonly-used trading indicators: Ichimoku Kinko Hyo and Stochastic Oscillator.
i. Ichimoku Kinko Hyo
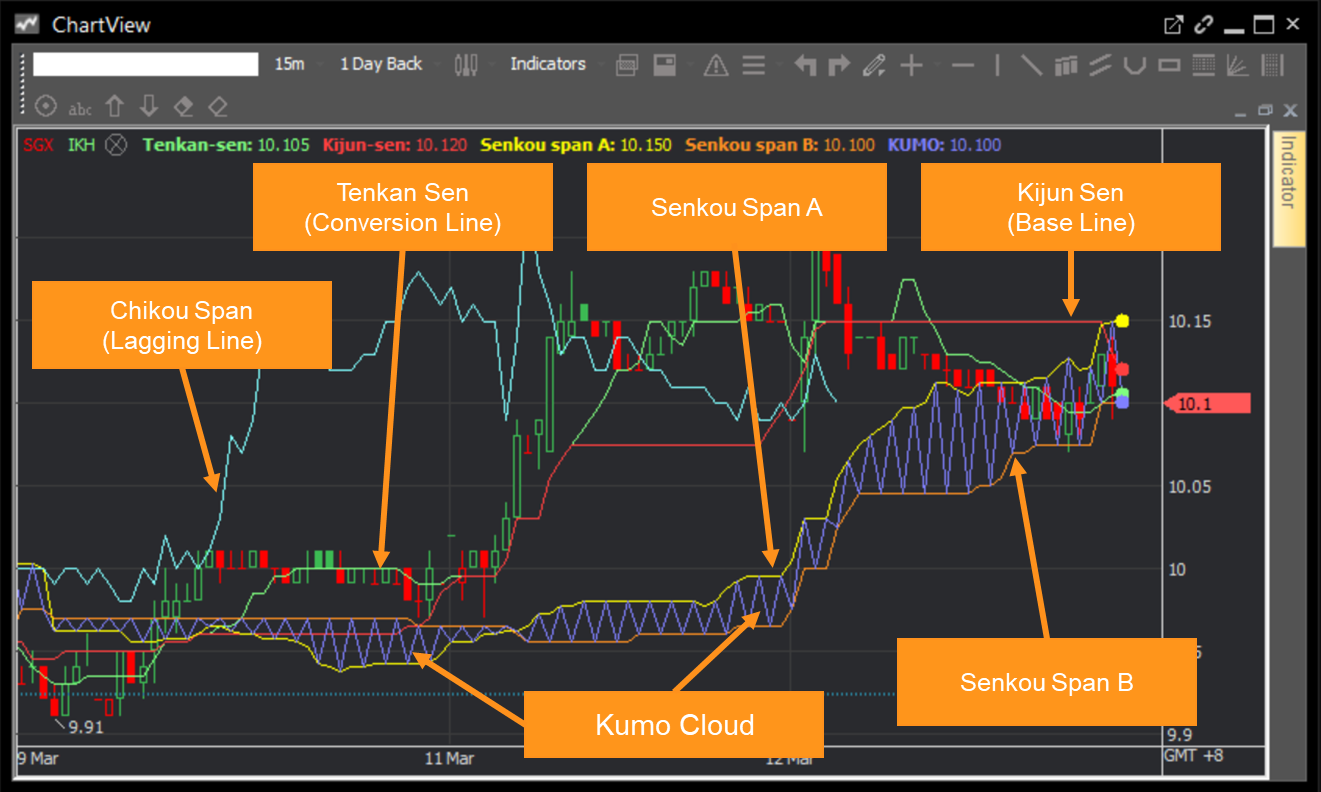
Invented in the late 1960s by Goichi Hosoda, Ichimoku Kinko Hyo – also known as the Ichimoku Cloud – is a trend-following system that predicts price movements using moving averages. This indicator provides many types of information such as trend directions, momentum, potential trend reversals and the location of entry points.
There are five lines to the Ichimoku Cloud:
- Tenkan Sen, also known as the Conversion Line (green colour), measures short-term trends by taking the average of the highest high and lowest low prices in the previous nine periods
- Kijun Sen, also known as the Base Line (red colour), measures medium-term trends by taking the average of the highest high and lowest low prices in the previous 26 periods
- Chikou Span, also known as the Lagging Line (light blue colour), is used to confirm signals
- Senkou Span A* (yellow colour)
- Senkou Span B* (orange colour)
*Spans A and B form the Kumo Cloud
You may also use the Ichimoku Cloud to spot buy and sell signals:
| Uptrend or buy signal |
|
Downtrend or sell signal |
|
A note of caution, though. There are limitations to this indicator. As it is based on historical data, it may not be inherently predictive. The indicator can also become irrelevant when a price remains way above or below it for long periods of time.
ii. Stochastic Oscillator
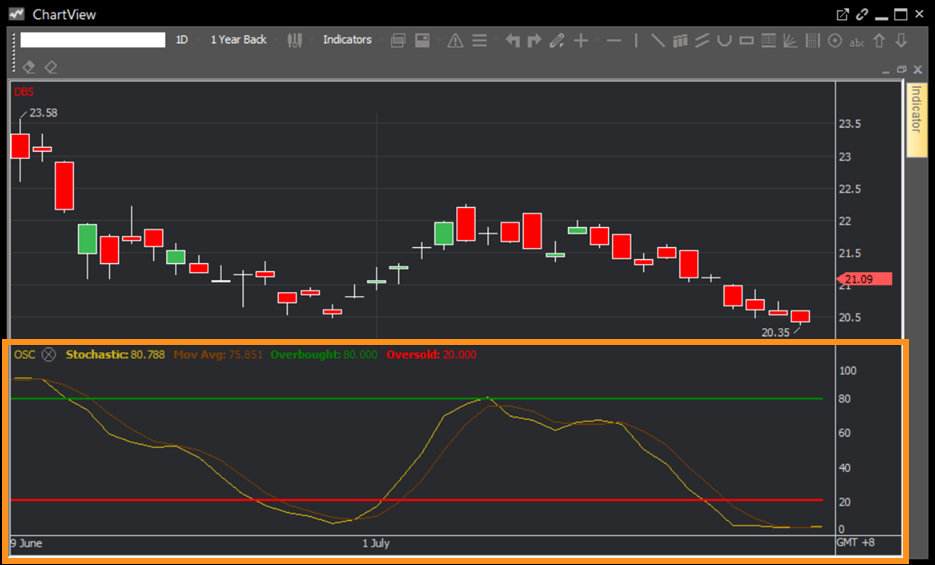
The Stochastic Oscillator is another indicator of price trend. It is displayed as two lines. The indicator compares the closing price of a counter with its price range – highest to lowest – over a period of time.
Often used by traders to tell if the market is overbought or oversold, it is scaled from 0 to 100. An overbought market is suggested when the Stochastic lines rise above 80. When the lines move below 20, the market could be oversold.

While this indicator can provide insights into market trends, it may also produce false signals when used incorrectly, particularly during volatile trading conditions. To confirm trading signals found from this indicator, you have to read it in conjunction with other technical indicators.
3. Interpret charts and price trends with drawing tools
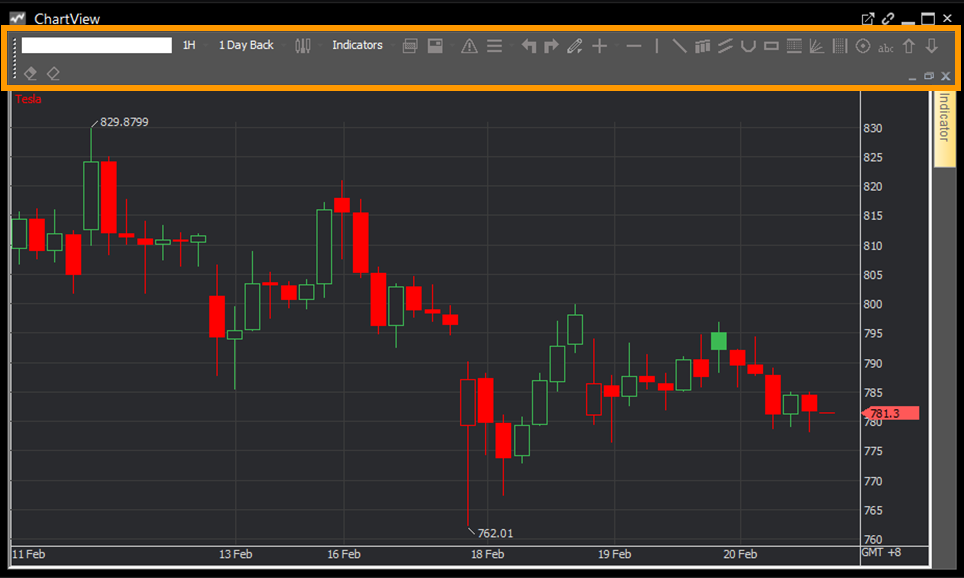
ChartView comes with many drawing tools to assist your data analysis. The tools can be used to help you find support and resistance levels, make notes on charts and highlight price movements. Support and resistance levels provide traders with additional insights on the direction and strength of a price trend.

How to use drawing tools:
|
|
To know what the drawing tools are, simply hover over the icon |
|
|
To use a tool, click on the icon and select where you would like to place the item on the chart |
|
|
To undo a drawing, select the erase tool and click on the item to remove. You may also use the ‘delete’ key on your keyboard. |
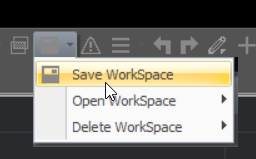
 Tip: You can save your workspace by clicking on the Save button.
4. Generate trading ideas with Candlestick Pattern Recognition (CPR)
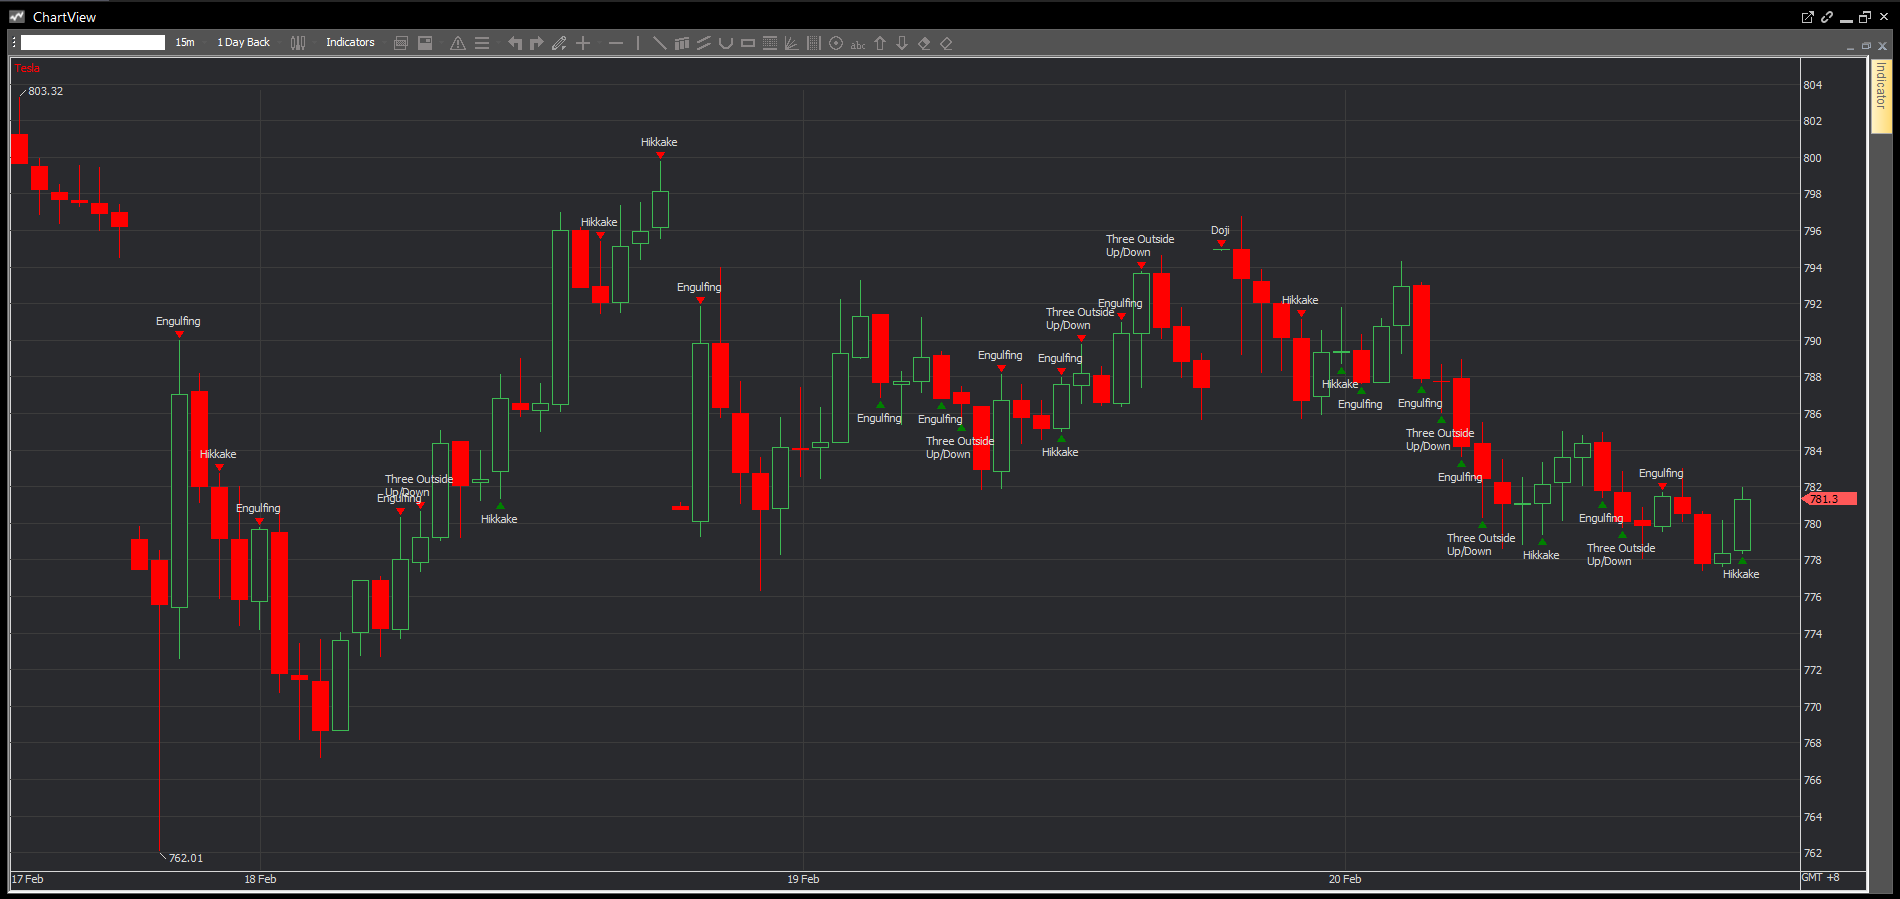
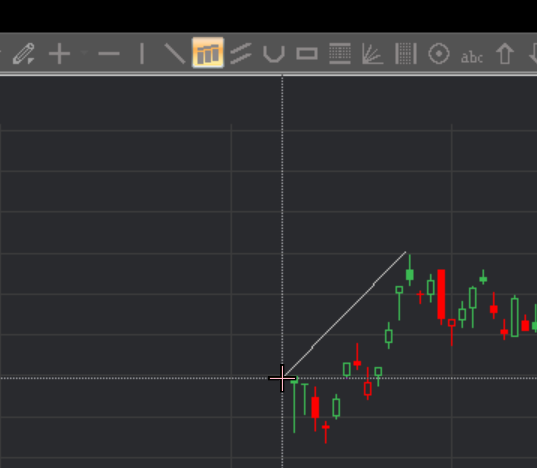
CPR is commonly used to identify potential changes in market direction and are great for generating trading ideas at a glance. Believed to help predict market movements, there are over 40 candlestick patterns that traders can tap. Unique to ChartView, CPR allows traders to identify candlestick patterns in a breeze.
Here are four patterns you should know:
| Pattern | Description | Trend |
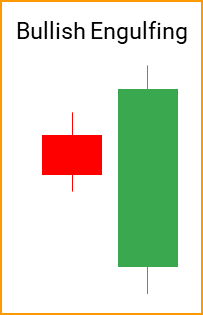
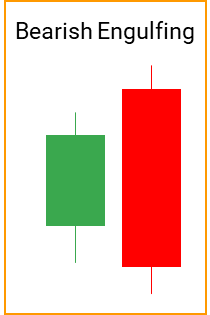
| Engulfing | As its name suggests, Engulfing occurs when the next candlestick is larger than the previous, such that it completely engulfs it. This pattern may indicate a market reversal. There are two types of Engulfing: bearish and bullish.
|
Bearish engulfing can suggest a downtrend while bullish Engulfing can suggest an uptrend |
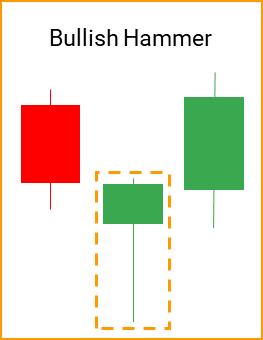
| Hammer | A Hammer pattern comes after a price decline. It signals that a stock is nearing the bottom in a downtrend and there is potential for an uptrend. This pattern can be spotted by a short body and long lower shadow, or a “T” shape.
|
Can suggest an uptrend |
| Doji | A Doji candlestick pattern can be spotted by its extremely small body, with a long upper and/or lower shadow. This pattern is associated with indecision in the market and a potential reversal of the current trend. There are four types of Doji candle:
|
Can suggest a bullish or bearish direction |
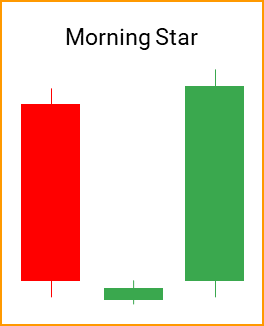
| Morning Star | A Morning Star pattern can be a sign of trend reversal. It forms after a downtrend and can indicate the start of a bullish direction. Morning Stars can be observed when you first see a large bearish candle, as a result of large selling pressure and a downtrend. A small bearish or bullish candle will follow, which can sometimes be a Doji candle. If the next candlestick is a large bullish candle, it can signify large buying pressure. To further validate this pattern, you will need to observe higher highs and higher lows for subsequent candlesticks.
|
Can suggest a bullish direction |
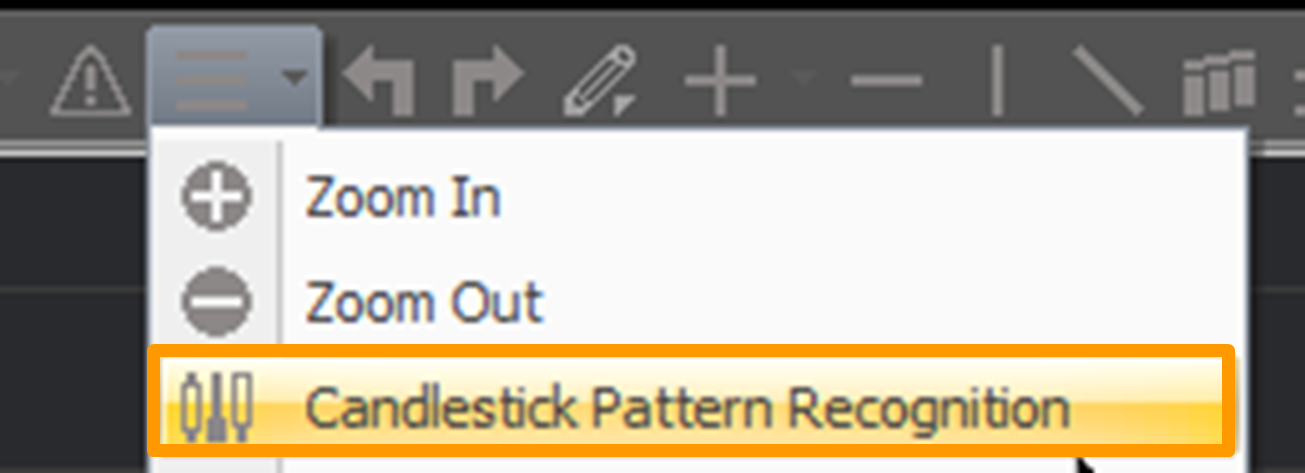
To view CPR, click on the ‘Other Functions’ button and select ‘Candlestick Pattern Recognition’.
Candlestick patterns can be very informative on market trends and the behaviour of traders. However, they should be complemented with the use of other trading indicators. Also, advanced order types should be incorporated to minimise the risk of big losses.
Keep a lookout for our next article where we will discuss the advanced order types that POEMS offer and how you can apply them to your trades!
While the stock market can be highly volatile and unpredictable, finding trading opportunities is not as difficult when you have the right tools. POEMS ChartView is only available on POEMS Pro. Download POEMS Pro here today.

POEMS suite of trading platforms is made to suit the needs of all traders and investors. Open a Cash Plus Account to enjoy commission fee as low as 0.08%, no minimum* when you trade equities. Jumpstart your investing journey with POEMS now! *T&Cs Apply.
You may also interested in…
Disclaimer
These commentaries are intended for general circulation. It does not have regard to the specific investment objectives, financial situation and particular needs of any person who may receive this document. Accordingly, no warranty whatsoever is given and no liability whatsoever is accepted for any loss arising whether directly or indirectly as a result of any person acting based on this information. Opinions expressed in these commentaries are subject to change without notice. Investments are subject to investment risks including the possible loss of the principal amount invested. The value of the units and the income from them may fall as well as rise. Past performance figures as well as any projection or forecast used in these commentaries are not necessarily indicative of future or likely performance. Phillip Securities Pte Ltd (PSPL), its directors, connected persons or employees may from time to time have an interest in the financial instruments mentioned in these commentaries. Investors may wish to seek advice from a financial adviser before investing. In the event that investors choose not to seek advice from a financial adviser, they should consider whether the investment is suitable for them.
The information contained in these commentaries has been obtained from public sources which PSPL has no reason to believe are unreliable and any analysis, forecasts, projections, expectations and opinions (collectively the “Research”) contained in these commentaries are based on such information and are expressions of belief only. PSPL has not verified this information and no representation or warranty, express or implied, is made that such information or Research is accurate, complete or verified or should be relied upon as such. Any such information or Research contained in these commentaries are subject to change, and PSPL shall not have any responsibility to maintain the information or Research made available or to supply any corrections, updates or releases in connection therewith. In no event will PSPL be liable for any special, indirect, incidental or consequential damages which may be incurred from the use of the information or Research made available, even if it has been advised of the possibility of such damages. The companies and their employees mentioned in these commentaries cannot be held liable for any errors, inaccuracies and/or omissions howsoever caused. Any opinion or advice herein is made on a general basis and is subject to change without notice. The information provided in these commentaries may contain optimistic statements regarding future events or future financial performance of countries, markets or companies. You must make your own financial assessment of the relevance, accuracy and adequacy of the information provided in these commentaries.
Views and any strategies described in these commentaries may not be suitable for all investors. Opinions expressed herein may differ from the opinions expressed by other units of PSPL or its connected persons and associates. Any reference to or discussion of investment products or commodities in these commentaries is purely for illustrative purposes only and must not be construed as a recommendation, an offer or solicitation for the subscription, purchase or sale of the investment products or commodities mentioned.




 Back in Business: The Return of IPOs & Top Traded Counters in March 2024
  From $50 to $100: Unveiling the Impact of Inflation
  How to soar higher with Positive Carry!
  Why 2024 Offers A Small Window of Opportunity and How to Position Yourself to Capture It


