How to Use Chart-Live to Invest? February 19, 2021
At a glance:
- Technical analysis plays a crucial role in analysing market prices. It helps investors and traders spot trading opportunities!
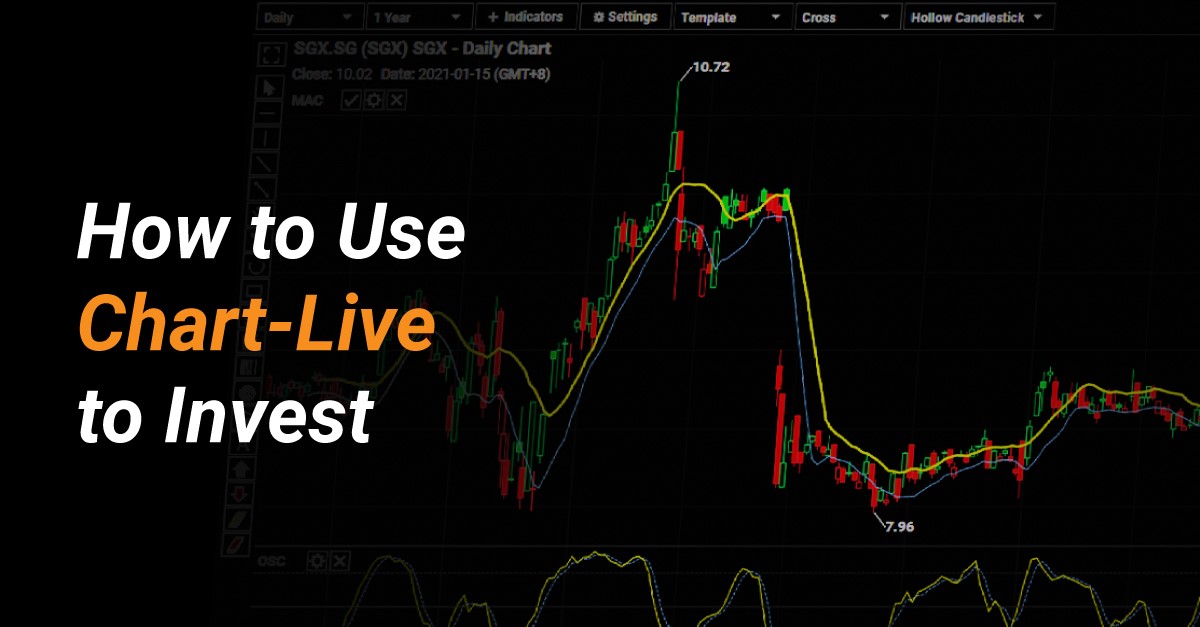
- Chart-Live is a POEMS 2.0 technical analysis tool that provides real-time streaming data, customisable chart settings and myriad technical indicators.
- You can compare data of up to 20 years, for up to five asset classes at one glance.
- Four different chart types are offered, with up to 31 technical indicators: Volume, RSI, Bollinger Bands and Moving Average.
Reading time: 20 minutes
When it comes to stock-picking, investors do not merely rely on fundamental analysis. Technical analysis also plays an important role in their analysis of market prices and patterns in order to find trading opportunities.
Technical analysis involves the use of charting tools to gather insights on market trends. These insights, with the help of historical data, can help investors predict future prices. Technical analysis can be used to analyse any investment, from stocks, ETFs and futures to forex.
Performing technical analysis is much easier with a good stock chart tool. Whether you are an amateur or a seasoned investor or just learning to read stock charts, POEMS has the right charting tool for you.
What is Chart-Live?
Chart-Live is a POEMS 2.0 technical analysis tool that provides real-time streaming data, customisable chart settings and myriad technical indicators. Simple and easy to use, POEMS Chart-Live is suitable for anyone looking to navigate the market and monitor real-time price movements.
How to use Chart-Live to invest?
Chart-Live predicts the probable future price movements of a security based on historical market data. However, before you dive into the tool, you must first know how to read a stock chart.
1. Charting with different time frames
One of the primary variables of technical analysis is time frame. Time frame refers to a specified period of time in which price actions are displayed on a chart. Some popular time frames used by technical investors are the 5-minute chart, 15-minute chart, hourly chart, 4-hour chart and daily chart.
Did you know that POEMS Chart-Live has an extensive price history which covers up to 20 years of data?
This means that you can compare data of up to 20 years for up to five different asset classes, all at one glance.
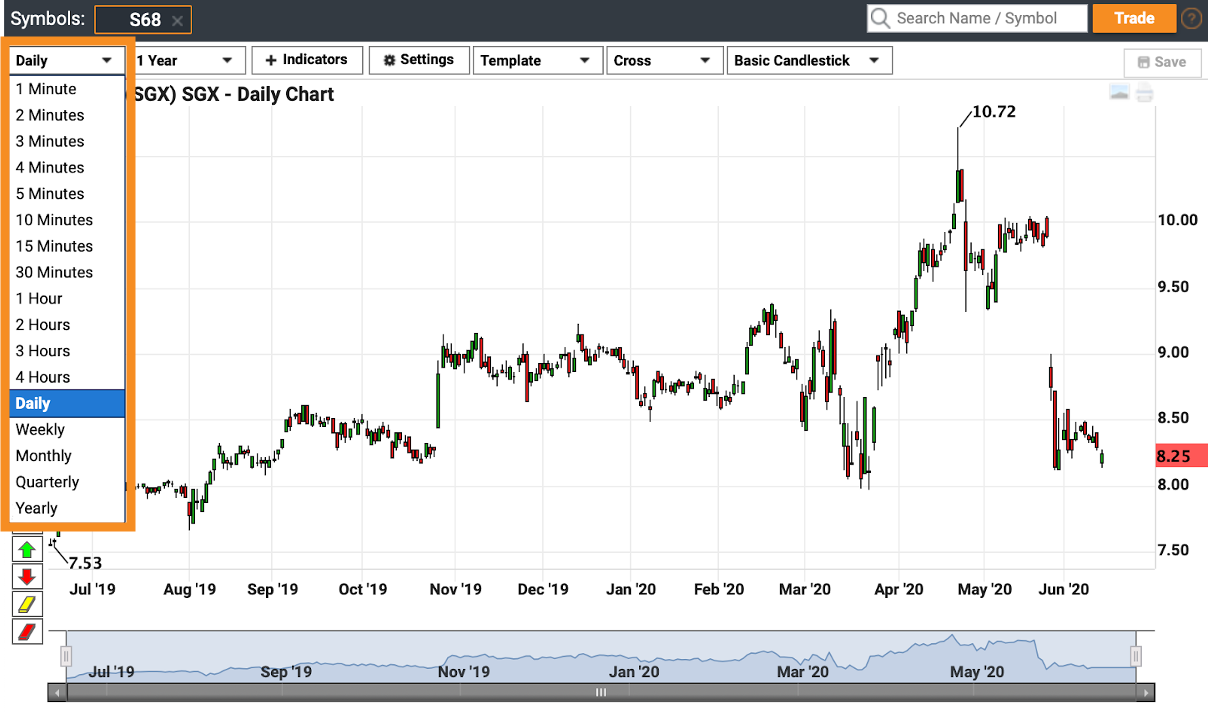
The type of time frame used by traders and investors depends on their individual trading styles. In general, there are three types of traders:
| 1. Short Term | Short-term traders include Scalpers, Day Traders and some Swing Traders. As the name suggests, short-term investors use shorter time frames, including 5-minute or 15-minute charts. |
| 2. Medium Term | Medium-term investors tend to adopt daily or weekly time frames. |
| 3. Long Term | Long-term investors hold their market positions for a long time. Longer time frames such as weekly, monthly or yearly charts are used. |
2. Using different chart types to observe prices
Before we begin to analyse charts, it is good to know the different types of charts available and how they can be used to predict market movements.
Did you know you can choose from four types of charts to review price movements on POEMS Chart-Live?
POEMS Chart-Live offers four different chart types: the bar, line and candlestick charts (basic and hollow).
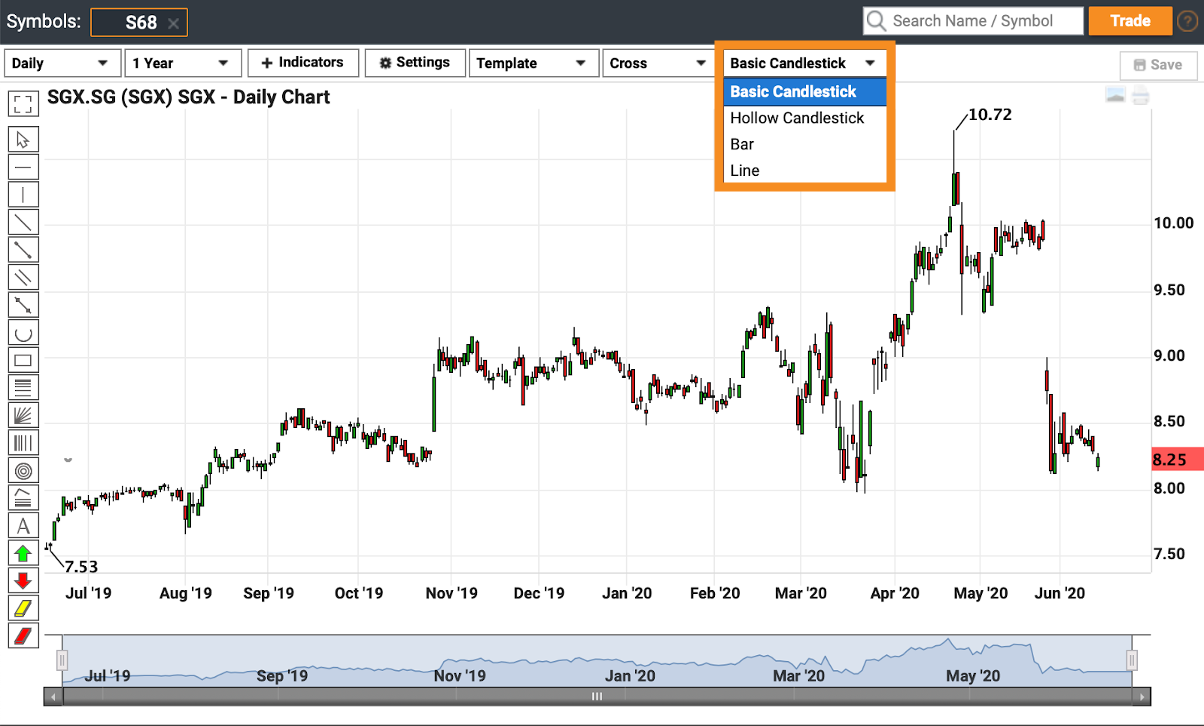
2.1 Line Chart
The Line Chart is the most basic type of chart. It gives an overview of a counter’s price movements over a specified period of time. Providing only closing prices, the line chart is formed by joining one closing price to the next closing price.
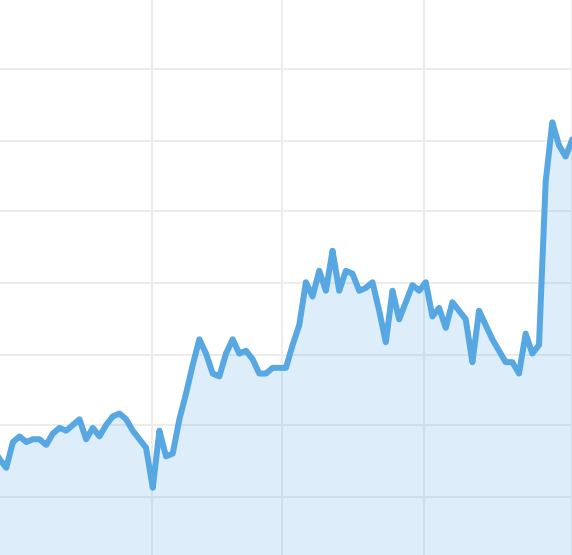
Closing prices are often considered the most important element for analysing data. They are believed to more useful than opening prices, as their highs and lows can help investors and traders determine a stock’s trend strength and predict reversals. The downside is, the Line Chart does not provide any trading range, as there are no opening prices.
Generally, this chart is preferred by beginners for the simplicity of their technical patterns.
2.2 Bar Chart
The Bar Chart is one of the most popular charting types used by investors and traders. Unlike the Line Chart, the Bar Chart displays opening and closing prices, as well as the highs and lows of a counter over a specified period of time.
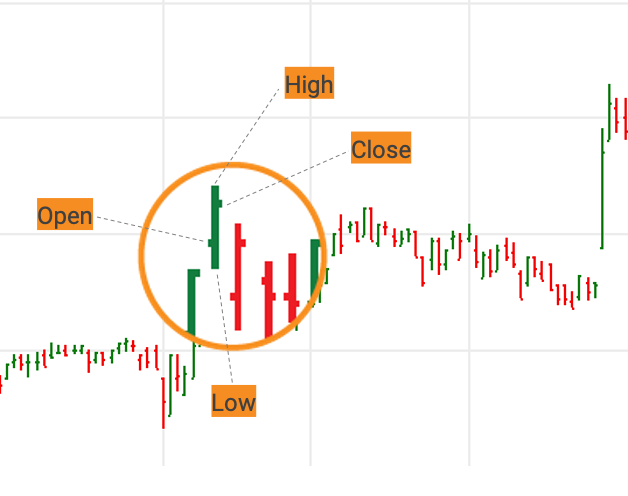
The vertical bar represents the trading range based on the chosen period of time. An example could be a 5-minute chart which shows a new bar forming every five minutes.
The colour green represents a bullish bar while red represents a bearish bar. The top of the bar (high) reflects the highest traded price during the period chosen. The bottom (low) shows the lowest traded price.
Opening and closing prices are represented by horizontal marks to the left and right of the vertical bars, respectively.
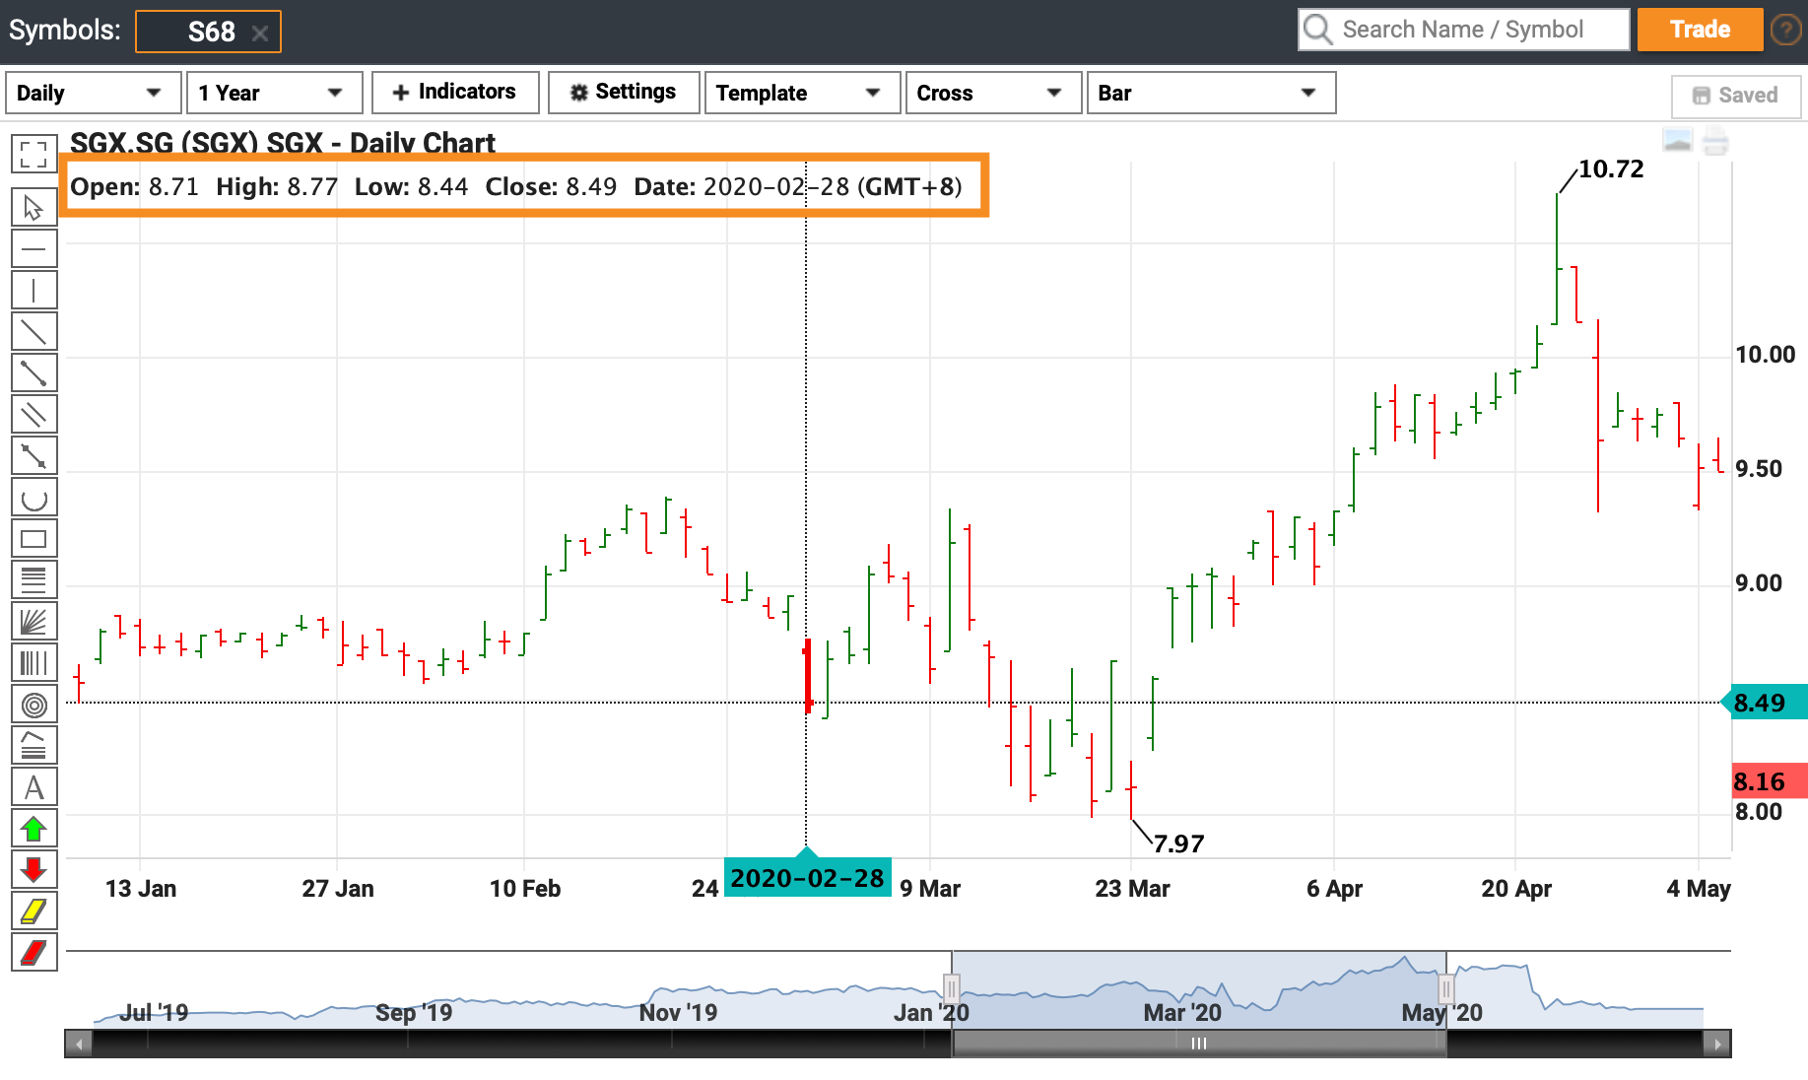
To view opening, closing, high and low prices of a bar, simply hover over the bar. You will see the information at the top left of the chart.
Generally, this chart type is suitable for market participants with intermediate trading experience. As the Bar Chart gives more price data, it helps traders and investors identify when to enter or exit the market.
2.3 Candlestick Chart
Another commonly used chart type is the Candlestick Chart. This chart type is popular for its ability to present information in a simpler and easier to read manner. Although it presents the same information as the Bar Chart, it is visually more accessible.
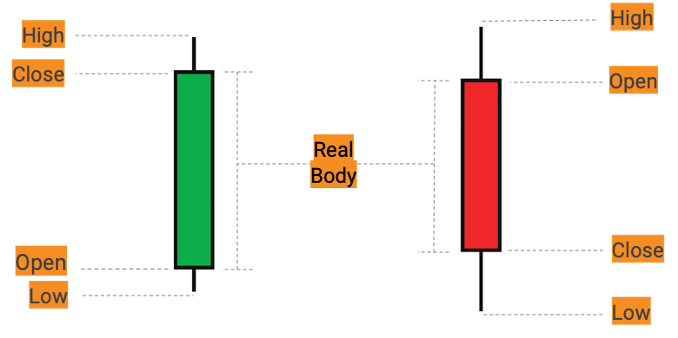
Similar to the Bar Chart, the top of the bar (high) reflects the highest traded price while the bottom (low) shows the lowest traded price during the chosen period of time. However, things start to differ when it comes to opening and closing prices.
For a green candlestick, the closing price is at the top of the real body while the opening price is at the bottom.
For a red candlestick, the closing price is at the bottom of the body while the opening price is at the top. The longer the real body, the bigger the change in price. A shorter body signals little price movement.
Generally, the Candlestick Chart is more suitable for advanced investors and traders. For this chart type, POEMS Chart-Live offers basic and hollow Candlestick Charts.
3. Identifying trends using technical indicators
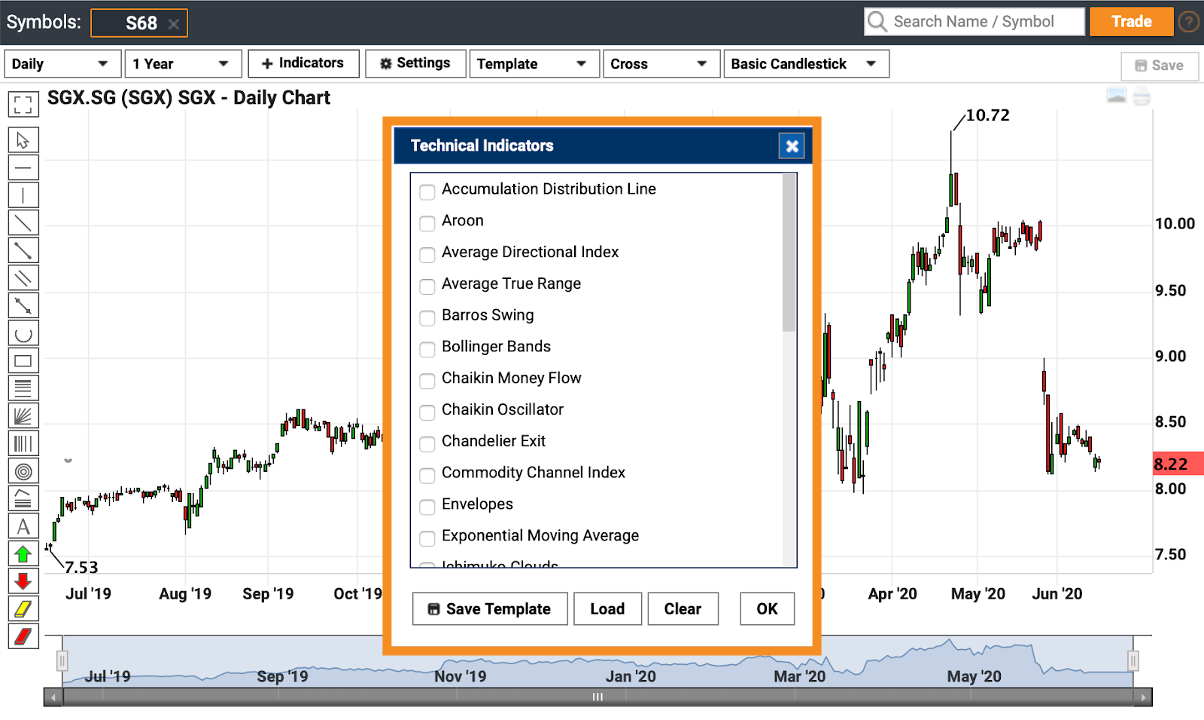
Another important component of technical analysis is the trading indicator. There are many indicators that investors can choose from to aid their analysis. Different indicators use different mathematical calculations. But they all serve the same purpose: to help investors and traders identify certain signals and trends in the market.
Did you know POEMS provides more than 30 technical indicators for you to analyse counters?
POEMS Chart-Live offers up to 31 technical indicators, including Volume, RSI, Bollinger Bands and Moving Average.
3.1 Trading Volume
The Volume indicator is one of the most critical indicators for investors and traders. Meant to measure how much a counter is traded within a period of time, volume patterns provide investors with a good idea of how the market is doing.
Trading Volume can typically be found at the bottom of stock charts. A green volume bar indicates that the stock price closed higher than the previous day. A red volume bar indicates that the stock price closed lower than the previous day.
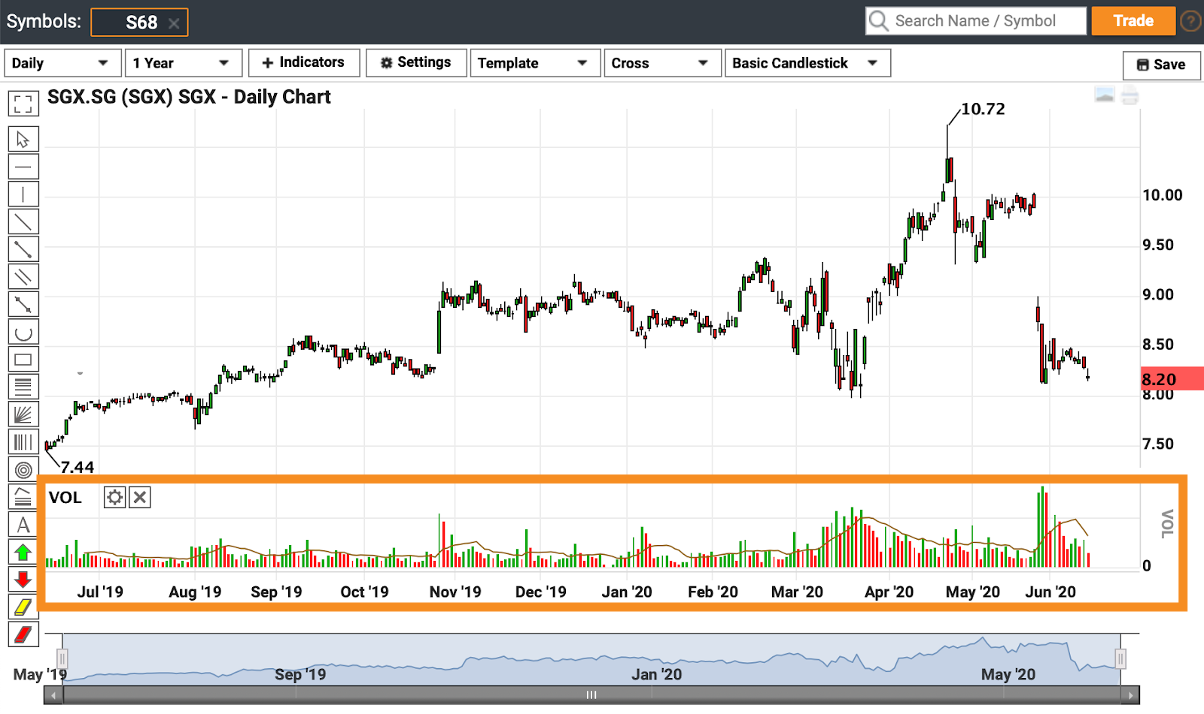
There are four volume patterns that investors and traders look out for.
| Volume | Price | Interpretation |
| Increasing | Increasing | This is a bullish indication that a stock’s price will continue to rise. |
| Decreasing | Decreasing | This is a bullish indication that a temporary retracement or correction is occurring. The stock price may have fallen back a bit, but this may be because not many investors are involved in the trading. |
| Increasing | Decreasing | This is a bearish indication that many investors and traders are aggressively selling the stock. |
| Decreasing | Increasing | This is a bearish indication that many investors and traders are aggressively selling the stock. |
3.2 Relative Strength Index (RSI)
Developed in 1978, the RSI indicator is a popular momentum oscillator that provides traders and investors with signals on bullish and bearish trends. It measures the speed and change of price movements, which can indicate whether a stock is overbought or oversold.
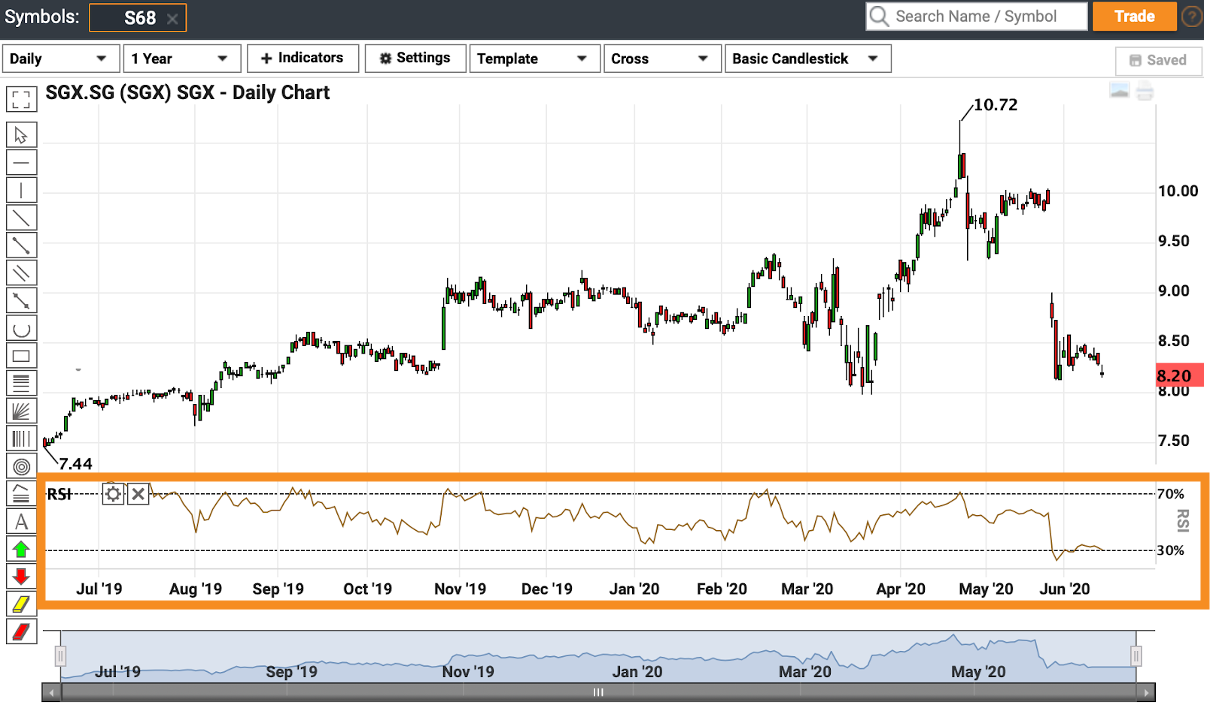
Also found at the bottom of stock charts, the RSI plots the strength or weakness of a counter based on its closing price. The RSI oscillates from a range of 0 to 100. If a counter is overbought, its RSI is typically above 70%. When oversold, its RSI will fall below 30%.
For example, the counter in the above chart was overbought twice and oversold once from October 2019 to June 2020.
3.3 Bollinger Bands®
Devised by John Bollinger in the 1980s, the Bollinger Bands® are another widely used indicator. They offer unique insights into price and volatility across multiple asset classes.
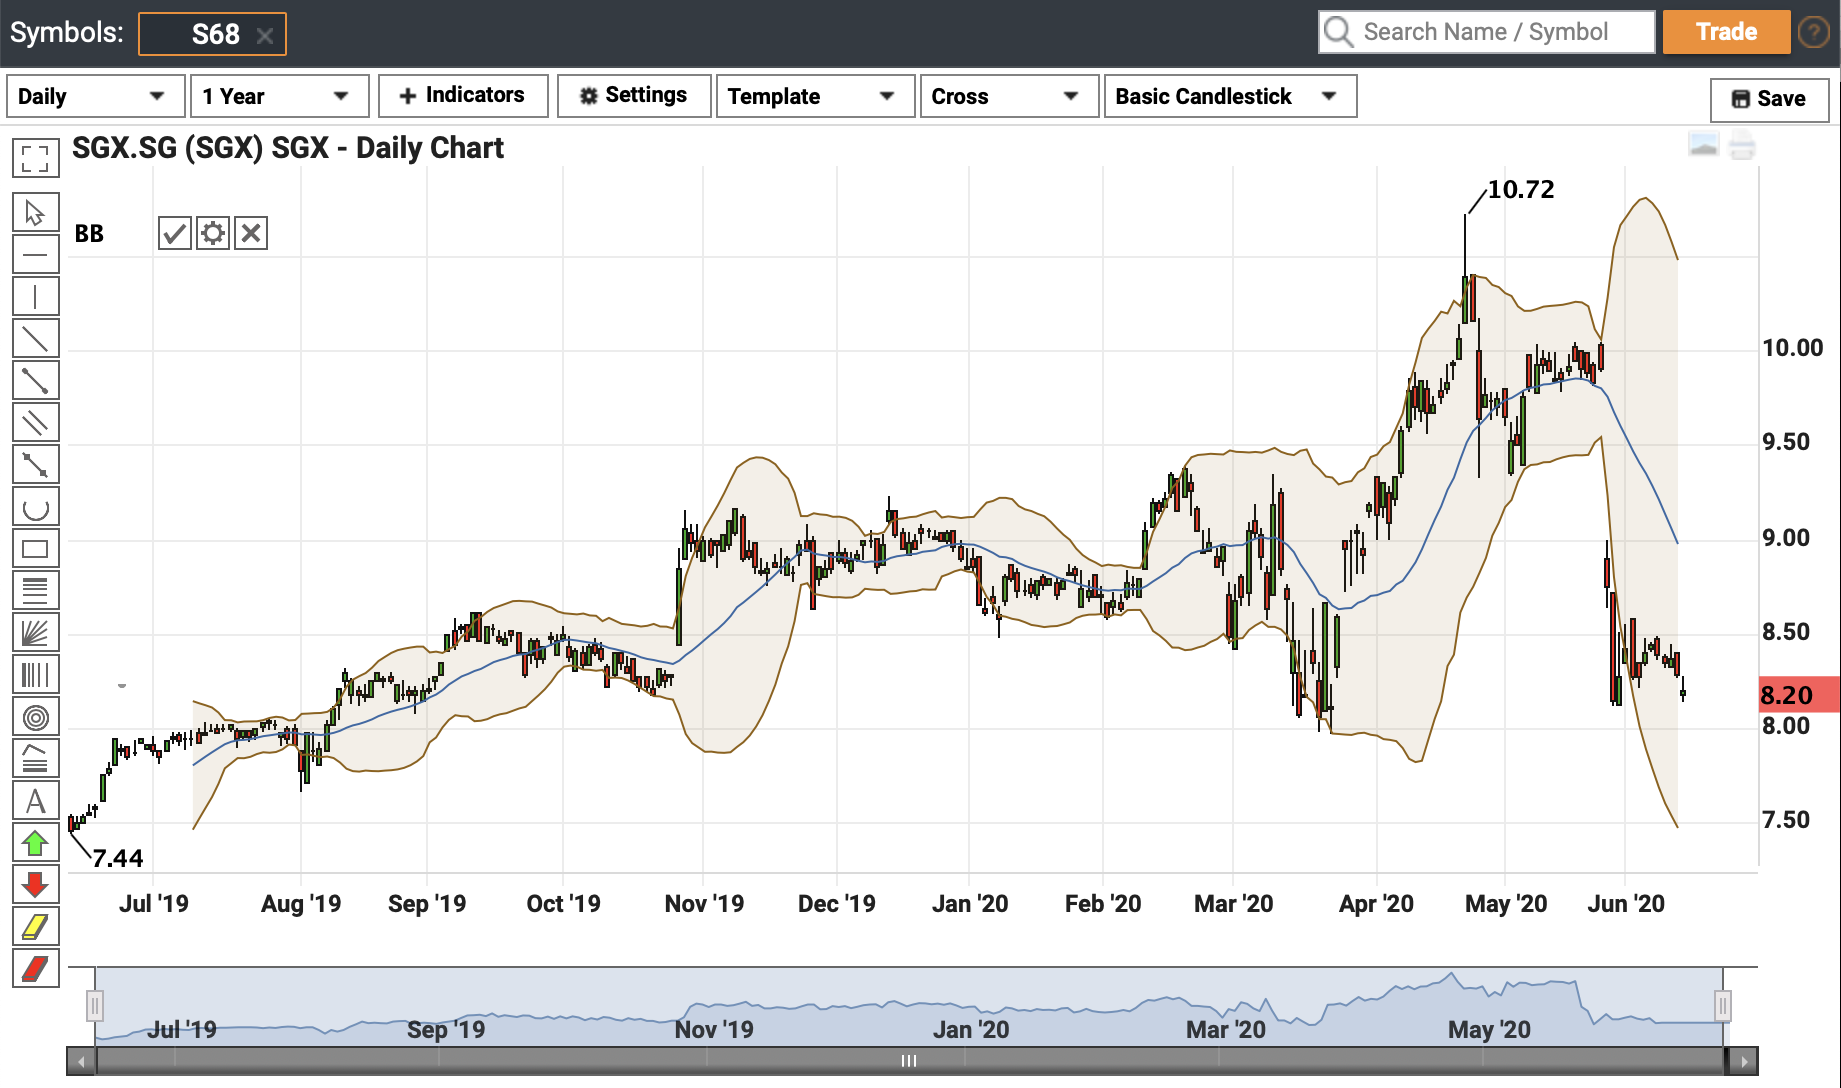
This indicator is composed of three lines: upper, middle and lower bands. The middle band represents the Simple Moving Average (SMA) of a stock’s price. It can be modified according to users’ preference. The upper and lower bands are 2 standard deviations away from the middle band.

To use the Bollinger Bands®, your first step will be to determine the SMA period. A 20-day SMA is most common. This averages out the closing prices of the stock for the first 20 days.
There are a number of uses of Bollinger Bands®. Not only can the bands be used to determine overbuying or overselling of a stock, they also look out for market volatility and breakout moments.
When a counter is overbought, you will find its price moving closer to its upper band. On the other hand, when its price is closer to the lower band, this suggests the counter could be oversold. As the standard deviation is a measure of volatility, you will find the bands widening when the market is more volatile and contracting when trading is less volatile.
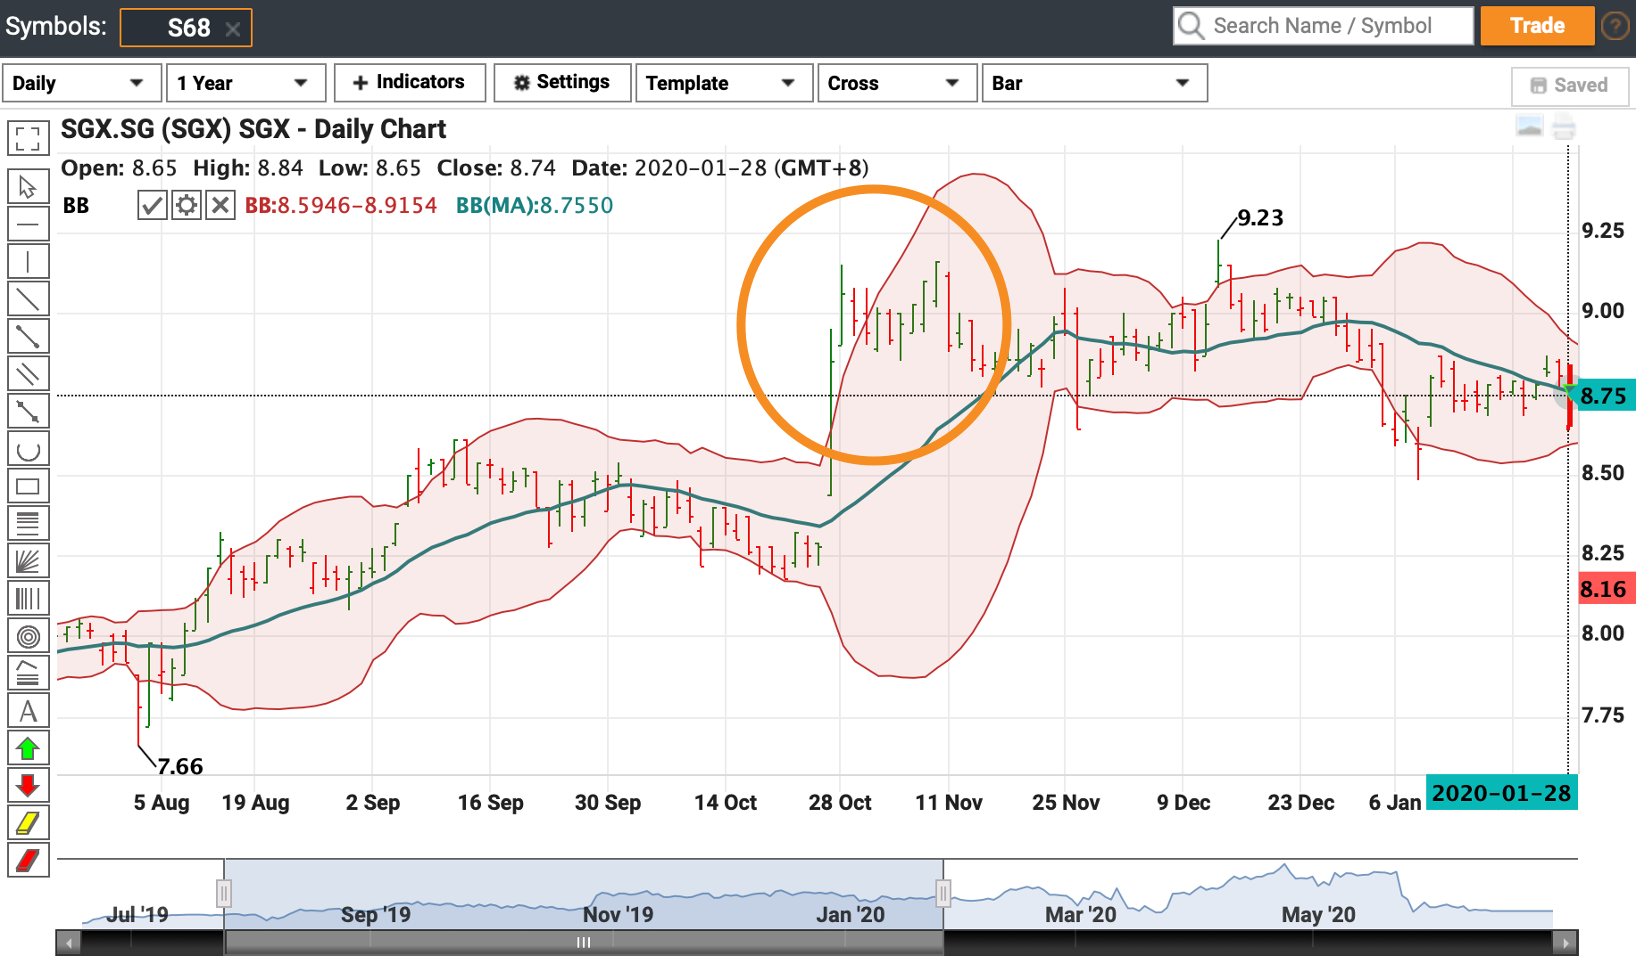
To identify a breakout, you will see the price cutting above or below the upper or lower band. However, a breakout is not a trading signal as it does not reveal any information about the direction of the price movements.
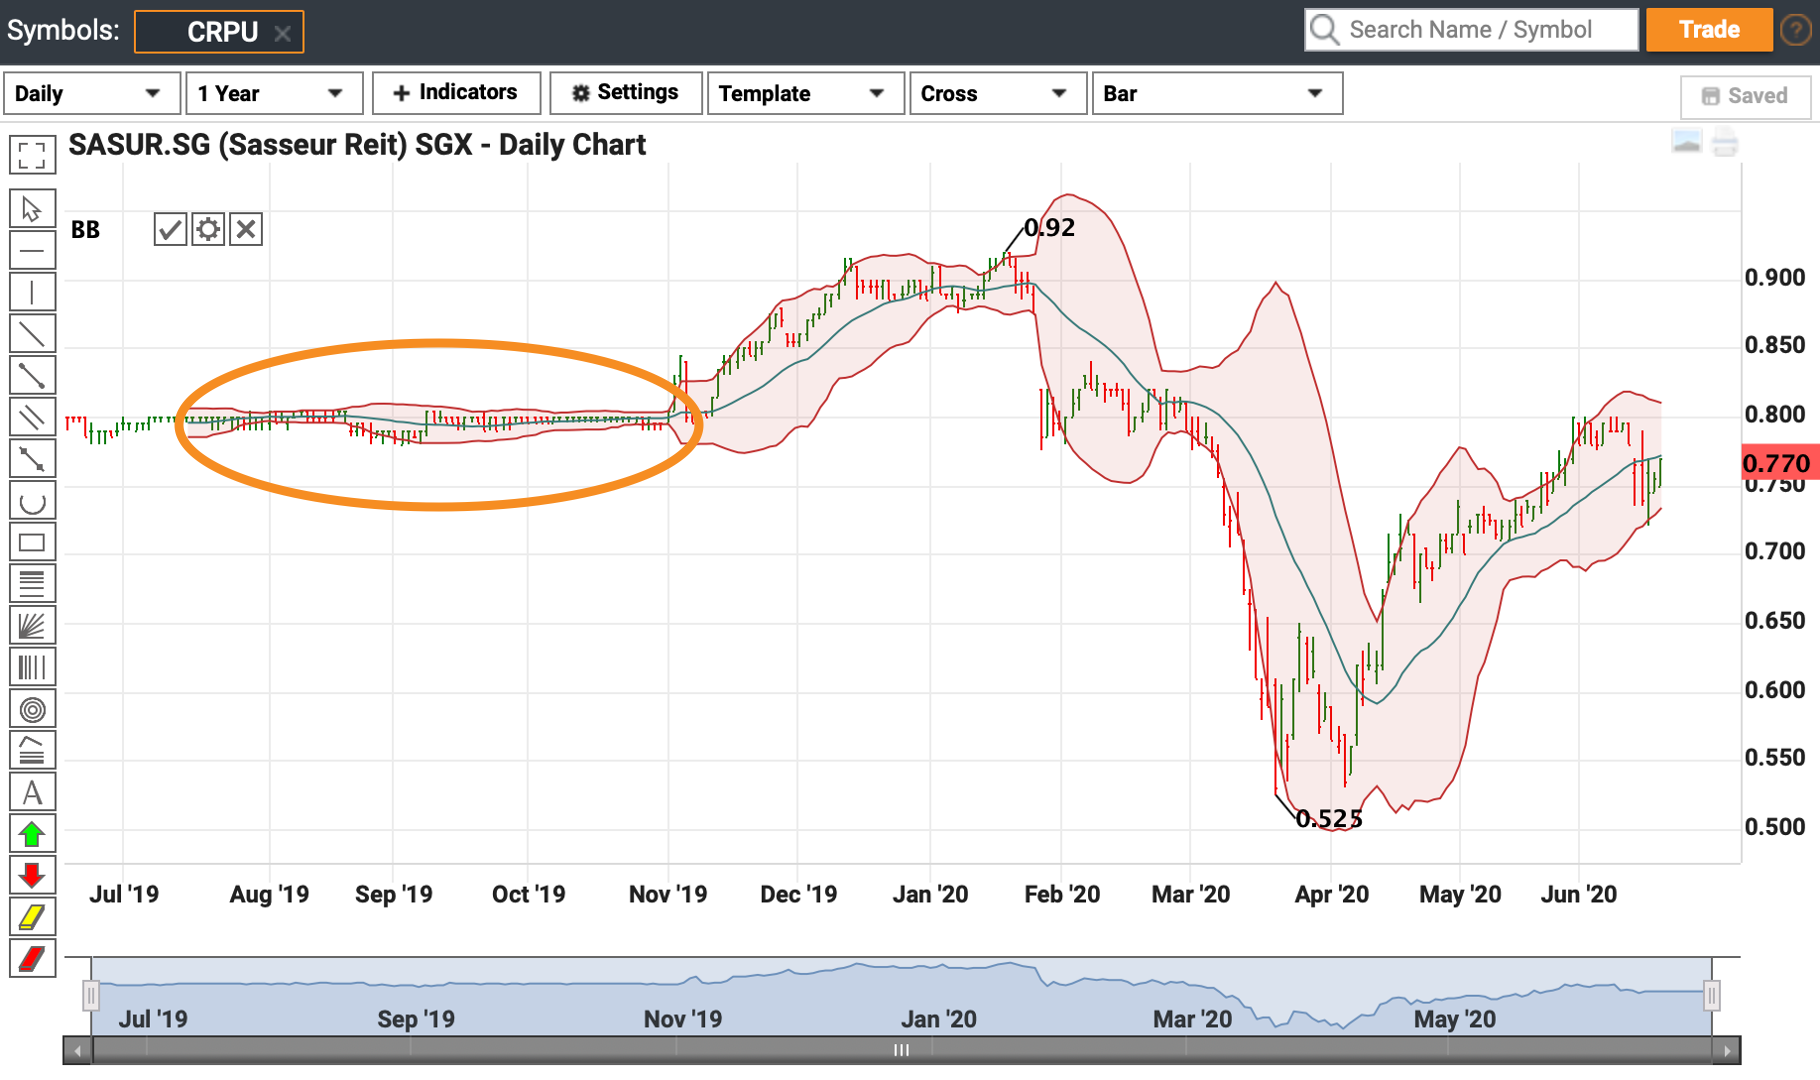
Another way to use the Bollinger Bands® is to identify the “squeeze” signal.
This signal occurs when the bands come very close together, as circled in orange in the image above. A “squeeze” typically suggests a low volatility period. Investors and traders consider this to be a sign of potential increased volatility and possible trading opportunities.
Conversely, when the bands are wider apart, this flags the likelihood of decreased volatility. Investors may take this as a cue to exit trades. However, note that these signs are not trading signals as they give no indication of the direction of price trends or when the changes may take place.
 Tip: On top of a simple MA, you can also opt for an exponential MA.
3.4 Simple Moving Average
The Simple Moving Average is a tool that smoothens out price trends using constantly updated average prices. The average prices are calculated by taking the mean of prices over a specific time frame, for example, over 10, 20 or 50 days.
Common moving average time frames are 15, 20, 30, 50, 100 and 200 days.
Typically, a shorter moving average of 5 to 20 days is used for short-term trading. Longer moving averages of 100 or more days are used to gauge long-term trends.
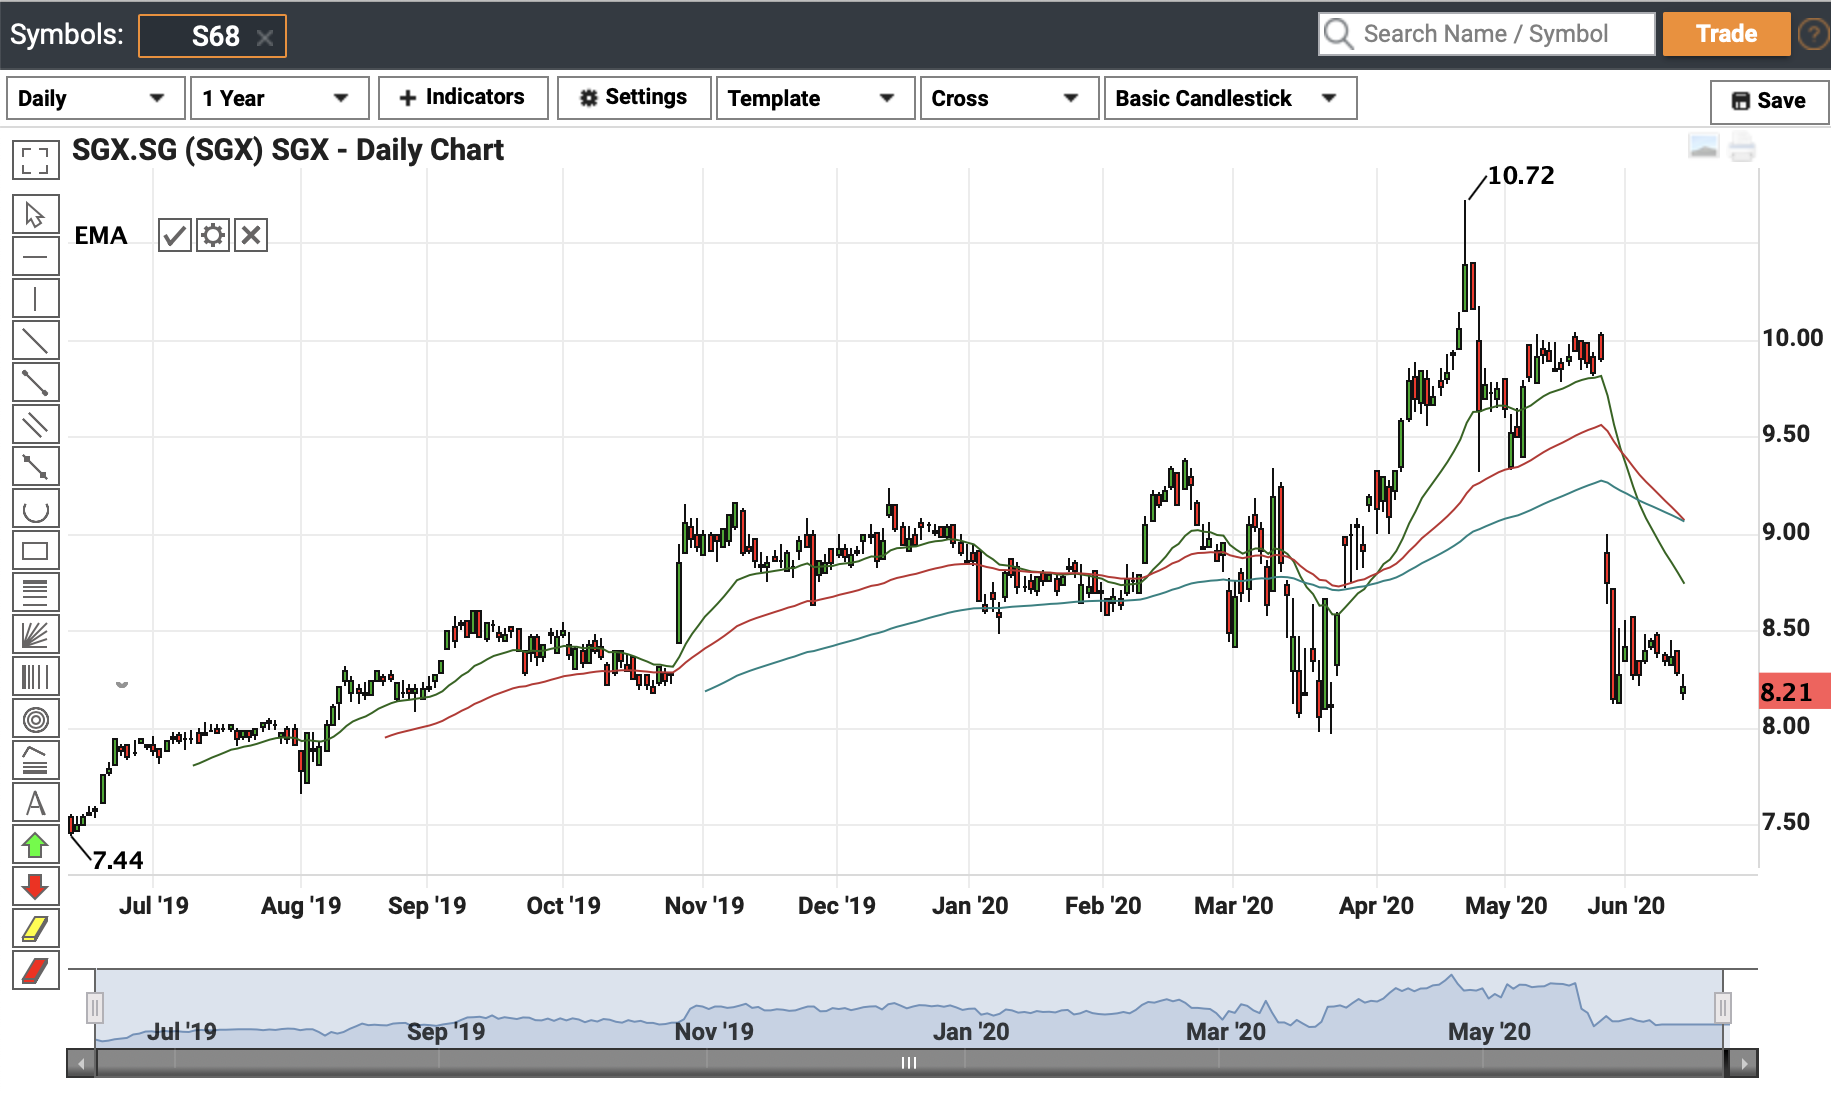
Moving averages are used to identify trend directions and trading signals. As a guide, when prices move above their moving averages, an uptrend is suggested. If prices fall below their moving average, a downtrend could be ahead.
Another moving-average phenomenon that investors and traders track is the Crossover. A Crossover occurs when prices and moving averages overlap. An overlap of different moving averages is also counted as a Crossover.
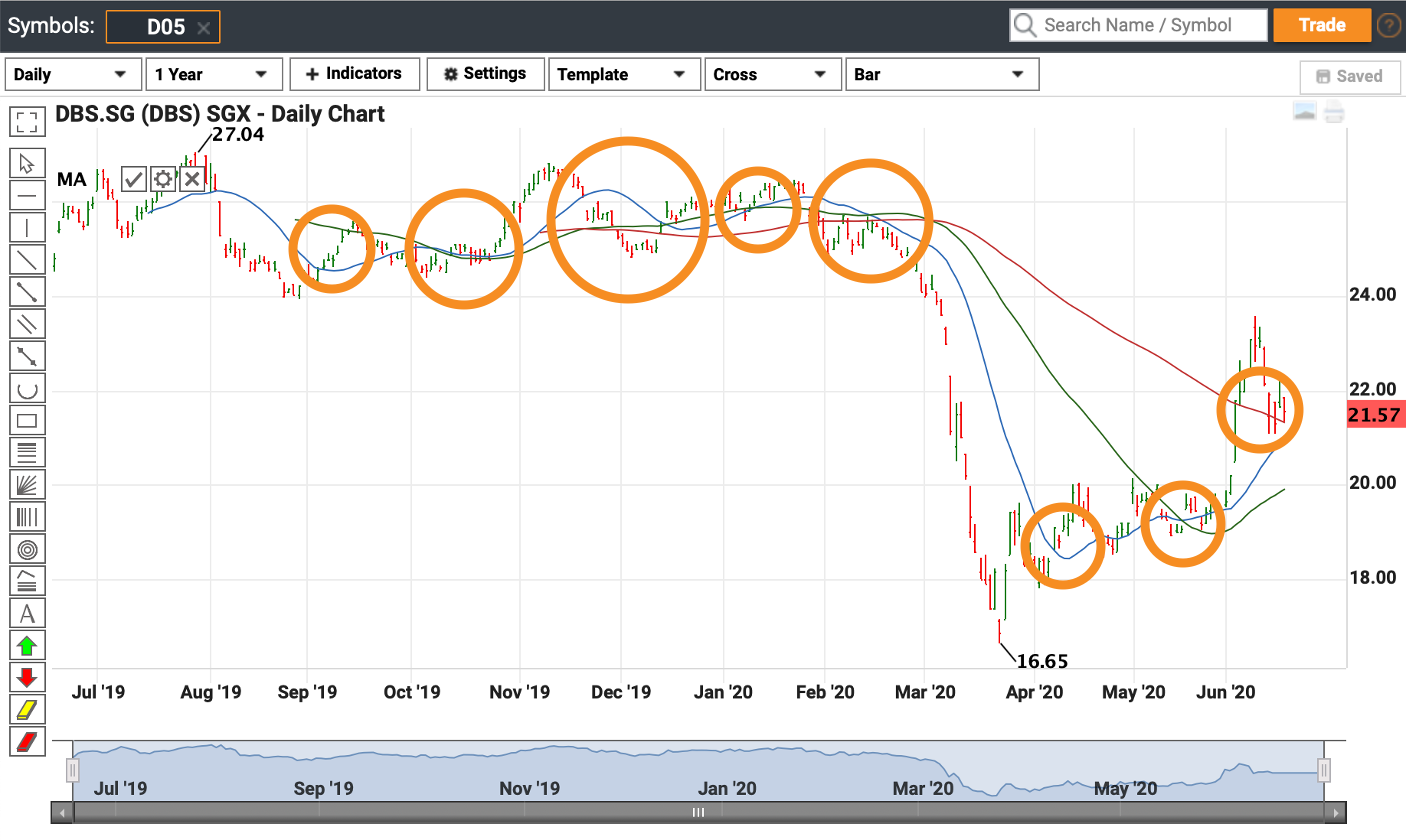
In the above chart, you can spot many Crossovers circled in orange from September 2019 to June 2020. Crossovers provide insights about possible trends that lie ahead. Their types include but are not limited to:
| Types of Crossover | Interpretation |
| When price crosses above or below a moving average | There might be a potential change in trend |
| When the shorter-term MA crosses above the longer-term MA | This is a buy signal as it indicates that the trend is moving upwards |
| When the shorter-term MA crosses below the longer-term MA | This is a sell signal as it indicates that the trend is moving downwards |
 Tip: Add up to five technical indicators on any chart to retrieve in-depth insights
 Bonus tip!
1) Did you know you can compare multiple counters with our Chart-Live tool? Simply search for the counters you would like to compare using the search instrument bar and tick the ‘Compare’ checkbox. You can then tick or untick your counters for comparison.

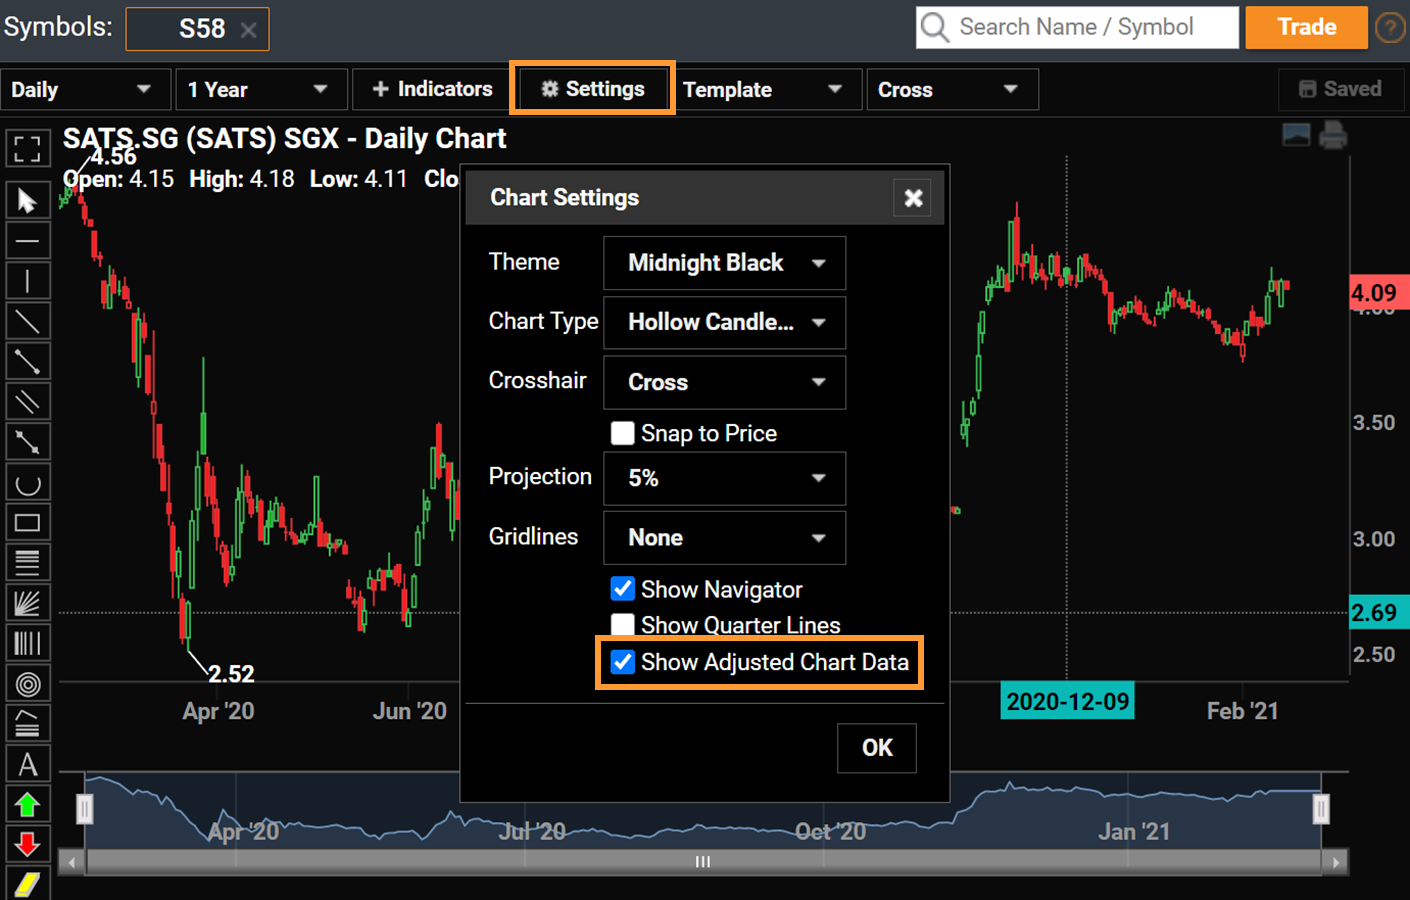
2) Keen to view data that have been adjusted for corporate actions such as dividends and stock splits? Available only for the SGX, simply go to ‘Settings’ and tick the ‘Show Adjusted Chart Data’ checkbox!
Charting is an essential tool for investors and traders. It provides invaluable insights into market trends. These help investors and traders identify trading opportunities. Price trends and indicators help investors and traders block out market noise and gain a better picture of markets to make informed investment decisions.
Navigating stock charts may be intimidating at first. However, with the above guide and a little practice, you will soon be able to use them to analyse stock movements and to spot the right time to buy and sell counters.
Be empowered with real-time streaming charts, customisable chart settings and technical indicators. Bringing together the best of intraday and historical charting, POEMS Chart-Live allows you to compare data of up to 20 years, for up to five different asset classes at one glance. Chart-Live is only available on POEMS 2.0 and POEMS Mobile 2.0.
Looking for a more sophisticated charting tool to conduct technical analysis? Stay tuned for our next article as we will be covering POEMS ChartView, an advanced charting tool available only on POEMS Pro. This helps you navigate unpredictable markets and identify trading trends and opportunities!
POEMS suite of trading platforms is made to suit the needs of all traders and investors. Open a Cash Plus Account to enjoy commission fee as low as 0.08%, no minimum* when you trade equities. Jumpstart your investing journey with POEMS now! *T&Cs Apply.
You may also interested in…
Disclaimer
These commentaries are intended for general circulation. It does not have regard to the specific investment objectives, financial situation and particular needs of any person who may receive this document. Accordingly, no warranty whatsoever is given and no liability whatsoever is accepted for any loss arising whether directly or indirectly as a result of any person acting based on this information. Opinions expressed in these commentaries are subject to change without notice. Investments are subject to investment risks including the possible loss of the principal amount invested. The value of the units and the income from them may fall as well as rise. Past performance figures as well as any projection or forecast used in these commentaries are not necessarily indicative of future or likely performance. Phillip Securities Pte Ltd (PSPL), its directors, connected persons or employees may from time to time have an interest in the financial instruments mentioned in these commentaries. Investors may wish to seek advice from a financial adviser before investing. In the event that investors choose not to seek advice from a financial adviser, they should consider whether the investment is suitable for them.
The information contained in these commentaries has been obtained from public sources which PSPL has no reason to believe are unreliable and any analysis, forecasts, projections, expectations and opinions (collectively the “Research”) contained in these commentaries are based on such information and are expressions of belief only. PSPL has not verified this information and no representation or warranty, express or implied, is made that such information or Research is accurate, complete or verified or should be relied upon as such. Any such information or Research contained in these commentaries are subject to change, and PSPL shall not have any responsibility to maintain the information or Research made available or to supply any corrections, updates or releases in connection therewith. In no event will PSPL be liable for any special, indirect, incidental or consequential damages which may be incurred from the use of the information or Research made available, even if it has been advised of the possibility of such damages. The companies and their employees mentioned in these commentaries cannot be held liable for any errors, inaccuracies and/or omissions howsoever caused. Any opinion or advice herein is made on a general basis and is subject to change without notice. The information provided in these commentaries may contain optimistic statements regarding future events or future financial performance of countries, markets or companies. You must make your own financial assessment of the relevance, accuracy and adequacy of the information provided in these commentaries.
Views and any strategies described in these commentaries may not be suitable for all investors. Opinions expressed herein may differ from the opinions expressed by other units of PSPL or its connected persons and associates. Any reference to or discussion of investment products or commodities in these commentaries is purely for illustrative purposes only and must not be construed as a recommendation, an offer or solicitation for the subscription, purchase or sale of the investment products or commodities mentioned.


