How to Use Market Streamer to Invest? December 8, 2020
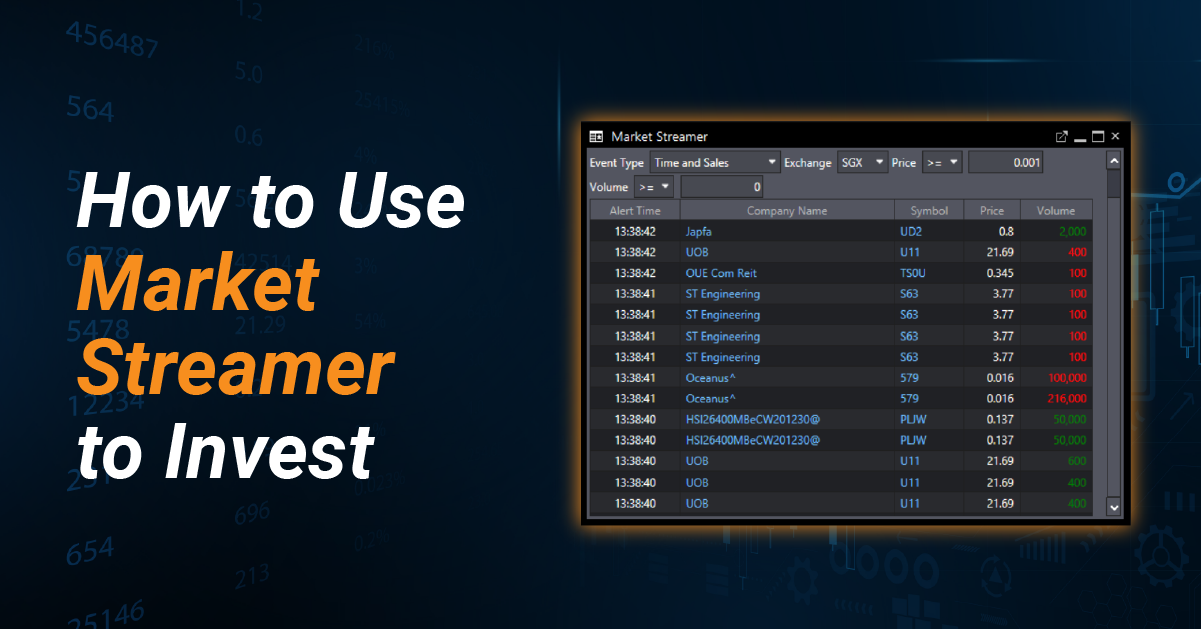
At a glance:
- Volatility brings uncertainties to markets but also a window of opportunity to make returns.
- Market Streamer is a great tool to scan the market in real-time to take advantage of fluctuations when making investing moves.
- This tool provides three main information – Time and Sales, Intraday High/Low and 52-Week High/Low.
- Traders can use this tool to identify where the action is in the market.
Reading time: 10 minutes
During times of market volatility, it’s natural to see investors and traders shy away from markets as higher risks are involved. However, while volatility brings uncertainties, it also provides a window of opportunity for investors to make calculated returns.
A great tool to help you scan the market in real-time and take advantage of fluctuations to make investing moves is POEMS Market Streamer. Read on to learn how you can utilise this tool when you trade on SGX!
What is Market Streamer?
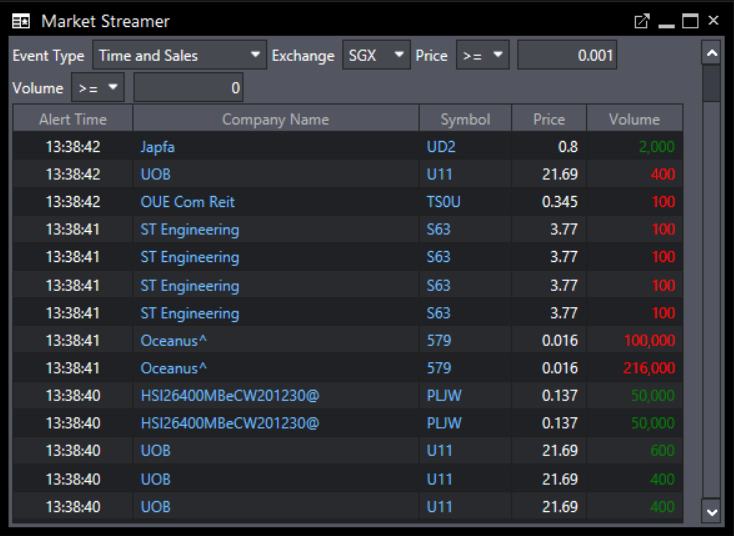
Unique to POEMS, Market Streamer is a tool that shows you which counters are being traded in real time on SGX. Designed to make monitoring the market much easier, this tool enables traders to identify active counters with significant trading activities easily.
You may ask, why is this tool an invaluable addition to a trader’s investment strategy?
Simple. Because of the valuable information it provides.
Despite its facile design, Market Streamer provides some of the most crucial information that every trader should scrutinise – all in a single module. As it has been tailored to make scanning markets much easier, it is great for traders looking to get a quick overview of the market.
Furthermore, the tool allows traders to identify where the action is in the market. As it tells which counters are attracting the most investor interest, it can unfold salient information about a stock’s performance and any new or timely developments leading to high trading activity.
How to use Market Streamer to invest?

When you open Market Streamer, you would be greeted by a running list of counters that are being traded in real-time. At the top of the tool, you will see several filters that you can apply to narrow down the counters of your interest, including event type, price and volume.
1. Event type
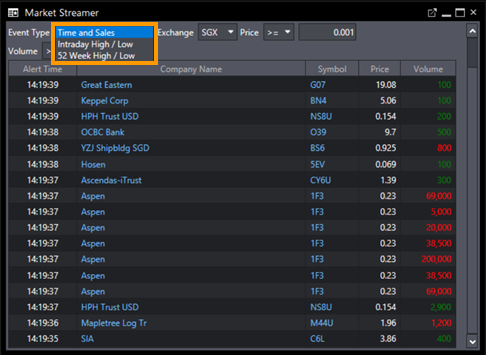
There are three event types available: Time and Sales, Intraday High/Low and 52-Week High/Low.
1.1 Time and Sales
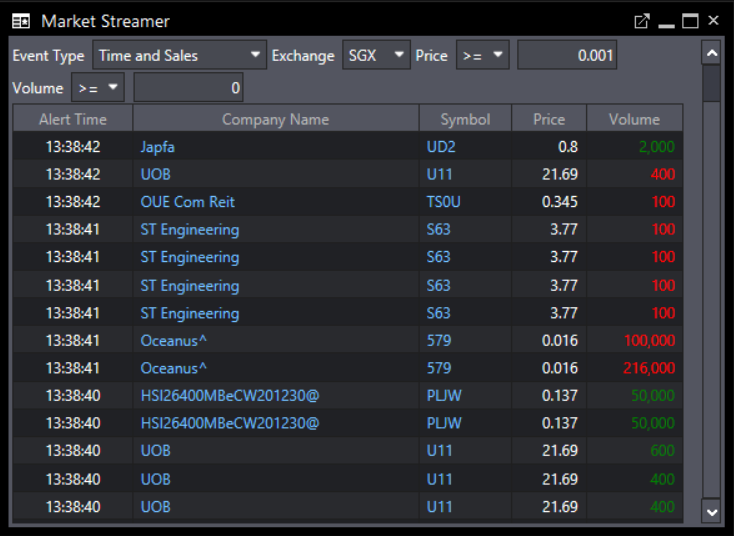
Similar to another of POEMS’s tools, Time & Sales, you can view real-time trade orders whenever there is a buy or sell activity. The only difference between Time & Sales and Market Streamer (Time and Sales) is that the latter displays the trading activity of all counters on the exchange. In other words, you are getting real-time information for not only one, but all traded counters on SGX.
Under this event type, you will find five pieces of information:
- Alert Time refers to the exact time a trade was executed.
- Company Name refers to the counter being traded.
- Symbol refers to the stock symbol of the counter being traded.
- Price refers to the dollar value at which the trade was completed.
- Volume refers to the total number of shares of a counter traded.
Time and Sales can reveal three things about a counter – trade direction, volume and speed of transaction. Trade direction gives you an idea of the market direction while speed backs this up by conveying the level of interest in that counter. Volume is used to further confirm the trend, such as when large transactions are involved. Generally, these three indicators are used concurrently to determine price trends.
Need more information about how Time & Sales can aid you in your trade? Check out ourTime & Sales article!
1.2. Intraday High/Low
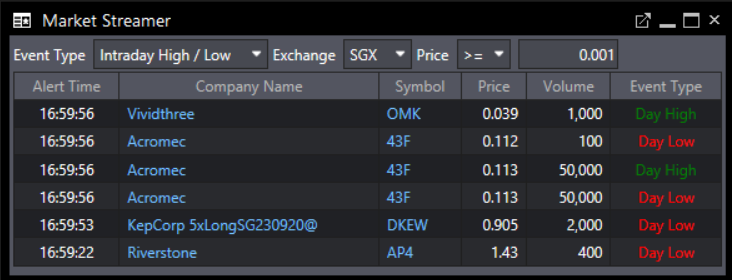
The Intraday High/Low event type provides a great overview of counters that have hit new highs or lows for the day. If you are using this event type, you will notice an additional column, “Event Type”, where you will find two variables: Day High and Day Low. The former refers to the highest price at which a stock exchanged hands during the day while the latter refers to the lowest price of the period. .
This event type enables traders to spot counters that have broken out of their day ranges effortlessly. On top of that, traders can identify any large gaps in a counter’s price. The identification of gaps, trading volumes and trends are particularly useful if you are looking for buy or sell signals.
For instance, when a counter makes a new high, it may suggest a bullish trend as there are more buyers in the market driving prices up. Conversely, when a counter makes a new low, a bearish trend may be forming, since there are more sellers pushing prices down. However, to further confirm a trend, traders should also refer to charting tools or any other resources such as stock news to generate more accurate trading ideas.
1.3. 52-Week High/Low

Generally, a range breakout can suggest that prices are likely to head in the same direction. This can provide signals for traders to buy or sell a counter when the price exceeds or falls below its 52-week high and low. However, to generate a more accurate conclusion about the price trend, traders should also utilise charting tools or other resources such as stock news.
To tell if a counter has hit a new high or low across a 52-week period, you can refer to the “Event Type” column. In the above illustration, Lum Chang recorded a 52-week high at S$0.385.
2. Price and Volume
Market Streamer can also be used to unveil counters traded at a specific price and volume.
An important metric that every trader should always refer to is volume. Volume is a great indicator of a counter’s overall trading activity as it reveals the supply and demand of a counter as well as price trend.

If you are using the Time and Sales filter, you will see volumes colour-coded in green or red. Green represents a buy transaction while red represents a sell transaction.
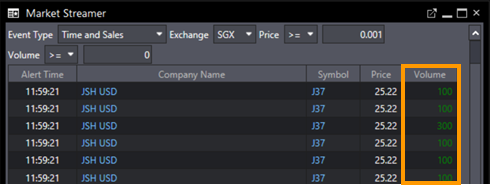
Typically, higher volatility and larger influence on price trends are expected when trading volume is high. Many transactions in green for a particular counter can suggest there are more buyers in the market. Multiple transactions in red can signify more sellers in the market. That said, it is important to also consider volume size and speed of trades before you confirm a trend.
Want a quick demo of our Market Streamer tool? Watch this video: https://bit.ly/3lmkjXI
Where can I find Market Streamer on POEMS?
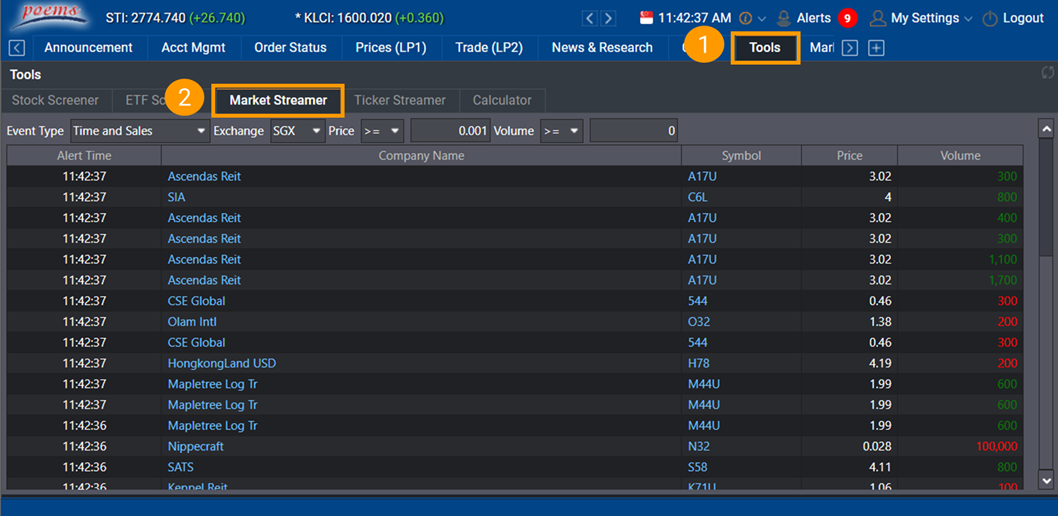
POEMS 2.0
1) Go to Tools tab
2) Select Market Streamer
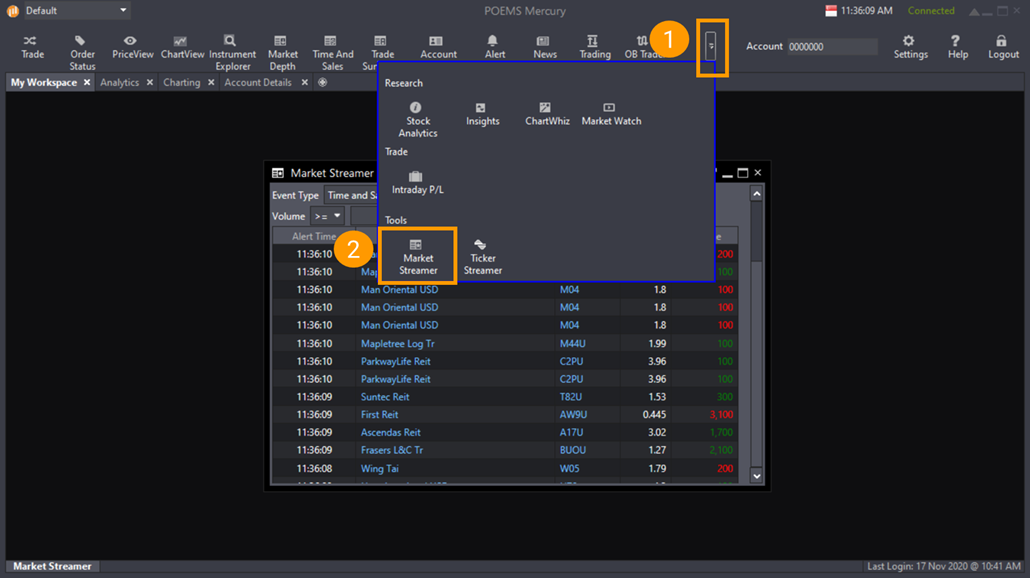
POEMS Pro
1) Expand the toolbar if you are unable to find Market Streamer
2) Select Market Streamer
Market Streamer is only available on POEMS 2.0 and POEMS Pro. Utilise this tool to track daily market movements and navigate the Singapore market when trading on POEMS 2.0 and POEMS Pro!
POEMS suite of trading platforms is made to suit the needs of all traders and investors. Open a Cash Plus Account to enjoy commission fee as low as 0.08%, no minimum* when you trade equities. Jumpstart your investing journey with POEMS now! *T&Cs Apply.
You may also interested in…


 Predicting Trend Reversals with Candlestick Patterns for Beginners
  Introduction to unit trust
  Back in Business: The Return of IPOs & Top Traded Counters in March 2024
  From $50 to $100: Unveiling the Impact of Inflation


