
ARM Holdings - ADR - Stock Analyst Research
| Target Price* | - |
| Recommendation | NON-RATED› NON-RATED |
| Market Cap* | - |
| Publication Date | 13 Sep 2023 |
*At the time of publication
Arm Holdings Limited - IPO Fact Sheet
- Offering 95,500,000 shares at US$47-US$51 per share for a total offer amount of US$5.2bn. Largest IPO valuation of ~US$55bn with 1,026,078,866 shares outstanding.
- ARM mainly generates revenue from licensing and royalty fees from its semiconductor architecture design. It does not sell or manufacture any semiconductors.
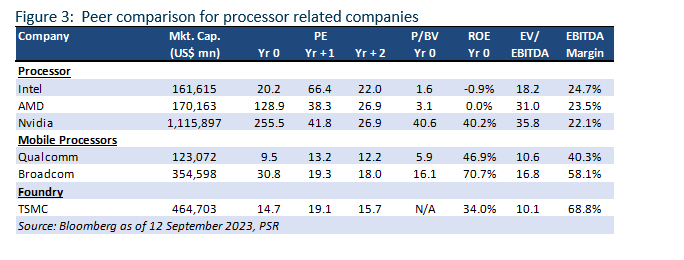
- Top end of IPO range will put ARM’s LTM P/S ratio at 20x, with a LTM P/E ratio of 105x. Peer valuation of Broadcom and Qualcomm are 31x and 10x LTM P/E, respectively.
**Update 14/9/23: ARM has priced its IPO at US$51 per share.
IPO Details
Semiconductor chip designer ARM’s highly anticipated initial public offering (IPO) is set to list on the Nasdaq this coming Thursday (14th Sep 23), in what appears to be the most valuable IPO in market history. The company is looking to offer 95,500,000 vendor shares at a price per share of US$47-US$51, at an offer amount of ~US$5.2bn, with a lock up period of 180 days for company insiders. This would value ARM at ~US$55bn, making it the world’s largest IPO in history, and 38% higher than NVDA’s proposed US$40bn acquisition last year.
ARM has since enticed many of its major customers to subscribe to its IPO, contributing to the 10x oversubscription. It has also said that it would not offer any more shares, which we think could lead to ARM pricing its offering slightly above its guided per share range of US$47-US$51.
Company Background
ARM was established in 1990 as a joint venture between Acorn Computers, Apple Computer, and VLSI Technology. The original joint venture set out to develop a CPU that combined high-performance with power efficiency. Its CPUs initially gained traction in mobile phones in the mid-1990s because ARM’s energy-efficient processors provided an appropriate level of performance while consuming little power, which was critical for these smaller form factor devices. ARM was listed on the London Stock Exchange and the Nasdaq Stock Market from 1998 until 2016, when it was taken private by SoftBank Group, the company’s controlling shareholder.
ARM does not sell or produce chips. Instead, the company generates revenue by licensing their products to semiconductor companies, OEMs, and other organisations to design their chips. ARM customers license its products for a fee, which gives them access to the company’s designs and enables them to create ARM-based chips. The company receives a per-unit royalty when a chip has been designed and manufactured with ARM’s technology. The royalty is typically based on a percentage of the average selling price (ASP) of the chip or a fixed fee per unit. This creates a long-term recurring revenue opportunity from each design win. In FY23 (which ended March 31, 2023), royalty revenue represented 63% of total revenue. As of FY23, Arm had 5,963 employees, with ~80% of them focused on R&D.
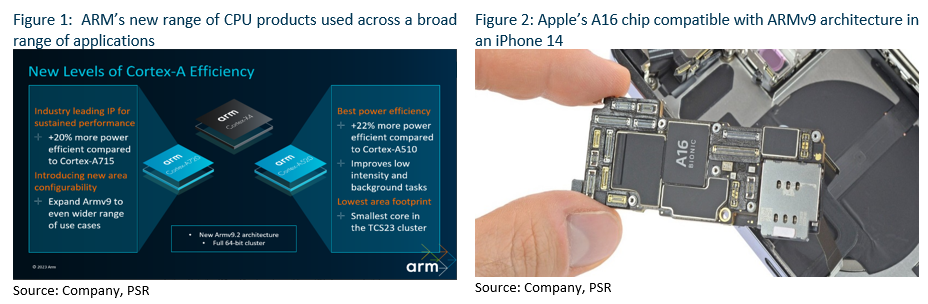
ARM’s products can be used in chips that contain a processor. As such, its technology can be present in various applications, including smartphones, PCs, digital TVs, IoT devices, cloud computing and servers, automotive, and networking equipment. The company’s customer base includes major tech companies like Apple, Nvidia, Alphabet, AMD, Intel, and Samsung. In its IPO prospectus, ARM estimated that its total addressable market (TAM) in CY22 was ~$200bn, with the expectation that this would grow at a 6.8% CAGR until CY25. ARM also estimates that the aggregate value of chips containing its ARM technology represented ~49% market share in CY22 (vs 42% in CY20).
In the mobile application processor market (where it has >99% market share), ARM expects a CAGR of 6.4% until CY25, driven by an increasing need for high-performance processing capabilities with the emergence of AI and Machine Learning workloads, and the ongoing shift to 5G networks. Mobile is estimated to account for ~80% of FY23 revenue.
The cloud compute and automotive markets are where ARM sees the most growth moving forward, with a CAGR of 16.6% and 15.7%, respectively (until CY25). As of CY22, the company has also seen an increase to its market share in both markets to 10% and 41%, respectively, (increasing from 7% and 33% in CY20), with more cloud service providers (CSPs) starting to increase their deployment of ARM products in their data centers, and automotive electronics transitioning towards more software-defined architecture.
Peer Valuations
Assuming an IPO price at the top of its range at US$51, ARM’s LTM P/S ratio would be ~20x, with a LTM P/E ratio of ~105x, a significant premium to some of its peers in the mobile processor space (Qualcomm: 10x P/E, Broadcom: 31x P/E).
About the author

Phillip Research Team
Important Information
This report is prepared and/or distributed by Phillip Securities Research Pte Ltd ("Phillip Securities Research"), which is a holder of a financial adviser’s licence under the Financial Advisers Act, Chapter 110 in Singapore.
By receiving or reading this report, you agree to be bound by the terms and limitations set out below. Any failure to comply with these terms and limitations may constitute a violation of law. This report has been provided to you for personal use only and shall not be reproduced, distributed or published by you in whole or in part, for any purpose. If you have received this report by mistake, please delete or destroy it, and notify the sender immediately.
The information and any analysis, forecasts, projections, expectations and opinions (collectively, the “Research”) contained in this report has been obtained from public sources which Phillip Securities Research believes to be reliable. However, Phillip Securities Research does not make any representation or warranty, express or implied that such information or Research is accurate, complete or appropriate or should be relied upon as such. Any such information or Research contained in this report is subject to change, and Phillip Securities Research shall not have any responsibility to maintain or update the information or Research made available or to supply any corrections, updates or releases in connection therewith.
Any opinions, forecasts, assumptions, estimates, valuations and prices contained in this report are as of the date indicated and are subject to change at any time without prior notice. Past performance of any product referred to in this report is not indicative of future results.
This report does not constitute, and should not be used as a substitute for, tax, legal or investment advice. This report should not be relied upon exclusively or as authoritative, without further being subject to the recipient’s own independent verification and exercise of judgment. The fact that this report has been made available constitutes neither a recommendation to enter into a particular transaction, nor a representation that any product described in this report is suitable or appropriate for the recipient. Recipients should be aware that many of the products, which may be described in this report involve significant risks and may not be suitable for all investors, and that any decision to enter into transactions involving such products should not be made, unless all such risks are understood and an independent determination has been made that such transactions would be appropriate. Any discussion of the risks contained herein with respect to any product should not be considered to be a disclosure of all risks or a complete discussion of such risks.
Nothing in this report shall be construed to be an offer or solicitation for the purchase or sale of any product. Any decision to purchase any product mentioned in this report should take into account existing public information, including any registered prospectus in respect of such product.
Phillip Securities Research, or persons associated with or connected to Phillip Securities Research, including but not limited to its officers, directors, employees or persons involved in the issuance of this report, may provide an array of financial services to a large number of corporations in Singapore and worldwide, including but not limited to commercial / investment banking activities (including sponsorship, financial advisory or underwriting activities), brokerage or securities trading activities. Phillip Securities Research, or persons associated with or connected to Phillip Securities Research, including but not limited to its officers, directors, employees or persons involved in the issuance of this report, may have participated in or invested in transactions with the issuer(s) of the securities mentioned in this report, and may have performed services for or solicited business from such issuers. Additionally, Phillip Securities Research, or persons associated with or connected to Phillip Securities Research, including but not limited to its officers, directors, employees or persons involved in the issuance of this report, may have provided advice or investment services to such companies and investments or related investments, as may be mentioned in this report.
Phillip Securities Research or persons associated with or connected to Phillip Securities Research, including but not limited to its officers, directors, employees or persons involved in the issuance of this report may, from time to time maintain a long or short position in securities referred to herein, or in related futures or options, purchase or sell, make a market in, or engage in any other transaction involving such securities, and earn brokerage or other compensation in respect of the foregoing. Investments will be denominated in various currencies including US dollars and Euro and thus will be subject to any fluctuation in exchange rates between US dollars and Euro or foreign currencies and the currency of your own jurisdiction. Such fluctuations may have an adverse effect on the value, price or income return of the investment.
To the extent permitted by law, Phillip Securities Research, or persons associated with or connected to Phillip Securities Research, including but not limited to its officers, directors, employees or persons involved in the issuance of this report, may at any time engage in any of the above activities as set out above or otherwise hold an interest, whether material or not, in respect of companies and investments or related investments, which may be mentioned in this report. Accordingly, information may be available to Phillip Securities Research, or persons associated with or connected to Phillip Securities Research, including but not limited to its officers, directors, employees or persons involved in the issuance of this report, which is not reflected in this report, and Phillip Securities Research, or persons associated with or connected to Phillip Securities Research, including but not limited to its officers, directors, employees or persons involved in the issuance of this report, may, to the extent permitted by law, have acted upon or used the information prior to or immediately following its publication. Phillip Securities Research, or persons associated with or connected to Phillip Securities Research, including but not limited its officers, directors, employees or persons involved in the issuance of this report, may have issued other material that is inconsistent with, or reach different conclusions from, the contents of this report.
The information, tools and material presented herein are not directed, intended for distribution to or use by, any person or entity in any jurisdiction or country where such distribution, publication, availability or use would be contrary to the applicable law or regulation or which would subject Phillip Securities Research to any registration or licensing or other requirement, or penalty for contravention of such requirements within such jurisdiction.
This report is intended for general circulation only and does not take into account the specific investment objectives, financial situation or particular needs of any particular person. The products mentioned in this report may not be suitable for all investors and a person receiving or reading this report should seek advice from a professional and financial adviser regarding the legal, business, financial, tax and other aspects including the suitability of such products, taking into account the specific investment objectives, financial situation or particular needs of that person, before making a commitment to invest in any of such products.
This report is not intended for distribution, publication to or use by any person in any jurisdiction outside of Singapore or any other jurisdiction as Phillip Securities Research may determine in its absolute discretion.
IMPORTANT DISCLOSURES FOR INCLUDED RESEARCH ANALYSES OR REPORTS OF FOREIGN RESEARCH HOUSE
Where the report contains research analyses or reports from a foreign research house, please note:
- recipients of the analyses or reports are to contact Phillip Securities Research (and not the relevant foreign research house) in Singapore at 250 North Bridge Road, #06-00 Raffles City Tower, Singapore 179101, telephone number +65 6533 6001, in respect of any matters arising from, or in connection with, the analyses or reports; and
- to the extent that the analyses or reports are delivered to and intended to be received by any person in Singapore who is not an accredited investor, expert investor or institutional investor, Phillip Securities Research accepts legal responsibility for the contents of the analyses or reports.


 Apple Inc. - More visibility into AI strategy
 Phillip Singapore Monthly – Jun26 - The Great AI Wealth Transfer
 SG Bonds - Week 24 : SGS yields moved higher WoW