
Sea Ltd. - Shopee picking up the slack
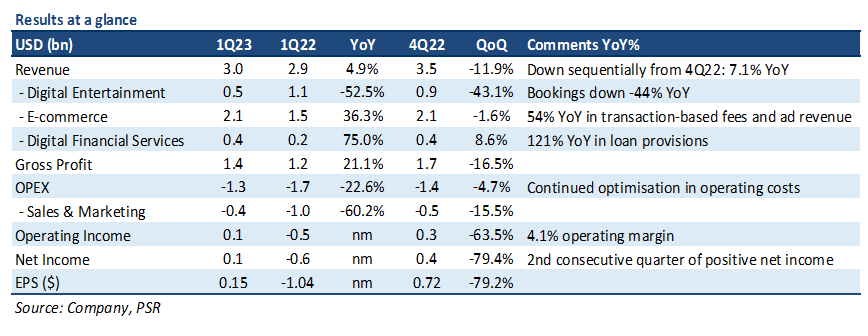
19 May 2023- 1Q23 revenue missed expectations marginally due to decline in gaming revenue. Earnings were above our expectations, but negatively impacted by a 121% YoY increase in loan provisions. 1Q23 revenue was at 21% our FY22e forecasts, with PATMI ~US$670mn better than our FY23e forecasts due to better monetization and lower marketing spend.
- Shopee growth is re-accelerating on better monetization and resilient GMV trends in Southeast Asia. Expenses continued to decline, increasing operating profitability across all business segments.
- We cut our FY23e/FY24e revenue by 9%/12% respectively to reflect slower growth as Garena continues to drag, while increasing FY23e PATMI/EBITDA by US$940mn/US$838mn on profitability across all segments. We maintain BUY with a reduced DCF target price of US$100.00 (prev. US$120.00), using a WACC of 7.6%, and a terminal growth rate of 3.0%.
The Positives
+ Shopee growth re-accelerating on better monetisation. Revenue growth accelerated sequentially from 32% YoY in 4Q22 to 36% YoY. 54% YoY growth in core marketplace revenues (transaction-based fees and advertising revenue) were the main driver as monetisation improved. Indonesia, Malaysia, and Thailand were the best performing regions, with Shopee Brazil breakeven in sight. Operating margin increased sequentially by 40bps to 5.6%, with operating income improving by ~US$915mn YoY due to a -52% reduction in marketing spend.
+ Expenses continued to decline, contributing to sustained profitability. Operating expenses were down -23% YoY, led by a drop in marketing spend of -60% YoY (US$605mn), offset with a ~US$100mn YoY increase in loan provisions. SE had its 2nd straight quarter of net profit (US$87mn). Operating expenses are expected to continue declining given the company’s focus on cost optimization and profitability.
The Negative
– Topline growth declining sequentially, dragged by Garena. YoY revenue growth for 1Q23 was 4.9%, down sequentially from 7.1% in 4Q22. Overall growth was hurt by a -53% decline in gaming revenue, with bookings down -44% YoY. The quarterly paying user (QPU) ratio was also down 2.3% to 7.7% (1Q22: 10.0%) as Garena continued to see weakening user trends. Garena revenue represented 31% of total revenue in FY22, but only 16% in 1Q23.
Gross Merchandise Value (GMV): total value of merchandise sold over a given period on Shopee.
Quarterly Paying User (QPU) Ratio: ratio of the average number of QPU in a quarter vs the average quarterly active users (QAU).
About the author

Jonathan Woo
Research Analyst
PSR
Jonathan covers the US technology sector focusing on internet companies. Formerly a national and professional athlete, he graduated from the University of Oregon with a Bachelor’s Degree in Social Sciences.


About the author
Jonathan Woo
Research Analyst
PSR
Jonathan covers the US technology sector focusing on internet companies. Formerly a national and professional athlete, he graduated from the University of Oregon with a Bachelor’s Degree in Social Sciences.
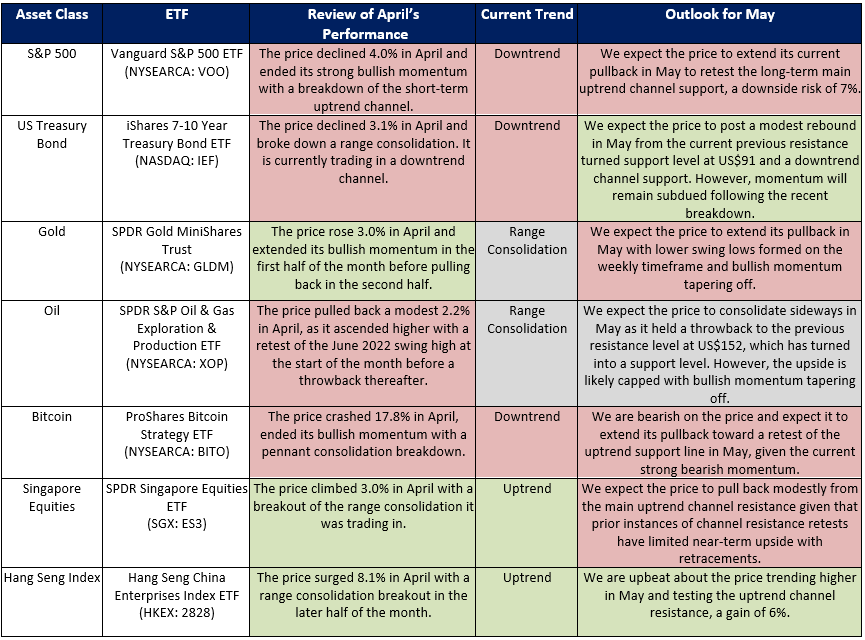 ETF Monthly: Apr 24 - Lacklustre month expected for Bitcoin, Gold, and S&P 500. But stellar Hong Kong.
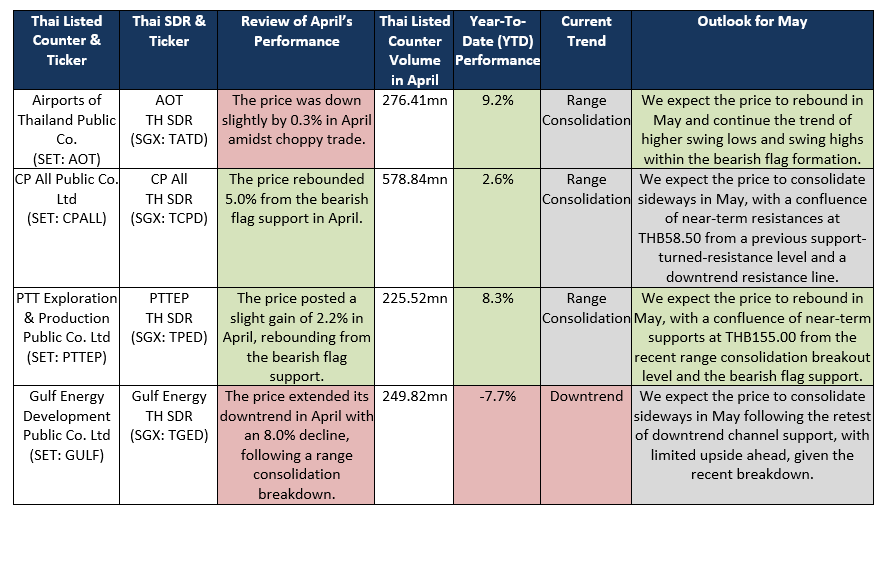 Thai SDR Monthly: Apr 24 - AOT, Kasikornbank and PTTEP to outperform
 DBS Group Holdings Ltd - NII and Fee Income boost earnings