
Phillip 2023 Singapore Strategy - Positioning for disinflation (Amended)
4 Jan 2023Review: Singapore was a standout outperformer in 2022. In US dollar terms, Singapore equities were up 4.8% in 2022, (2021: +7.7%). A huge 24-25% points outperformance over US and Asia (Ex-Japan) equities. Banks’ performance was resilient as major beneficiaries of rising interest rates and healthy asset quality.
Outlook: The largest pressure point for all asset types in 2022 was larger-than-expected spike in interest rates. We started the year expecting only 0.75% rise by end-2022. Instead, the Fed went for 4.25%. This decimated global equity and bond markets. The Ukraine conflict exacerbated inflation with a surge in commodity prices. The inflation trade of 2022 was long US dollar and short equities and bonds. Our strategy for 2023 is the opposite. We expect inflation to fall sharply this year. Multiple indicators point to a steeper slowdown of inflation in the US. Goods inflation is sharply down (Figure 5), key services such as rents are turning around (Figure 6), freight rates are collapsing (Figure 7), and money supply is contracting (Figure 8). Core PCE (the Fed’s favourite inflation gauge) on an annualized basis is currently 2.6%, close to the Fed’s 2% target. A recession in the US is likely. The yield curve is significantly inverted (Figure 9) and other economic indicators are slowing down. However, we expect any recession to be modest. This is because of strong employment and the absence of deflation shocks reminiscent of the mortgage debt or banking crisis of 2008. A huge deleveraging has taken place but is isolated with the US$2tr collapse in cryptocurrencies. We guess there is a limit to how much of your own (crypto) money you can print to get rich. During inflationary recessions, similar to the 1970s, nominal GDP or operating cash flows did not contract (Figure 10). Over 1970-82, when the US faced four recessions, nominal GDP growth averaged 10% and earnings only fell 3%.
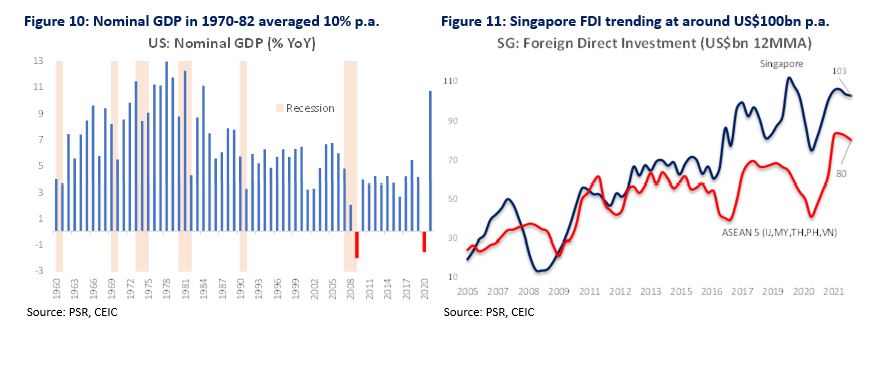
Recommendation: We expect another year of outperformance for Singapore. Sectors we favour are REITs, banks and consumer. The domestic economy is in great shape. Retail sales is trending at 16x pre-pandemic levels (Figure 21). Wage growth is at a 15-year high (Figure 23), job vacancies ample (Figure 24) and foreign direct investments steady at US$100bn plus p.a. (Figure 11). The year-end bonus was the re-opening of China’s borders and removal of COVID-19 restrictions. Tourism constituted 5 percentage points of Singapore’s GDP in 2019. We estimate three-quarters of the Singapore equity index will enjoy a tailwind from China’s recovery. All three local banks have loan and real estate exposure to China. China is the second-largest destination for telcos’ roaming revenue. Listed GLCs benefit from fund management, property development, mall and hospitality ownership in China. With interest rates peaking, we expect a recovery in REIT performance, particularly US REITs listed on the SGX. We believe many are trading at distressed valuations, at 40% discounts to NAV and dividend yields of 14%. As the cost of capital is repriced higher and rationed, companies with high ROEs or cash generators should be re-rated higher, such as HRnetGroup, ComfortDelgro, SGX and Del Monte Pacific.
2022 REVIEW
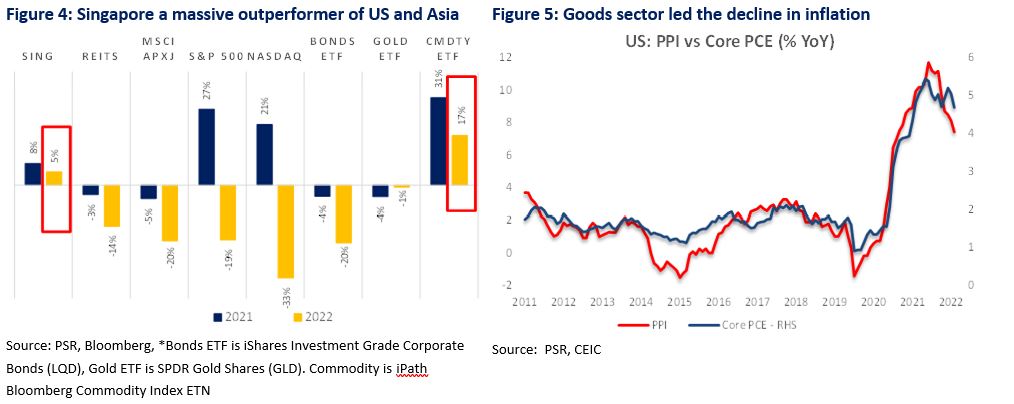
Singapore was a standout outperformer in 2022. In US dollar terms, Singapore equities were up 4.8% in 2022, (2021: +7.7%). A huge 24-25% points outperformance over US and Asia (Ex-Japan) equities (Figure 4). Banks’ performance was resilient as major beneficiaries of rising interest rates and healthy asset quality.
The sector outperformers this year were shipping with gains led by Yangzijiang Shipbuilding (+95%) and Sembcorp Marine (+68%). The upswing in oil and gas and container ship capital expenditure has driven up the order-books of shipyards. Conversely, 2022 was an awful year for REITs. Leading the decline were foreign asset base REITs Manulife US REIT (-55%), Prime US REIT (-51%) or data centres Digital Core (-53%), Keppel DC REIT (-28%).
OUTLOOK
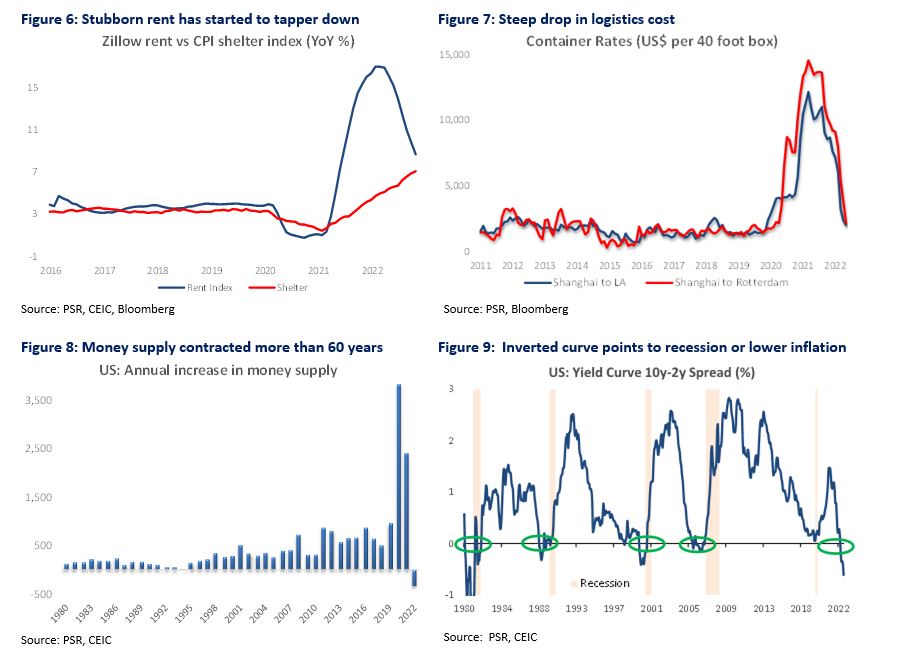
The largest pressure point for all asset types in 2022 was larger-than-expected spike in interest rates. We started the year expecting only 0.75% rise by end-2022. Instead, the Fed went for 4.25%. This decimated global equity and bond markets. The Ukraine conflict exacerbated inflation with a surge in commodity prices. The inflation trade of 2022 was long US dollar and short equities and bonds. Our strategy for 2023 is the opposite. We expect inflation to fall sharply this year. Multiple indicators point to a steeper slowdown of inflation in the US. Goods inflation is sharply down (Figure 5), key services such as rents are turning around (Figure 6), freight rates are collapsing (Figure 7), and money supply is contracting (Figure 8). Core PCE (the Fed’s favourite inflation gauge) on an annualized basis is currently 2.6%, close to the Fed’s 2% target. A recession in the US is likely. The yield curve is significantly inverted (Figure 9) and other economic indicators are slowing down. However, we expect any recession to be modest. This is because of strong employment and the absence of deflation shocks reminiscent of the mortgage debt or banking crisis of 2008. A huge deleveraging has taken place but is isolated with the US$2tr collapse in cryptocurrencies. We guess there is a limit to how much of your own (crypto) money you can print to get rich. During inflationary recessions, similar to the 1970s, nominal GDP or operating cash flows did not contract (Figure 10). They still can grow faster than interest rates due to negative real rates. Over 1970-82, when the US faced four recessions, nominal GDP growth averaged 10%. During these recessions, US corporate earnings contracted around 3% compared to the 20% for the three most recent recessions (2001, 2008/09, 2020).
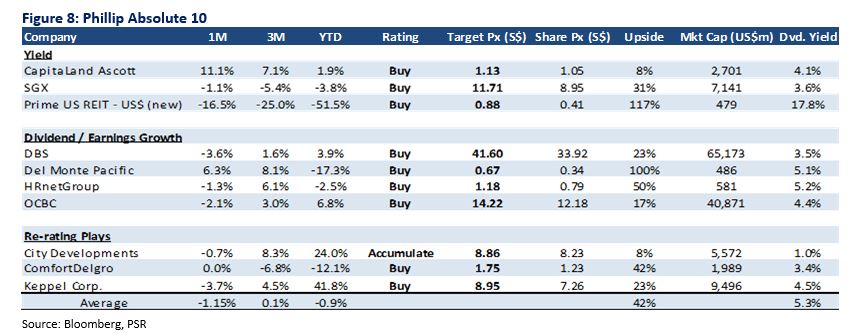
RECOMMENDATIONS FOR PHILLIP ABSOLUTE 10
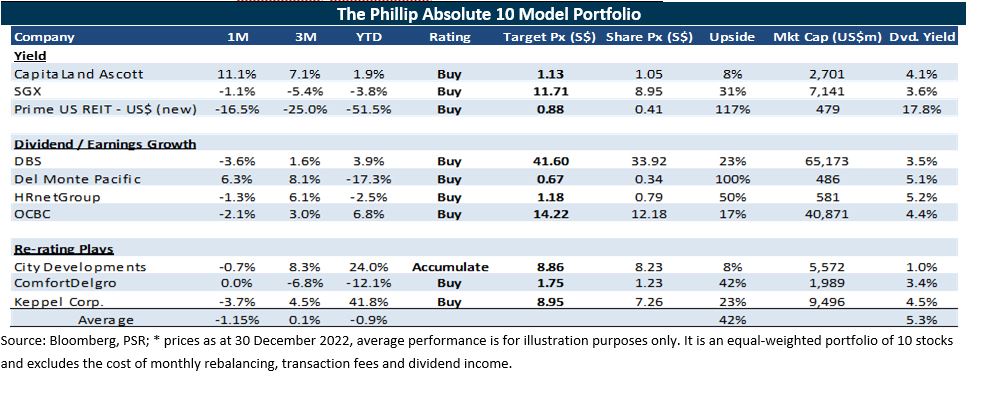
Our focus is on individual stock names to generate alpha in a balanced portfolio. Using 10 stocks for a portfolio is highly concentrated. To avoid excessive volatility in our model portfolio, we add lower beta yield names. In our 2023 model portfolio, which is reviewed every quarter, the top 10 picks – The Phillip Absolute 10 – by category are:
a) Dividend yields: CapitaLand Ascott Residence Trust dividend yield will be supported by the return of global travel, especially with the re-opening of China. Prime US REIT offers attractive valuations of 18% dividend yield and 50% discount to valuations. SGX is to hedge out huge swings in volatility. Its equity and derivatives business will thrive on volatility. Earnings will be supported by rising interest income from the S$14bn collateral it collects from customers.
b) Dividend/Earnings growth: We expect DBS and OCBC to raise dividends from record earnings and excess capital. Del Monte pays an attractive yield with healthy earnings growth. HRnetGroup has huge net cash of S$313mn and an annual operating cash flow of S$70mn to support its annual dividends of S$45mn (divided yield 5%).
c) Re-rating: CDL will ride on the recovery in its hospitality business and recognition of development profits in Singapore. ComfortDelgro’s has exited the pandemic with an even stronger balance sheet and now enjoying the volume recovery in rail and taxi ridership with price increases. Keppel Corp is enjoying a re-rating with more divestments and monetization of non-core assets, in particular the marine portfolio.
About the author

Paul Chew
Head of Research
Phillip Securities Research Pte Ltd
Paul has 20 years of experience as a fund manager and sell-side analyst. During his time as fund manager, he has managed multiple funds and mandates including capital guaranteed, dividend income, renewable energy, single country and regionally focused funds.
He graduated from Monash University and had completed both his Chartered Financial Analyst and Australian CPA programme.


About the author
Paul Chew
Head of Research
Phillip Securities Research Pte Ltd
Paul has 20 years of experience as a fund manager and sell-side analyst. During his time as fund manager, he has managed multiple funds and mandates including capital guaranteed, dividend income, renewable energy, single country and regionally focused funds.
He graduated from Monash University and had completed both his Chartered Financial Analyst and Australian CPA programme.
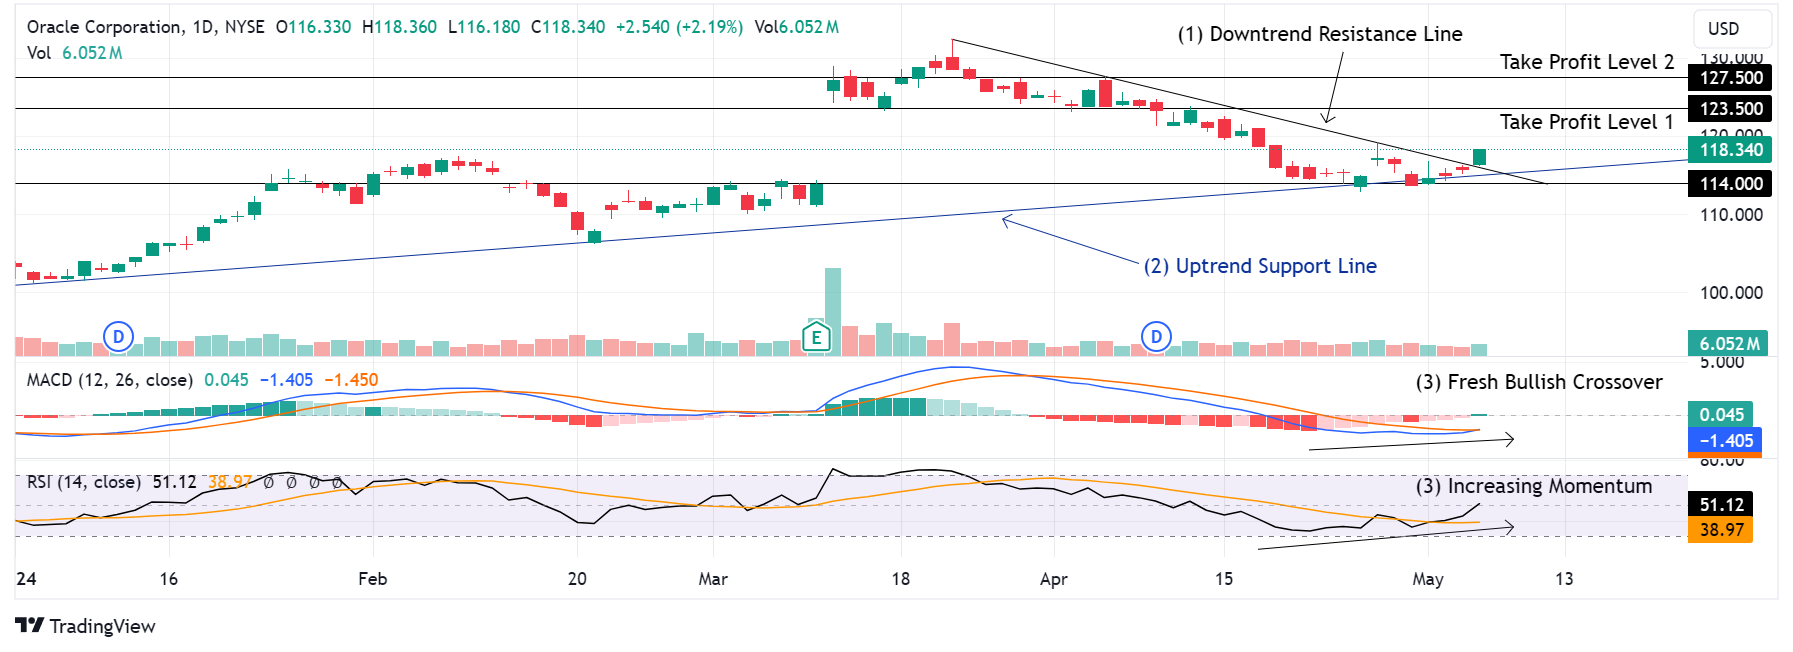 Trade of the Day - Oracle Corporation (NYSE: ORCL)
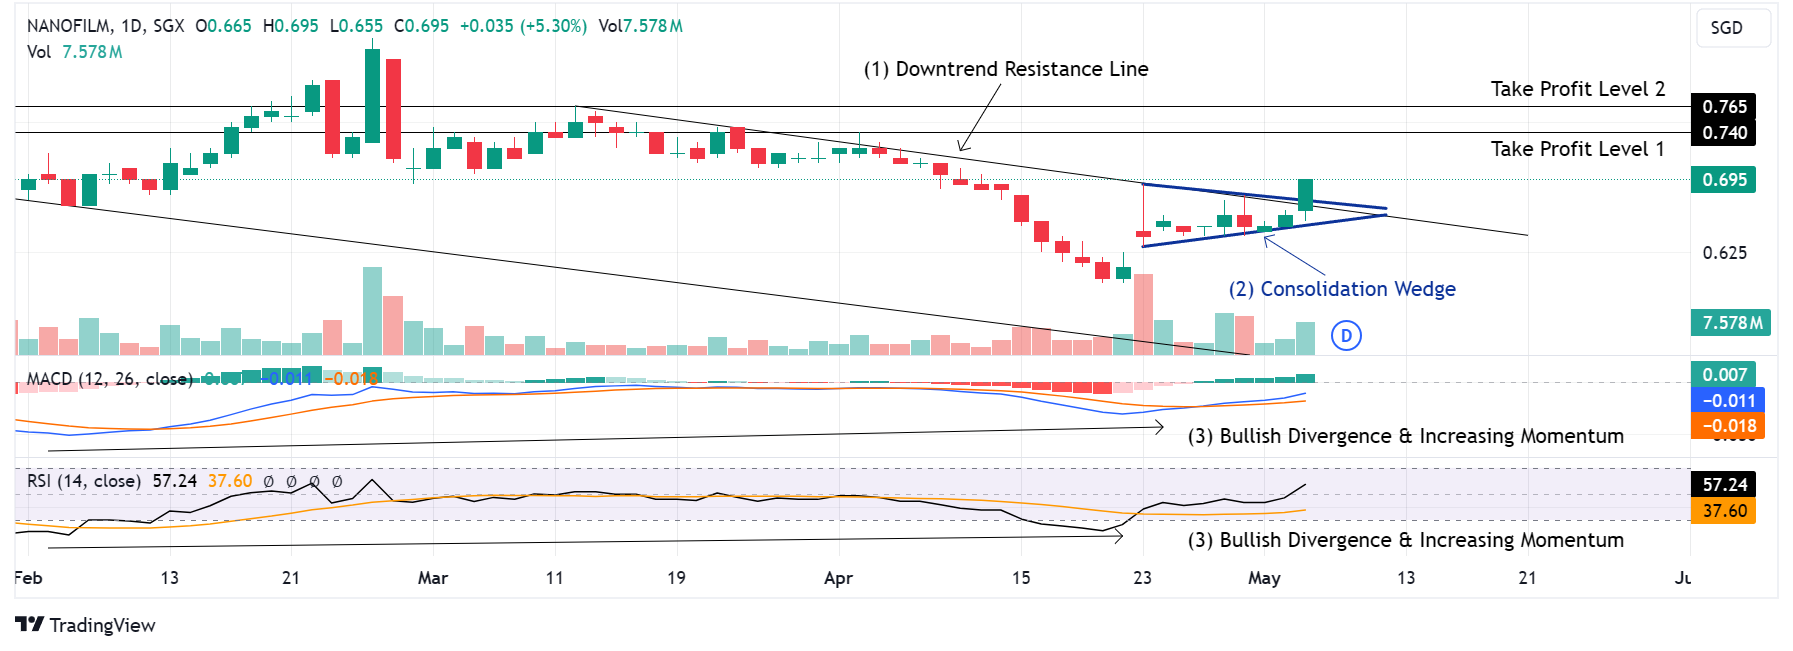 Trade of the Day - Nanofilm Technologies International Ltd (SGX: MZH)
 May 6th - Things to Know Before the Opening Bell