Go Global – Investing Around The World May 30, 2019

Part 2. How?
We hope that we have convinced you to beat your home bias in our previous article.
So you want to invest in foreign markets now. But how?
In an effort to beat my own home bias, I visited Hanoi last week with a group of friends. It was the first time anyone of us went to Vietnam. None of us spoke Vietnamese so parts of the trip in the less touristy areas proved to be a challenge. Google translate was of little help when we can’t type Vietnamese into our phones.
When we venture into foreign lands, how do we plan our travel itinerary and conduct the trip?
In the same vein, when we venture into foreign markets, how do we conduct our stock picking?
In all other situations, we adopted a universal language – point with our fingers.
So what are the universal signs driving local and foreign investment returns around the world? Among the many, we found two drivers.
In one of our previous articles, we have shown that the driver of your investment return is price paid relative to the value you are getting.
In another article, we covered market momentum and showed that rising prices tend to continue to rise and beat the market index.
Today, we retest our portfolios using common measures of value and short-term momentum and expand our coverage across various global markets.
Here are the results:
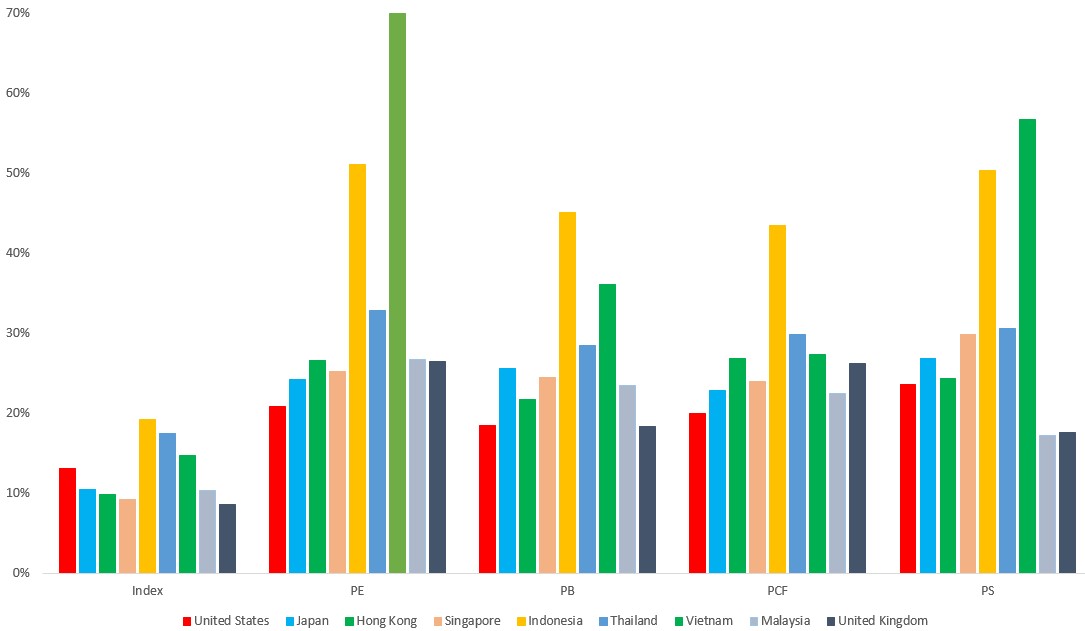
We used Price to Earnings (PE), Price to Book (PB), Price to Cash Flow (PCF) and Price to Sales (PS) as proxies of value for each of the major financial reports: Income Statement, Balance Sheet, Cash Flow Statement and Sales as a proxy of general profitability.
| Ratio | Measure Value from |
| Price to Earnings (PE) | Income Statement |
| Price to Book Value (PB) | Balance Sheet |
| Price to Operating Cash Flow (PCF) | Cash Flow Statement |
| Price to Sales (PS) | General Profitability |
All our measures of value outperform its local index when applied consistently over a period of 10 years from 2009 to 2018.
The following table and chart illustrates the annualised returns of various stock picks done continually based on a single measure of value against their respective local indices.
| Index | PE | PB | PCF | PS | |
| United States | 13.11% | 20.78% | 18.41% | 19.92% | 23.56% |
| Japan | 10.43% | 24.17% | 25.52% | 22.84% | 26.88% |
| Hong Kong | 9.80% | 26.54% | 21.69% | 26.79% | 24.29% |
| Singapore | 9.17% | 25.18% | 24.43% | 24.00% | 29.82% |
| Indonesia | 19.23% | 51.06% | 45.00% | 43.38% | 50.32% |
| Malaysia | 10.36% | 26.73% | 23.46% | 22.52% | 17.16% |
| United Kingdom | 8.55% | 26.40% | 18.35% | 26.17% | 17.61% |
| Thailand | 17.41% | 32.85% | 28.47% | 29.88% | 30.62% |
| Vietnam | 14.76% | 69.96% | 36.08% | 27.35% | 56.63% |

There is one caveat: Value underperforms the market from time to time.
Over a ten-year period from 2009 to 2018, measuring and investing via PCF in Hong Kong underperformed the Hang Seng Index in three out of the ten years.
Investing via PB in Japan underperformed the Nikkei 225 Index four out of ten years.
Investing via PS or PE in the United Kingdom and United States respectively would have underperformed the FTSE 100 and S&P 500 in five out of ten years!
However, given a long enough investment horizon, the winning years vastly outperform the losing ones and your returns are more than likely to be sweet. During these turbulent times, take comfort in the fact that the fundamentals are in your favour. Buckle up, sit tight and enjoy the ride.
If reading statements are too much work, then you can:
What goes up will continue to go up. The reverse is true and that what has been falling will likely continue to fall.
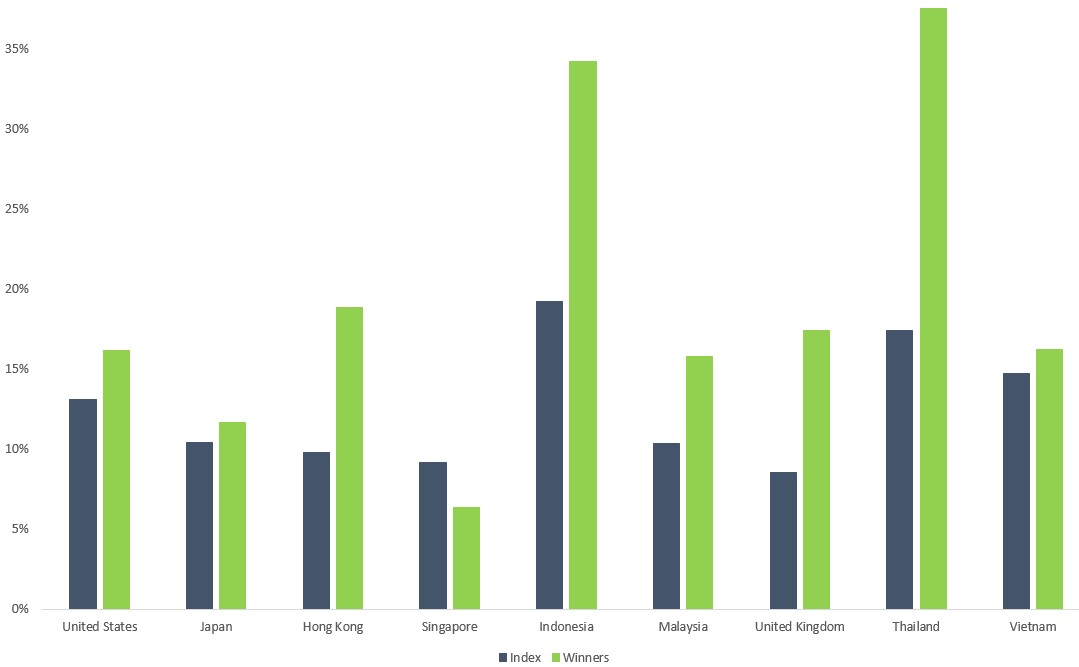
We define momentum as the performance of the stock returns in the preceding 6 months and term winners are those who have outperformed 90% of its respective stock exchange.
| Group | Definition |
| Winners | 6 months returns exceeding 90% of its peers |
The trick here is to purchase the group of winners and hold on to them for the next three months.
Just following this strategy blindly produced the following annualised returns over a period of 10 years from 2009 to 2018. Imagine what market technicians could have done when leverage and risk management methods are applied.
Momentum can be found almost everywhere and works especially well in Hong Kong, Indonesia, Malaysia, the United Kingdom and Thailand!
| Index | Winners | |
| United States | 13.11% | 16.15% |
| Japan | 10.43% | 11.71% |
| Hong Kong | 9.80% | 18.88% |
| Singapore | 9.17% | 6.38% |
| Indonesia | 19.23% | 34.21% |
| Malaysia | 10.36% | 15.80% |
| United Kingdom | 8.55% | 17.41% |
| Thailand | 17.41% | 37.53% |
| Vietnam | 14.76% | 16.23% |

And finally, we find that a recurring theme presents itself among the tests:
Whether we are talking about unmanaged indices or managed strategies presented above, returns from the developing markets are higher than those of the developed markets.
If we were to attribute excess returns due to stock picking strategies (value or momentum), the alpha captured in the developing markets are also much higher.
The reason for this, we believe, is that inefficiency exists in the developing market. That means good news for you as an individual investor or trader as it presents many more trading opportunities.
Developed markets may be crowded when many more participants pursue similar strategies, especially in the US, and this chips away at the returns.
| Ave Return of Index | Ave Return of Strategies | Alpha | ||
|---|---|---|---|---|
| Developed | United States | 10.21% | 21.76% | 11.54% |
| Japan | ||||
| Hong Kong | ||||
| Singapore | ||||
| United Kingdom | ||||
| Developing | Indonesia | 15.44% | 34.76% | 19.32% |
| Malaysia | ||||
| Thailand | ||||
| Vietnam | ||||
Being a foreigner is a matter of perspective.
From a Vietnamese point of view, Hanoi and Ho Chi Minh Stock Exchanges are their go-to when dabbling in stocks. To them, Singaporeans and the Singapore Stock Exchange ARE the foreigners.
Take a step back and have an objective look at markets:
Their markets are like ours and follow rules.
There is nothing foreign, just unfamiliarity.
The internet has made the world a smaller place. Why limit yourself and let non-factors stop you in beating your home bias?
We don’t even need to learn a new language like Japanese or Thai to trade the Tokyo or Thailand Stock Exchange!
Disclaimer
All data presented are from Phillip CFD and accurate as of end February 2019. All foreign indices are represented in their respective local currencies.
These commentaries are intended for general circulation. It does not have regard to the specific investment objectives, financial situation and particular needs of any person who may receive this document. Accordingly, no warranty whatsoever is given and no liability whatsoever is accepted for any loss arising whether directly or indirectly as a result of any person acting based on this information. Opinions expressed in these commentaries are subject to change without notice. Investments are subject to investment risks including the possible loss of the principal amount invested. The value of the units and the income from them may fall as well as rise. Past performance figures as well as any projection or forecast used in these commentaries are not necessarily indicative of future or likely performance. Phillip Securities Pte Ltd (PSPL), its directors, connected persons or employees may from time to time have an interest in the financial instruments mentioned in these commentaries. Investors may wish to seek advice from a financial adviser before investing. In the event that investors choose not to seek advice from a financial adviser, they should consider whether the investment is suitable for them.
The information contained in these commentaries has been obtained from public sources which PSPL has no reason to believe are unreliable and any analysis, forecasts, projections, expectations and opinions (collectively the “Research”) contained in these commentaries are based on such information and are expressions of belief only. PSPL has not verified this information and no representation or warranty, express or implied, is made that such information or Research is accurate, complete or verified or should be relied upon as such. Any such information or Research contained in these commentaries are subject to change, and PSPL shall not have any responsibility to maintain the information or Research made available or to supply any corrections, updates or releases in connection therewith. In no event will PSPL be liable for any special, indirect, incidental or consequential damages which may be incurred from the use of the information or Research made available, even if it has been advised of the possibility of such damages. The companies and their employees mentioned in these commentaries cannot be held liable for any errors, inaccuracies and/or omissions howsoever caused. Any opinion or advice herein is made on a general basis and is subject to change without notice. The information provided in these commentaries may contain optimistic statements regarding future events or future financial performance of countries, markets or companies. You must make your own financial assessment of the relevance, accuracy and adequacy of the information provided in these commentaries.
Views and any strategies described in these commentaries may not be suitable for all investors. Opinions expressed herein may differ from the opinions expressed by other units of PSPL or its connected persons and associates. Any reference to or discussion of investment products or commodities in these commentaries is purely for illustrative purposes only and must not be construed as a recommendation, an offer or solicitation for the subscription, purchase or sale of the investment products or commodities mentioned.
About the author
Tan Chek Ann
Senior Dealer
I sleep in the day and head the dealing desk at night.
In my nightly work, I attempt to do analysis, revolving around portfolio construction, long/short strategies, responsible leveraging and factors research.
Join me on my journey as I share my thoughts on various topics – though mostly still financial stuff.Reach me at tanca@phillip.com.sg.

 Back in Business: The Return of IPOs & Top Traded Counters in March 2024
  From $50 to $100: Unveiling the Impact of Inflation
  How to soar higher with Positive Carry!
  Why 2024 Offers A Small Window of Opportunity and How to Position Yourself to Capture It


