Is it worth looking at the 3 Singapore Banks right now? April 23, 2020

“The Chinese use two brush strokes to write the word “crisis”. One brush stroke stands for danger, the other opportunity. In a crisis, be aware of the danger, but recognise the opportunity.”
John F Kennedy 35th President of the United States
Investors have been experiencing considerable distress over the past few months with financial markets reacting to COVID-19 pandemic news and sentiments. The oil price war, and the rise of COVID-19 cases in the United States resulted in volatility levels and the CBOE Volatility Index (VIX) rising to similar levels as the 2008 Global Financial Crisis.

VIX displaying volatility levels similar to the 2008 Global Financial Crisis
Faced with growing concerns of a global economic slowdown, the Federal Reserve cut the Fed Fund interest rate on March 15 2020 to 0-0.25%. The only time when the Fed rate reached 0-0.25% was during the 2008 Global Financial Crisis. Shortly after, SIBOR (Singapore Interbank Offered Rates) followed suit and decreased its interest rates.

SIBOR 3m rate and the US Federal Funds Rate
According to the International Monetary Fund (IMF), the COVID-19 pandemic will bring about a global recession in 2020. This predicted recession could be worse than the 2008 Global Financial Crisis. However, the silver lining according to IMF is that the world economic output could likely recover by 2021.[1]
So, will our Singapore Banks survive this recession? Let’s find out!
Bank Stock Fundamentals 101
By normal convention, companies sell a service or product to its customers. Customers pay them for their products and services and the company records the money received as revenue.
Banks on the other hand, generate the bulk of their revenue by fulfilling 2 specific needs:
1) Storing deposits for its customers (Deposits)
2) Lending money to customers (Loans)
Banks make money on the interest rate spread, which is the difference between the interest rate on loans (Interest Earned) and the interest rate on deposits (Interest paid).
The metric used to track this difference is known as the Net Interest Income, which can be defined as:
Interest Income – Interest Expense
Profitability
As banks derive the bulk of their financial performance from their assets, the profitability of a bank can be measured using the Net Interest Margin ratio. It can be defined as:
The higher the NIM, the more profitable the bank is.
Financial Stability
The other difference between conventional companies is that banks have a high level of systemic importance. Their smooth functioning is crucial for the overall economy. If a large or public bank were to default, there would be catastrophic effects upon the entire economy. Therefore, banks will be highly regulated. The international regulatory framework for banks is known as the Basel III. The Basel III framework is an internationally agreed set of measures for financial stability. It was developed in response to the aftermath of the Global Financial Crisis of 2007-2009. [2] The Basel III Framework requires banks to maintain a minimum amount of capital for financial stability. These requirements however, may constrain their growth potential.
The 2 main metrics that one can use to track the financial stability of a bank is the capital adequacy ratio (CAR) and the Non-Performing Loan Ratio (NPL). Under Basel III, the minimum CAR ratio that banks must maintain is 8%.
Tier 1 Capital can be viewed as the primary funding source/ core funding source of the bank. Tier 2 capital on the other hand is the secondary component of bank capital.
The CAR ratio can be calculated as:
(Tier 1 Capital + Tier 2 Capital) / Risk weighted Assets
The NPL ratio can be calculated as:
Non-Performing Loans / Total Loans
It is also crucial to break down the loan book of a bank by industries and by geographical locations. This breakdown will give you insights on the sectors and regions the bank is most exposed to.
Dividend Payout
Banking stocks are often perceived as stable long-term investments held for their dividends and long-term capital gains. Therefore, it is important to analyse whether the banks can pay out their dividends in a sustainable manner.
A company needs cash to be able to pay out dividends to its shareholders. Free cash flow is a common metric to measure the sustainability of a company’s dividends.
Free cash flow can be defined as:
Capex is defined as capital expenditure, which is the amount that companies need to maintain their fixed assets. Generally speaking, manufacturing or property development counters will have a higher CapEX. For banks, CapEx is usually relatively small and does not represent reinvestment into the business. Therefore, the Payout Ratio would be a better metric for assessing bank dividend sustainability.
Dividend payout can be assessed by using the Payout Ratio can be defined as:
Generally speaking, the lower the company’s pay-out ratio, the better it would be as this could mean that the company could raise its dividends going forward. One has to be wary if the payout ratio is above 100%, as this could mean that the company’s dividends may be unsustainable in the long run going forward. Consistent pay-out ratio over time is the key!
Besides analysing the pay-out ratio, one must also analyse the bank’s financial stability as the bank’s capital requirements are a function of whether the given bank will be able to pay/grow their dividends.
Analysis of the 3 Singaporean Banks
“The fundamental basis of above average performance in the long run is sustainable competitive advantage”
Warren Buffett
At the height of the World Financial Crisis in 2008, there were bank runs worldwide. Bank depositors were fearing that they would not be able to withdraw their deposits from the banks. Consequences would have been catastrophic if there was a bank run in Singapore, a country who prides herself as a global financial hub.
During the turbulent period then, Singapore’s Former President S R Nathan approved of the provision of $150 Billion from the Government’s past reserves to guarantee the bank deposits of Singapore from October 2008 to December 2010. [3] The Singapore Government acting as the implicit backstop to the banks helped calm depositors in Singapore. In our opinion, having a stable governing body acting as the implicit backstop coupled with the strict regulations by MAS is the competitive advantage of the Singapore banks.
According to New York trade publication Global Finance, Singapore banks DBS, OCBC and UOB maintained their top 3 positions as Asia’s safest banks again in 2019. The 3 local banks also made it to the Global Top 50 list of the World’s safest banks. For the end of 2018, DBS came in 15th, OCBC came in 16th, while UOB came in 18th. [4]
Qualitative factors aside, let us use the metrics found from the above section to measure how the Singapore banks stack up!


From the data above, OCBC bank has the greatest exposure to China while DBS is most exposed to Singapore.
In terms of financial stability, the 3 banks maintained a Capital Adequacy Ratio (CAR) way above 8%, which is the minimum CAR ratio determined by the Basel III framework. Non-performing loans as a percentage of the total loan book were consistently below the 2% range (except for DBS and UOB in 2009).
In terms of dividend sustainability, we can see that both their EPS and DPS have been increasing year-on-year. Payout ratios for the banks ranged on an average of 45%. DBS bank’s payout ratio amounted to 0.847 in 2017 due to a one-time payment of special dividends. Based on the financial stability and payout ratios, we can conclude that the 3 Singapore Banks have had a consistent track record of increasing dividend payouts at a sustainable rate.
Consistent growth in dividends and financial stability are signs of a stable business model, prudent capital management and good corporate governance.
Singapore Bank Valuations
Price-to-Book (PB) ratio is a popular valuation metric used on asset-heavy sectors such as REITs, banks and insurance companies. PB ratio of 1 indicates that the company is fairly valued while PB ratio below 1 indicates that the company’s share price is trading at a discount with respect to its equity book value.
In our opinion, one cannot just simply take PB ratio below 1 to indicate “cheapness”. Stocks may constantly trade below their book value for a myriad of reasons, they may be faced with corporate governance issues or faced with structural decline. What if the counter constantly trades below its book value? To get a more complete picture of the company’s valuation, one has to compare the current PB ratio with respect to time and with its average trading price to book value.
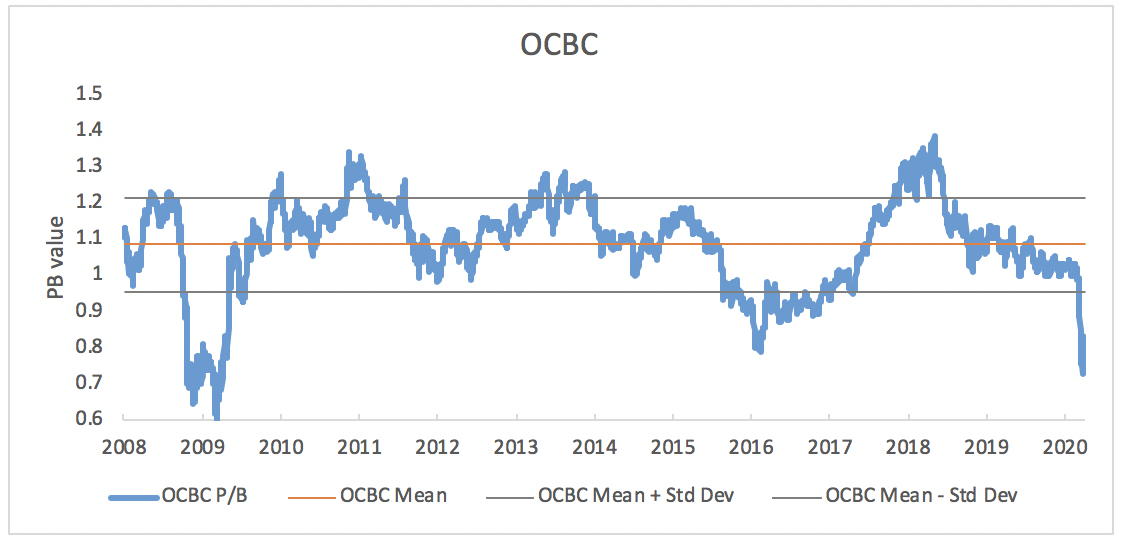
We plotted the average PB ratio for the 3 local Singaporean banks from 2008 to end March 2020 alongside their +1 and -1 standard deviations. As we can see in terms of price-to-book value, UOB and OCBC bank is trading below their -1 standard deviation range. However, bank valuations have not reached the same levels as the Global Financial Crisis in 2008-2009.
During this turbulent period, many countries have implemented mobility and crowd control measures to curb the spread of the Covid-19 pandemic. This will inevitably affect many businesses and result in rising unemployment rates. Therefore, the banking sector is expected to be impacted.
We personally feel that the future is uncertain and it is very difficult to find the evasive market bottom. If one believes that the information factored into certain counters affected is temporary and reflects something shorter than his holding period, it may be wise to long and value cost average into these respective counters with strong balance sheets and free cash flow stability.


Hedge your Portfolio against rising uncertainty with CFDs!
“The Markets generally are unpredictable, so that one has to have different scenarios. The idea that you can actually predict what’s going to happen contradicts my way of looking at the Market”
~ George Soros
Contrary to popular opinion, Contracts for Differences (CFDs) are not just for technical traders. Long term investors can utilise CFDs to hedge their positions against unforeseen events and uncertainties. When one foresees rising uncertainty and volatility in the market, the investor can enter into a CFD contract to hedge their positions.
One can use CFDs as a hedge in the following two possible scenarios:
1) When the price of your existing positions has already moved/is moving against you.
2) When you anticipate future gains in your existing positions to be marginal due to an increasingly negative market sentiment.
CFD Hedging
In this example, we will show you how you can use CFDs to hedge your banking equity exposure. Before one hedges his banking equity exposure, he/she will need to determine the asset to utilise for the hedge.

Correlation Matrix (DBS, UOB, OCBC, STI Index, Gold (Spot))
Taking data from 2010 to 2020, I plotted the correlation matrix between the 3 local banks, STI index and Gold. As we can observe from the data, the prices of 3 banks are highly correlated with each other and to the Straits Times Index. Generally speaking, assets that have a positive correlation to your positions are used as an opposing hedge (Short). Whereas, assets with a negative correlation to your positions are used as a same side hedge (Long).
The 3 Singaporean banks have a high weightage in the Straits Times Index. A practical hedging tool to use for the 3 Singapore banks would be the Straits Times Index CFD. This will allow you to save on initial capital outlay and commission charges. The Straits Time Index CFD has an initial margin of 5%.
Phillip Securities is the only broker that offers Straits Times Index SGD5 CFD for trading.
CFD Hedging Example
Mike owns 1000 shares of DBS and UOB at an average price of $24.93 and $25.40 respectively. His portfolio value amounts to $50330. However due to the recent market volatility, the prices came tumbling down soon after.
If Mike had decided to cut loss for both his banking stocks on 20/3/2020, his losses would be:
DBS Losses = ($18.16 – $24.93) * 1000 = $6770
UOB Losses = ($18.96 – $25.40) * 1000 = $6440
DBS Commission = (24930 * 0.28%) + (18160 * 0.28%) = $69.81 ($74.70 with GST) + $50.85 ($54.41 with GST)
UOB Commission = (25400 * 0.28%) + (18960 * 0.28%) = $71.12 ($76.10 with GST) + $53.09 ($56.81 with GST)
Net Loss = $6,770 + $74.70 + $54.41 + $6,440 + $76.10 + $56.81 = $13472.02
Assuming that on 25/02/2020, after reading the financial news, Mike anticipates a change in market conditions. By utilising CFDs, Mike decided to hedge his position. He could have used either DBS, UOB, OCBC or the Straits Times Index CFD to perform an opposing hedge. However, using the Straits Times Index CFD to perform the hedge would allow Mike to save on commission charges and on initial capital outlay.
Mike decides to use the Straits Times Index CFD to hedge his exposure. As his portfolio amounted to $50330 on that day and the Straits Times Index SGD5 CFD was trading at $3159.5, he would need approximately 3 contracts to perform a partial hedge.
$50330 / ($3159.5 * 5) = 3.18
Given 6% margin, Mike’s Initial Capital outlay for the Straits Times Index SGD5 CFD would have been:
$3159.5 * 5 * 3 * 6% = $2843.55
On 20/3/2020, the Straits Times Index SGD5 CFD was trading at $2429.6. His overall position on 20/3/2020 would have been:
Straits Time Index SGD5 CFD Gain: ($3159.5 – $2429.6)*5*3 = $10948.5
Straits Times Index Sell Commission = $3 * 3 = $9 ($9.63 with GST)
Short finance charge for holding the STI Index CFD from 25/02/2020 to 20/03/2020 with a daily closing price of 3159.5:
Short FC = 2.75% / 365 * 24 * (3159.5 * 5 * 3) = $85.70
DBS Losses = ($18.16 – $24.93) * 1000 = $6770
UOB Losses = ($18.96 – $25.40) * 1000 = $6440
DBS Buy Commission = (24930 * 0.28%) = $69.81 ($74.70 with GST)
UOB Buy Commission = (25400 * 0.28%) = $71.12 ($76.10 with GST)
Net Loss = $10948.5 – $6770 – $6440 – $74.70 -$76.10 – $85.70 – $9.63 = – $2507.63 (much lower than $13472.02 without hedging)
This scenario is ideal for people seeking capital preservation for their nest egg as opposed to high frequency trading or speculation.
Conclusion
Thank you for sticking with us throughout this lengthy read! We sincerely hope that after reading this article, you will gain a better understanding of the 3 local banks and how CFDs can be used for hedging. If you have any questions on trading or investing, feel free to drop us an email at cfd@phillip.com.sg and we will be glad to assist you. There are also FREE CFD seminars that you can attend to learn more about this derivative product!
Till next time folks!
References:
- [1] https://www.straitstimes.com/business/economy/imf-sees-coronavirus-pandemic-causing-global-recession-in-2020-recovery-in-2021
- [2] https://www.bis.org/bcbs/basel3.htm
- [3] https://www.channelnewsasia.com/news/singapore/if-situation-deteriorates-significantly-due-to-covid-19-dpm-heng-12480226
- [4] https://www.gfmag.com/magazine/november-2019/worlds-safest-banks-2019
About the author
Jay Lin and Tan Kean Soon
Dealer
Jay graduated from the National University of Singapore with a Bachelor’s Degree in Electrical Engineering, specialising in Power Engineering. He is also an aspiring CFA Charter Holder.
In his free time, he loves to analyse and experiment with factor based investing and smart beta portfolio’s using machine learning.
Kean Soon graduated from National University of Singapore with Bachelor's Degree in Materials Engineering. He is a passionate CFD dealer who believes that equity markets can help grow one's wealth with the right mindset, risk management & discipline.In his free time, he enjoys learning and experimenting with long-term investment and short-term trading ideas as well as following the latest market news to get in touch with market reality.

 Back in Business: The Return of IPOs & Top Traded Counters in March 2024
  From $50 to $100: Unveiling the Impact of Inflation
  How to soar higher with Positive Carry!
  Why 2024 Offers A Small Window of Opportunity and How to Position Yourself to Capture It


