The Rise of AI – Top traded AI counters in February 2024 March 18, 2024
Start trading on POEMS! Open a free account here!
At a glance:
- Record highs for major indices
- Rally powered by NVDA’s impressive earnings
- Numerous Fed officials cautioned against premature rate cuts
| NASDAQ | DOW JONES | S&P 500 | |
| Month Open | 15,254.02 | 38,175.34 | 4,861.11 | Month Close | 16,091.92 | 38,996.39 | 5,096.27 | Monthly return | 5.49% | 2.15% | 4.84% | Record High (23rd Feb) | 16,134.22 | 39,282.28 | 5,111.06 |
The NASDAQ, DOW JONES and S&P 500 all closed the month near record highs, with each experiencing a surge of over 45% on average from their market lows in October 2022. The S&P 500 notably breached the significant 5,000 level on 9 February 2024 and has remained above it since. Additionally, February also marks the fourth consecutive month of gains for all three indices.
February has seen significant advancements in the field of AI, ranging from OpenAI CEO Sam Altman advocating for a US$7 trillion investment to reshape the global AI landscape1 to key AI companies surpassing earnings expectations. Notably, Nvidia (NVDA.US) played a crucial role by announcing earnings that fueled a substantial market rally which saw three primary indices S&P 500, the Nasdaq Composite and the Dow Jones Industrial Average each rising by 2.1%, 3% and 1.2% respectively2. This positive development came after a series of disappointing economic data which had subdued an overly extended market in the days leading up to the earnings release.
The market rally, led by Big Tech, is now extending to smaller firms. Despite their current lagging performance, there is historical expectation of a mean reversion over the long term, suggesting that smaller firms could outpace the performance of Big Tech in the upcoming months.
The Federal Reserve’s (Fed) minutes from January leaned towards a hawkish stance, acknowledging the success of its policy actions in reducing inflation from decade highs. While suggesting that rate hikes are likely concluded, the minutes also reinforced the Fed’s position of withholding rate cuts until there is greater confidence that inflation poses no threat and is in decline.3
In line with the minutes, various economic data released in February pointed to a reflation risk which most notably is the inflation figures which came in hotter than expected at 3.1% vs 2.9% expected YoY, thereby increasing the odds of a reflation risk.4
With the higher probability of a rate cut in 2024, and the stimulus injected by the Chinese government, here are some ETFs for your consideration:
Global X Robotics & Artificial Intelligence ETF (NASDAQ: BOTZ.US)
The Global X Robotics & Artificial Intelligence ETF (BOTZ) aims to harness the potential of the rapidly growing robotics and artificial intelligence sectors. It strategically invests in companies that are at the forefront of industrial robotics, automation, non-industrial robots and autonomous vehicles. This ETF is ideal for investors looking to gain diversified exposure in the AI field without specific sector specifications.
The fund’s portfolio comprises 44 holdings, with the top 5 accounting for 47% of the fund’s assets.5 Notably, two of these top holdings are well-known players in the AI sector; namely Nvidia (NVDA.US) and Intuitive Surgical (ISRG.US), both benefiting from the positive trends in artificial intelligence.
BOTZ opened at US$28.83 and rose 8.15% to close at US$31.18 in February.
Technical Analysis
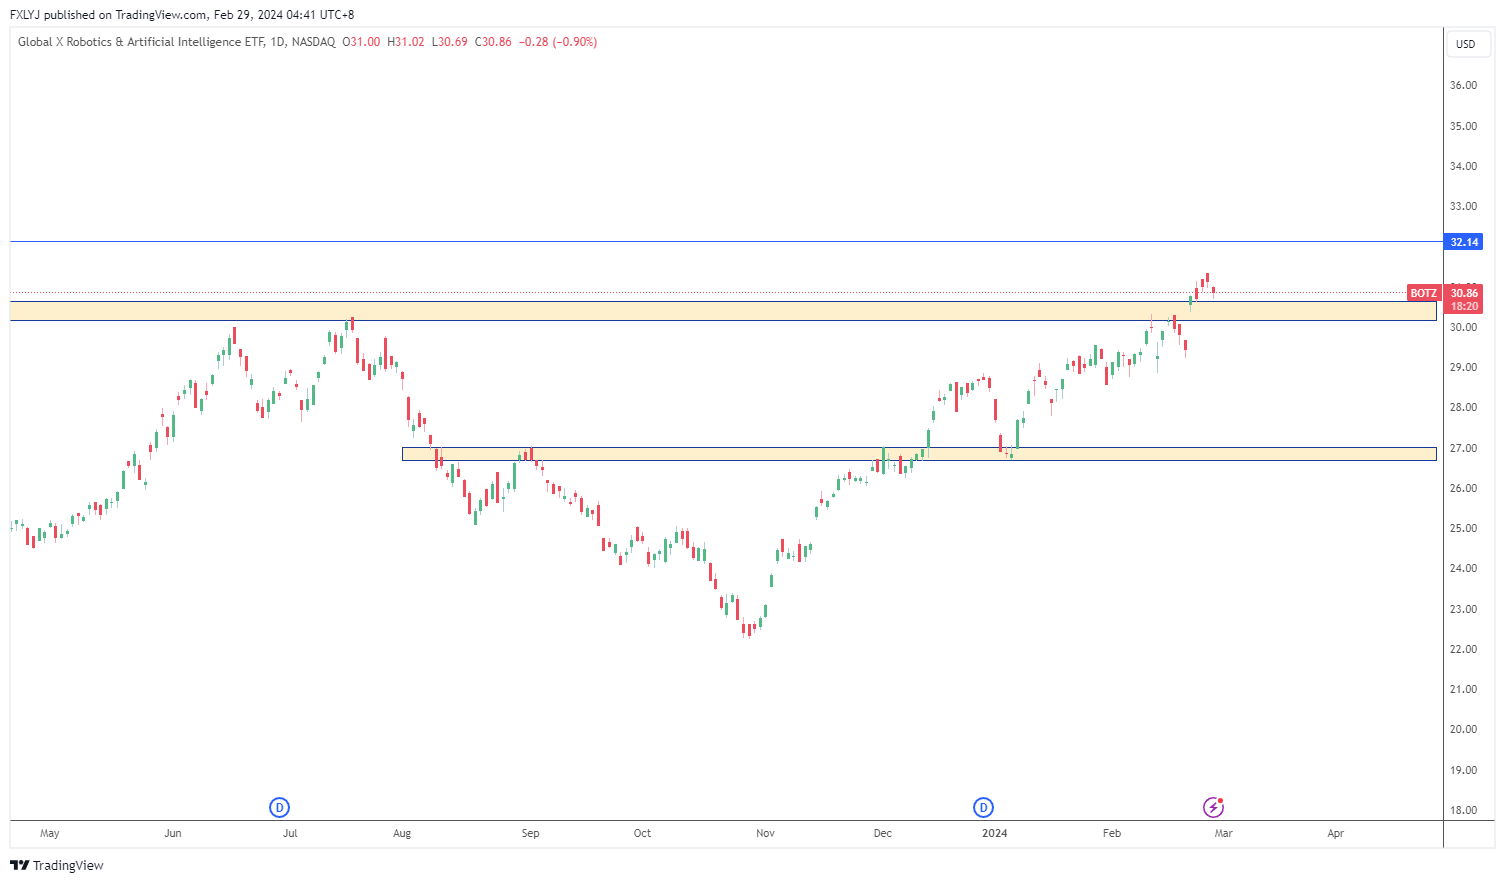
Status: Neutral
Support: US$30.00 – US$30.50
Resistance: US$32.15
Price broke from the previous range area with price rejecting off the immediate support zone. Price will have to sustain above US$30.50 for further upside, otherwise, we should see price targeting immediate support again.
iShares Robotics and Artificial Intelligence (NASDAQ: IRBO.US)
IRBO seeks to replicate the performance of an index comprising both developed and emerging market companies poised to capitalise on long-term opportunities in robotics and AI. This may be more well-suited for investors looking to acquire exposure to the AI sector with a bias towards emerging markets.
With a portfolio of 118 holdings, the fund demonstrates extensive diversification, ensuring that no single stock represents more than 2% of the fund’s assets. This diversified approach exposes investors to a range of fast-growing small-cap companies within the fund’s holdings.
IRBO opened at US$32.64 and rose 4.23% to close at US$34.02 in February.
Technical Analysis
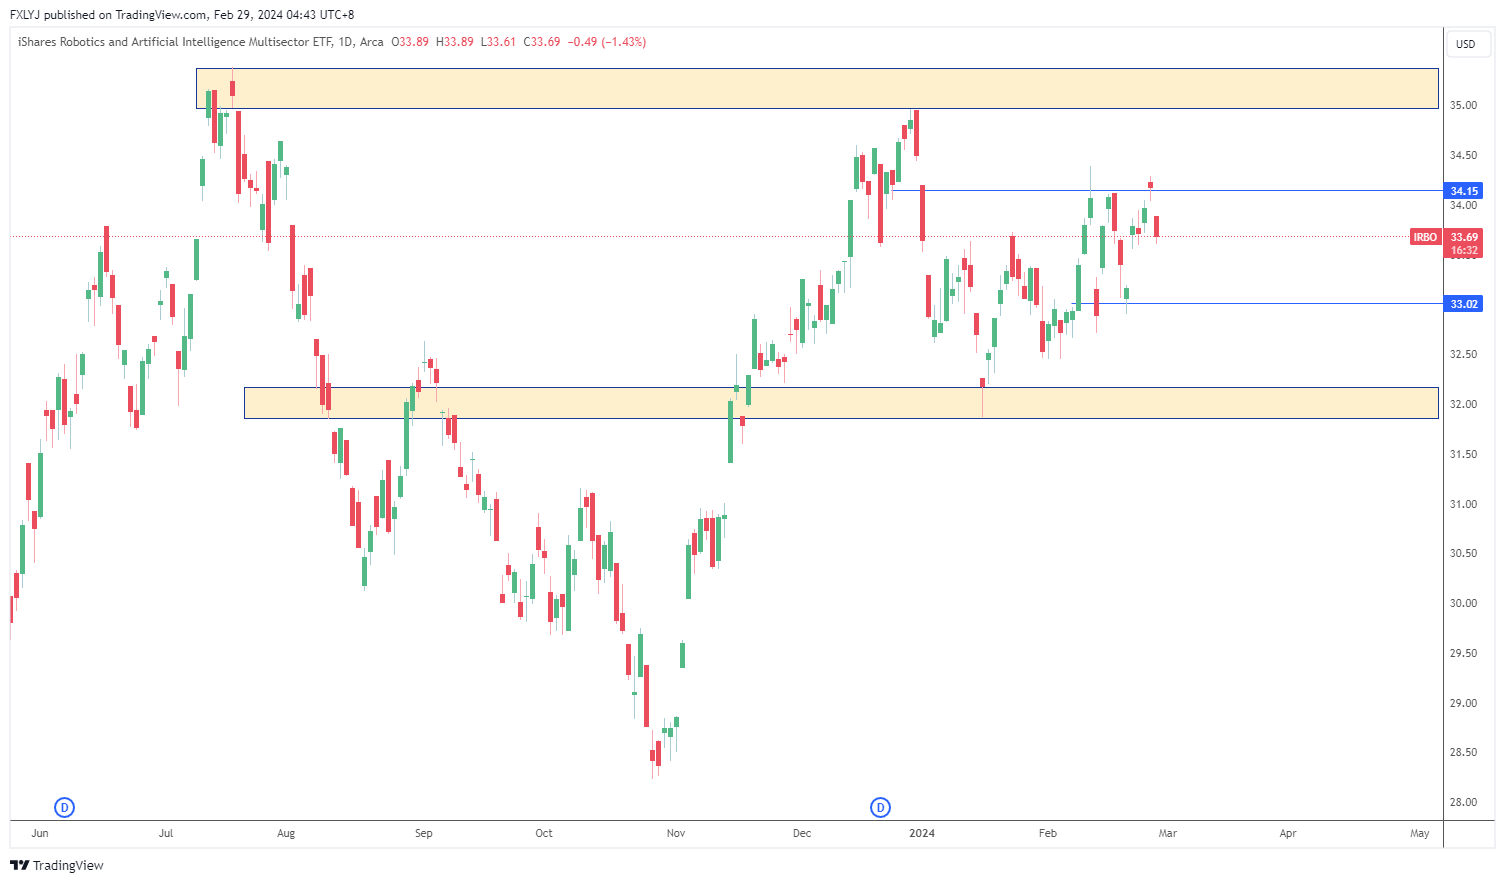
Status: Neutral
Support: US$32.70 – US$33.00
Resistance: US$34.15 – US$34.20
VanEck Semiconductor ETF (NASDAQ: SMH.US)
SMH aims to mirror the performance of the 25 largest US-listed companies involved in semiconductor production, a critical element in modern computing. The fund specifies a maximum allocation of 20% of its total assets to any single holding. This makes it an ideal choice for investors seeking to capitalise on the bullish trend in semiconductor stocks driven by the surge in demand associated with the AI boom.
Given the recent upswing in chip stocks driven by the AI boom, hardware stocks are poised to experience significant gains in the initial phase of this boom. One effective method to gain exposure to this trend is by investing in a fund that tracks the performance of chip stocks.
SMH opened at US$186.73 and 13.5% to close at US$211.95 in February.
Technical analysis
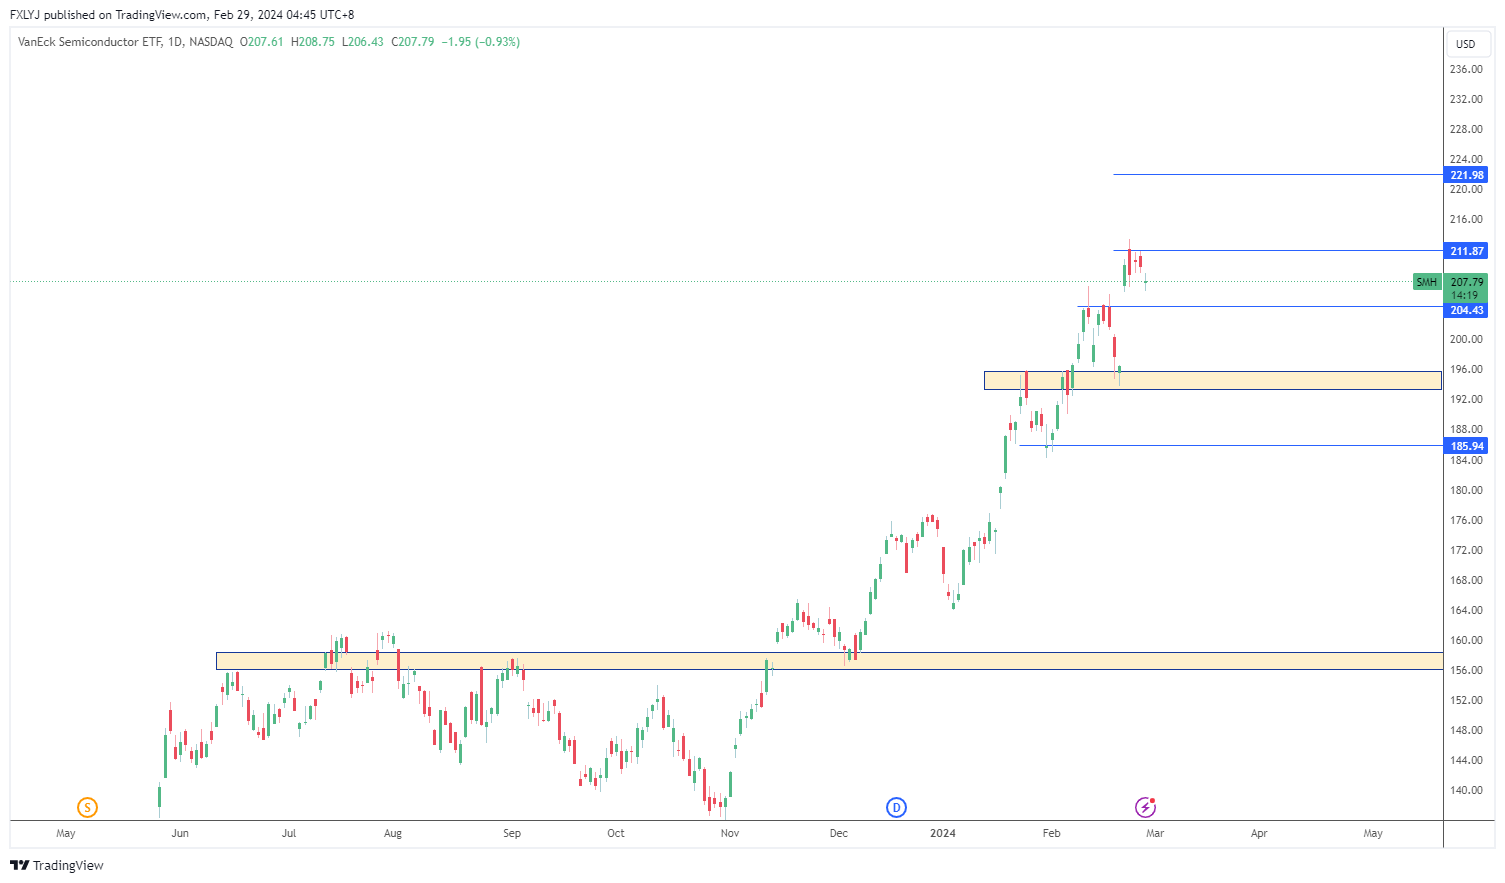
Status: Bullish
Support: US$192.00 – US$196.00
Resistance: US$211.85 – US$212.00
Bullish momentum is still in play, however will need a price to continue sustaining above 196.00 for further upside. The psychological level for the next target price will be 222.00 once they break and hold above 212.
Investors interested in gaining exposure to AI stocks without directly purchasing individual AI-related securities can explore ETFs that closely replicate the performance of such stocks.
Here are some of the more popular US stocks with AI focused – not ranked in any order – traded by POEMS customers in February.
Nvidia Corp (NASDAQ: NVDA)
In February, Nvidia (NVDA) delivered an exceptional earnings report for Q4 2023, outperforming consensus forecasts and providing optimistic guidance that the current quarter’s revenue would exceed expectations. This result exceeded the already high expectations for significant growth, triggering a surge of over 10% in the stock’s price during after-hours trading following the earnings release.
Earnings per share exceeded expectations at US$5.16 compared to the anticipated US$4.64, and revenue reached US$22.10 billion, surpassing the expected US$20.62 billion. Notably, this marks the third consecutive quarter in which NVDA has achieved revenue growth of over 200%. NVDA’s robust performance is indicative of the burgeoning era of artificial intelligence.6
As a leading beneficiary of the recent AI boom, NVDA has played an integral role, with the industry heavily dependent on the company’s advanced graphics processors for servers. Following the earnings announcement, NVDA saw an almost 20% increase, reflecting a wider market rally with chip stocks leading the gains.
NVDA opened at US$621 and rose 27.4% to close at US$791.12 in February.
According to a Phillip Securities Research report on 23 February 2024, the recommendation for NVDA is Buy.
Technical analysis
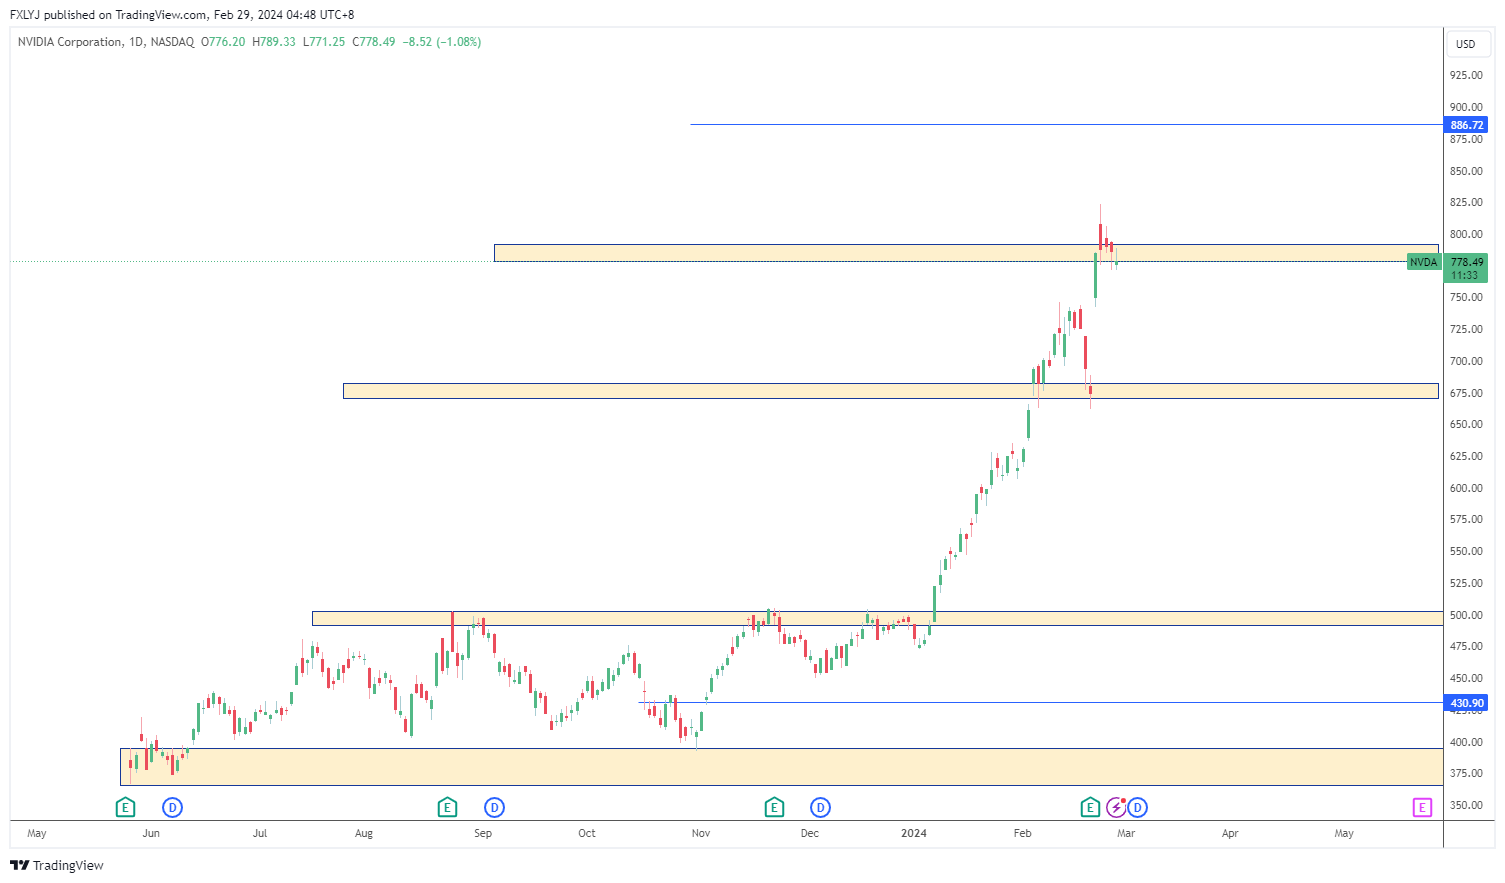
Status: Neutral
Support: US$675.00 – $US680.00
Resistance: US$815.00 – US$820.00
The price has reached unprecedented levels. It would be prudent to await a retracement towards US$675.00. Should the price maintain above this threshold, a new higher low could be established, potentially signalling further upward momentum.
Super Micro Computer Inc (NASDAQ: SMCI)
This relatively obscure stock, unnoticed until January, has experienced extraordinary gains that overshadow the performance of NVDA. Starting the year at US$280, SMCI soared to a record high of US$1077 by 16 February 2024, marking an impressive increase of almost 300% in just 45 days.
This company specialises in designing, developing, manufacturing, and selling server solutions based on modular and open-standard architecture. It offers server management software and storage systems across various markets, including enterprise data centres, cloud computing, AI, 5G, and edge computing.
Fueled by the AI tailwind that similarly propelled industry leader NVDA, SMCI has garnered significant attention, with many analysts initiating coverage and maintaining overweight recommendations even after the substantial gains.
Nevertheless, caution is advised for investors considering SMCI due to its inherent volatility. Intraday movements from trough to peak of 20% are not uncommon. Those seeking to capitalise on SMCI’s gains should be mindful of the volatility, and a correction may be likely after such extended upward movements.
SMCI opened at US$540 and rose 60.4% to close at US$866.12 in February.
Technical Analysis
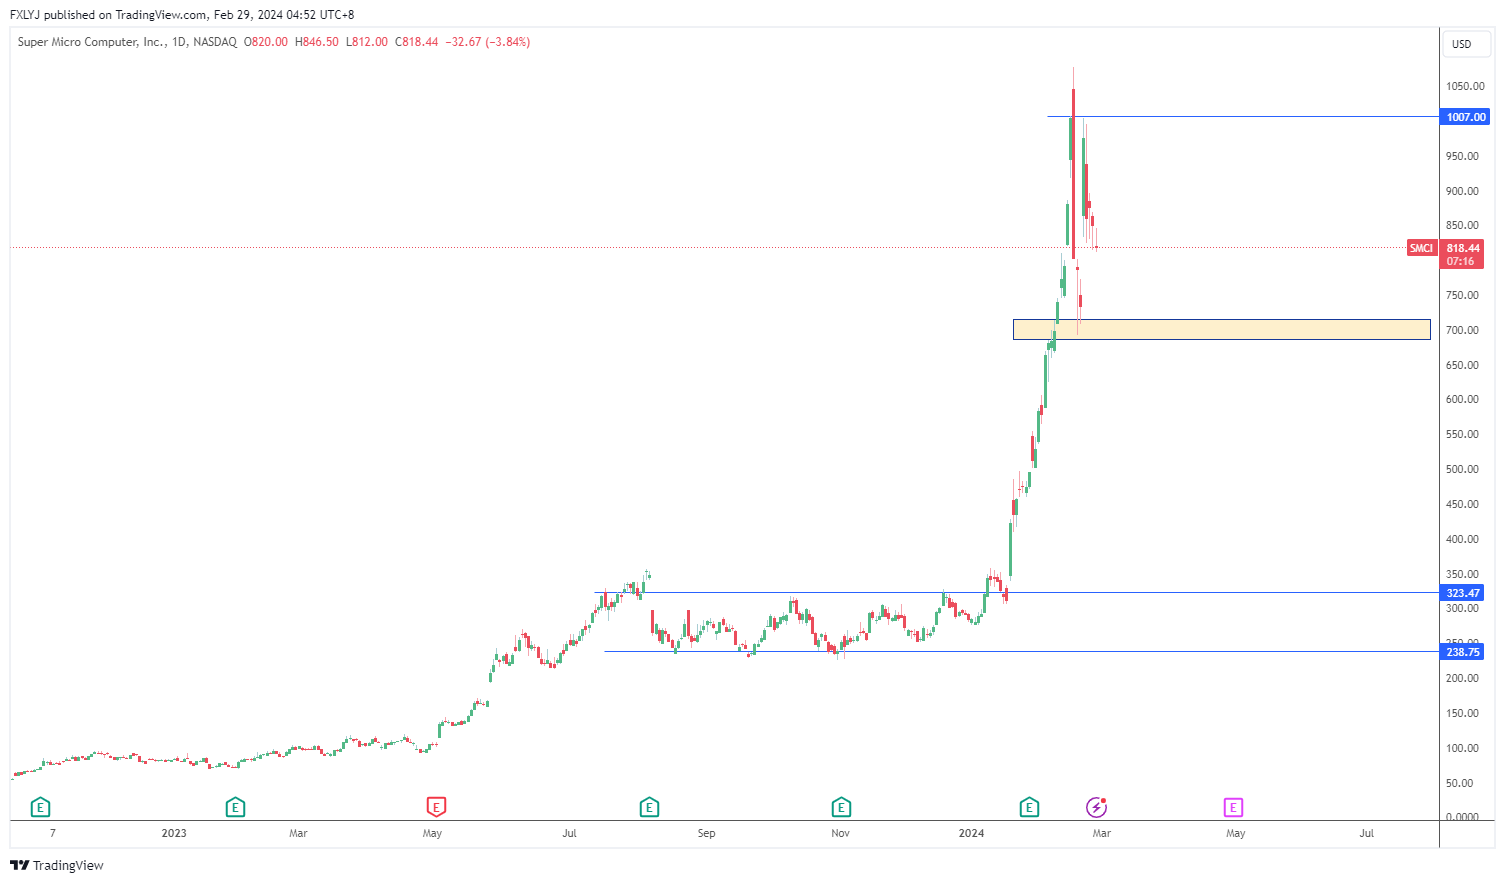
Status: Neutral
Support: US$700.00
Resistance: US$1000.00
Arm Holdings PLC (NASDAQ: ARM)
In February, ARM, a chip design company, reported earnings that exceeded expectations and provided a robust profit forecast for the current quarter. The company disclosed earnings per share of 29 cents, surpassing the anticipated 25 cents, and reported revenue of US$824 million, exceeding the estimate of US$761 million.7
Following the earnings release, ARM experienced a dramatic rally, with the stock surging nearly 50%. This rally marked a significant shift for the stock, which had previously shown lacklustre movement since its listing. It is now trading at more than US$100 for the first time since its much-anticipated IPO in September 2023.
ARM’s impressive performance also had a positive impact on SoftBank, led by renowned investor Masayoshi Son, which recorded a gain of over US$16 billion. This gain helped offset losses incurred from recent unfavourable investments in a few unicorns, notably WeWork, which resulted in a loss of more than US$14 billion for the fund.8
ARM shares, currently thinly-traded due to SoftBank controlling over 90% of the company, may see changes in the coming months. This is anticipated after the IPO lockup period ends, potentially leading to increased trading volume as insiders consider selling shares.
ARM opened at US$71.87 and rose 96.2% to close at US$141.04 in February.
Technical Analysis
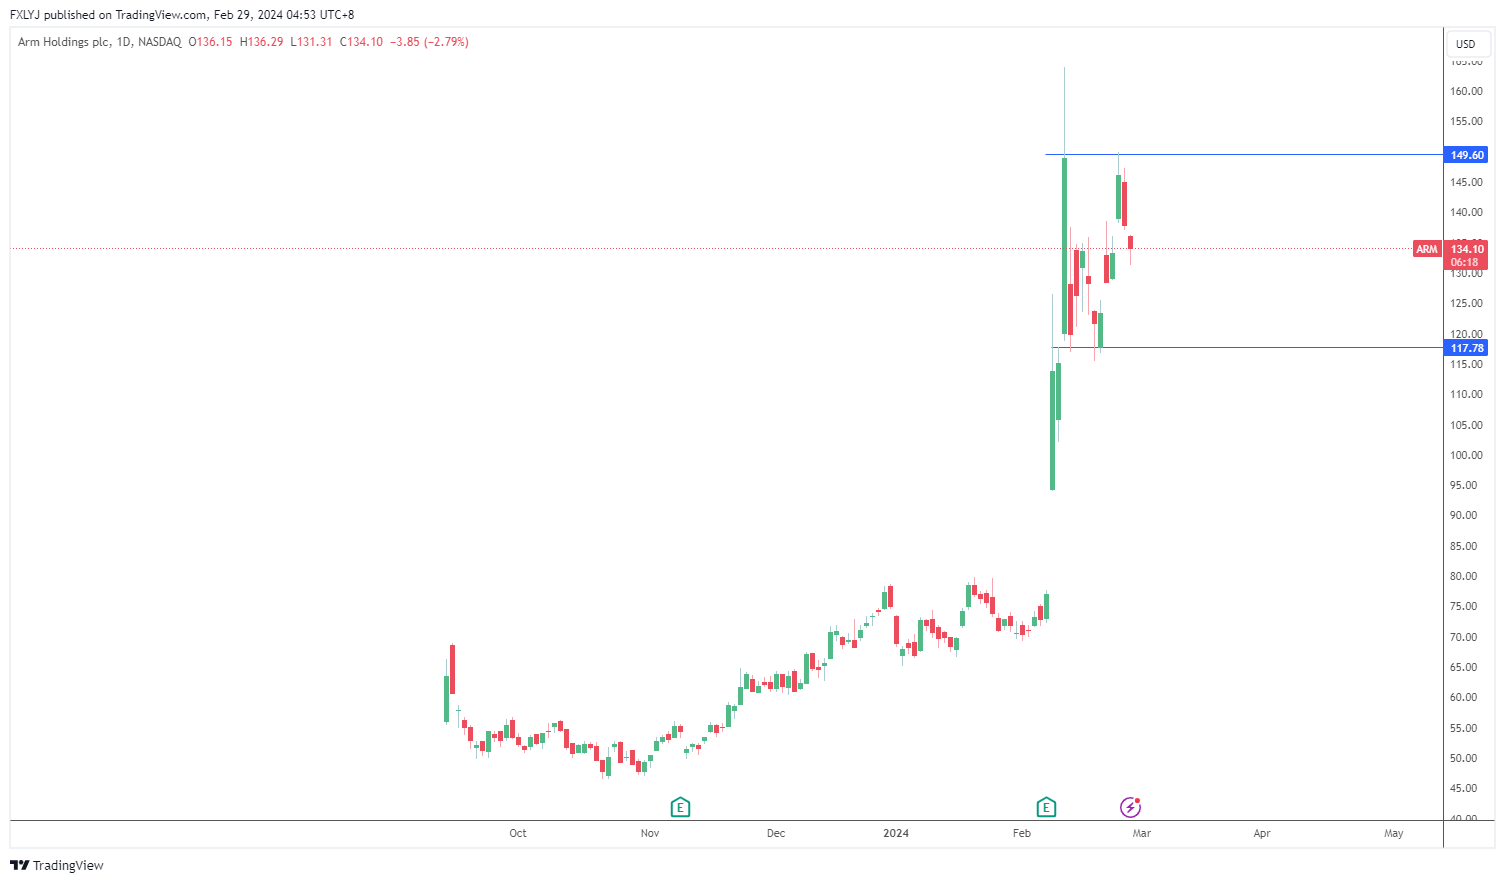
Status: Neutral
Support: US$118.00
Resistance: US$149.60
CONCLUSION
February has emerged as a positive month for stocks, with notable rallies despite the backdrop of less than favourable economic data. This strong market performance can be attributed to earnings that surpassed expectations. However, it raises questions about whether the stock market is overvalued and whether investors have become overly optimistic about the economic outlook. Amidst these uncertainties, one trend remains unequivocally strong: the influence of artificial intelligence (AI). The earnings reports from companies at the forefront of AI underscore the sector’s growing significance.
Embrace the opportunity to leverage corporate earnings announced after market hours by trading in the post-market session with POEMS! Utilise this additional trading period to refine your strategies and maximise your potential returns.
Bloomberg analysts’ recommendations
The table below shows the consensus ratings and average ratings of all analysts updated on Bloomberg in the last 12 months. Consensus ratings have been computed by standardising analysts’ ratings from a scale of 1 (Strong Sell) to 5 (Strong Buy). The table also shows several analysts’ recommendations to buy, hold or sell the stocks, as well as their average target prices.
| Security | Consensus Rating | BUY | HOLD | SELL | 12 Mth Target Price (US$) |
| Nvidia Corporation (NASDAQ: NVDA) | 4.77 | 58 (89.2%) | 7 (10.8%) | 0 | 895.25 |
| Super Micro Computer Inc (NASDAQ: SMCI) | 4.33 | 11 (73.3%) | 3 (20.0%) | 1 (6.7%) | 771.5 |
| ARM Holdings Inc (NASDAQ: ARM) | 3.81 | 16 (50.0%) | 13 (40.6%) | 3 (9.4%) | 98.58 |
Post market trading is available on Poems now!
Get yourself educated!Join our free webinar here!

With our newly launched POEMS Mobile 3 Trading App
Explore a myriad of useful features including TradingView chartings to conduct technical analysis with over 100 technical indicators available!
Take this opportunity to expand your trading portfolio with our wide range of products including Stocks, CFDs, ETFs, Unit Trusts and more across 15 global exchanges available for you anytime and anywhere to elevate you as a better trader using our POEMS Mobile 3 App!
Alternatively, you can reach out to our Night Desk representatives at globalnight@phillip.com.sg / (+65) 6531 1225. Join us today and embark on a thrilling adventure in our lively Telegram community, where we’re eager to share even more enlightening insights!
Open an account and trade the US market today!
Reference:
- [1] https://www.cnbc.com/2024/02/09/openai-ceo-sam-altman-reportedly-seeking-trillions-of-dollars-for-ai-chip-project.html
- [2] https://www.investopedia.com/dow-jones-today-02212024-8597858
- [3] https://www.cnbc.com/2024/02/21/fed-minutes-january-2024.html
- [4] https://www.cnbc.com/2024/02/13/cpi-inflation-january-2024-consumer-prices-rose-0point3percent-in-january-more-than-expected-as-the-annual-rate-moved-to-3point1percent.html
- [5] https://www.cnbc.com/2024/02/21/nvidia-nvda-earnings-report-q4-2024.html
- [7] https://www.cnbc.com/2024/02/08/arm-shares-soar-after-reporting-strong-earnings-and-forecast.html
- [8] https://www.cnbc.com/2024/02/07/softbank-nets-20-billion-on-arm-earnings-exceeding-losses-in-wework.html
Disclaimer
These commentaries are intended for general circulation. It does not have regard to the specific investment objectives, financial situation and particular needs of any person who may receive this document. Accordingly, no warranty whatsoever is given and no liability whatsoever is accepted for any loss arising whether directly or indirectly as a result of any person acting based on this information. Opinions expressed in these commentaries are subject to change without notice. Investments are subject to investment risks including the possible loss of the principal amount invested. The value of the units and the income from them may fall as well as rise. Past performance figures as well as any projection or forecast used in these commentaries are not necessarily indicative of future or likely performance. Phillip Securities Pte Ltd (PSPL), its directors, connected persons or employees may from time to time have an interest in the financial instruments mentioned in these commentaries. Investors may wish to seek advice from a financial adviser before investing. In the event that investors choose not to seek advice from a financial adviser, they should consider whether the investment is suitable for them.
The information contained in these commentaries has been obtained from public sources which PSPL has no reason to believe are unreliable and any analysis, forecasts, projections, expectations and opinions (collectively the “Research”) contained in these commentaries are based on such information and are expressions of belief only. PSPL has not verified this information and no representation or warranty, express or implied, is made that such information or Research is accurate, complete or verified or should be relied upon as such. Any such information or Research contained in these commentaries are subject to change, and PSPL shall not have any responsibility to maintain the information or Research made available or to supply any corrections, updates or releases in connection therewith. In no event will PSPL be liable for any special, indirect, incidental or consequential damages which may be incurred from the use of the information or Research made available, even if it has been advised of the possibility of such damages. The companies and their employees mentioned in these commentaries cannot be held liable for any errors, inaccuracies and/or omissions howsoever caused. Any opinion or advice herein is made on a general basis and is subject to change without notice. The information provided in these commentaries may contain optimistic statements regarding future events or future financial performance of countries, markets or companies. You must make your own financial assessment of the relevance, accuracy and adequacy of the information provided in these commentaries.
Views and any strategies described in these commentaries may not be suitable for all investors. Opinions expressed herein may differ from the opinions expressed by other units of PSPL or its connected persons and associates. Any reference to or discussion of investment products or commodities in these commentaries is purely for illustrative purposes only and must not be construed as a recommendation, an offer or solicitation for the subscription, purchase or sale of the investment products or commodities mentioned.
About the author
Global Markets Desk US Dealing Team
Phillip Securities Pte Ltd
The Global Markets Desk US Dealing team specialise in handling the US Markets in the Global Markets Desk.
Their responsibilities and capabilities extend from managing and taking orders from clients trading in the US market, to content generation, Technical Analysis and providing educational content to POEMS clients.

 Back in Business: The Return of IPOs & Top Traded Counters in March 2024
  From $50 to $100: Unveiling the Impact of Inflation
  How to soar higher with Positive Carry!
  Why 2024 Offers A Small Window of Opportunity and How to Position Yourself to Capture It


