
Bank of America - Stock Analyst Research
| Target Price* | 68.00 |
| Recommendation | ACCUMULATE› ACCUMULATE |
| Market Cap* | - |
| Publication Date | 17 Jul 2026 |
*At the time of publication
Bank of America Corporation – Record fees widen operating leverage
-
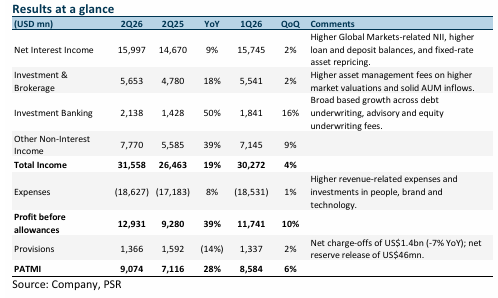
2Q26 PATMI rose 28% YoY to US$9.1bn, 1H26 earnings above our estimates at 54% of our FY26e forecast. Earnings rose on three drivers: a) buoyant equity markets lifted trading and IB fees to records, b) balance sheet growth and fixed rate asset repricing grew NII despite lower rates, and c) expenses grew just 8% against 19% revenue growth, generating 660bps of operating leverage. Lower provisions and US$6bn of buybacks amplified EPS growth to 34%. DPS rose 8% YoY to US$0.28.
-
NII rose 9% YoY to US$16bn as volume growth outpaced rate pressure. The sticky US$2.02tn low-cost deposit base funded 8% loan growth, while fixed rate assets repriced into higher yields. Record equity markets drove client trading, with equities revenue up 70%. Corporates returned to issuance after a multi-year drought, lifting IB fees 50%. Higher market valuations grew asset management fees 19%. FY26e NII growth is now guided at the upper end of 6% to 8%.
-
Maintain ACCUMULATE with higher target price of US$68 (prev. US$60) as we raise FY26e earnings by 7% from higher NII, fee and market income, and lower provisions estimates. Our GGM valuation assumes 1.48x FY26e P/BV and an ROE estimate of 15.3%. We like BAC as this quarter’s drivers are durable rather than one off: fixed rate repricing and loan growth sustain NII into 2H26, fee engines are diversified across trading, IB and wealth management, and improving card credit keeps provisions falling.
The Positives
+ NII marks a 7th straight quarter of growth; guidance at top of range. NII rose 9% YoY to
US$16bn, marking the 7th consecutive quarter of YoY growth, driven by Global Markets
activity, fixed-rate asset repricing, and balance sheet expansion. Average deposits grew 2%
YoY to US$2.02tn (12th consecutive quarter of growth) and average loans rose 8% YoY to
US$1.22tn, with growth across every segment. Net interest yield of 2.08% rose 14bps YoY.
Management now guides FY26e NII growth to the upper end of 6%-8%, supported by loan
growth and fixed-rate repricing.
+ Markets and IB deliver an exceptional fee quarter. Sales and trading revenue rose 33%
YoY to US$7.1bn, a 17th consecutive quarter of YoY growth, led by record equities revenue
of US$3.6bn (+70% YoY); FICC rose 9% YoY to US$3.5bn. IB fees jumped 50% YoY to US$2.1bn
on strength across debt underwriting, advisory and equity underwriting. Asset management
fees rose 19% YoY to US$4.4bn on higher market valuations and solid AUM inflows, with GWIM client balances of US$4.9tn (+12% YoY). Every segment posted double-digit net
income growth: Global Markets +72%, GWIM +42%, Global Banking +20% and Consumer
Banking +10%.
+ Credit costs fall; reserves released. Provisions fell 14% YoY to US$1.4bn, with net charge
offs down 7% YoY to US$1.4bn and the NCO rate improving 8bps YoY to 0.47% (1Q26: 0.48%).
Consumer card charge-offs and delinquencies improved YoY and QoQ, commercial credit
remained solid on CRE improvement, and the quarter saw a US$46mn net reserve release
About the author

Glenn Thum
Research Analyst
PSR
Glenn covers the Banking and Finance sector. He has had 3 years of experience as a Credit Analyst in a Bank, where he prepared credit proposals by conducting consistent critical analysis on the business, market, country and financial information. Glenn graduated with a Bachelor of Business Management from the University of Queensland with a double major in International Business and Human Resources.
Important Information
This report is prepared and/or distributed by Phillip Securities Research Pte Ltd ("Phillip Securities Research"), which is a holder of a financial adviser’s licence under the Financial Advisers Act, Chapter 110 in Singapore.
By receiving or reading this report, you agree to be bound by the terms and limitations set out below. Any failure to comply with these terms and limitations may constitute a violation of law. This report has been provided to you for personal use only and shall not be reproduced, distributed or published by you in whole or in part, for any purpose. If you have received this report by mistake, please delete or destroy it, and notify the sender immediately.
The information and any analysis, forecasts, projections, expectations and opinions (collectively, the “Research”) contained in this report has been obtained from public sources which Phillip Securities Research believes to be reliable. However, Phillip Securities Research does not make any representation or warranty, express or implied that such information or Research is accurate, complete or appropriate or should be relied upon as such. Any such information or Research contained in this report is subject to change, and Phillip Securities Research shall not have any responsibility to maintain or update the information or Research made available or to supply any corrections, updates or releases in connection therewith.
Any opinions, forecasts, assumptions, estimates, valuations and prices contained in this report are as of the date indicated and are subject to change at any time without prior notice. Past performance of any product referred to in this report is not indicative of future results.
This report does not constitute, and should not be used as a substitute for, tax, legal or investment advice. This report should not be relied upon exclusively or as authoritative, without further being subject to the recipient’s own independent verification and exercise of judgment. The fact that this report has been made available constitutes neither a recommendation to enter into a particular transaction, nor a representation that any product described in this report is suitable or appropriate for the recipient. Recipients should be aware that many of the products, which may be described in this report involve significant risks and may not be suitable for all investors, and that any decision to enter into transactions involving such products should not be made, unless all such risks are understood and an independent determination has been made that such transactions would be appropriate. Any discussion of the risks contained herein with respect to any product should not be considered to be a disclosure of all risks or a complete discussion of such risks.
Nothing in this report shall be construed to be an offer or solicitation for the purchase or sale of any product. Any decision to purchase any product mentioned in this report should take into account existing public information, including any registered prospectus in respect of such product.
Phillip Securities Research, or persons associated with or connected to Phillip Securities Research, including but not limited to its officers, directors, employees or persons involved in the issuance of this report, may provide an array of financial services to a large number of corporations in Singapore and worldwide, including but not limited to commercial / investment banking activities (including sponsorship, financial advisory or underwriting activities), brokerage or securities trading activities. Phillip Securities Research, or persons associated with or connected to Phillip Securities Research, including but not limited to its officers, directors, employees or persons involved in the issuance of this report, may have participated in or invested in transactions with the issuer(s) of the securities mentioned in this report, and may have performed services for or solicited business from such issuers. Additionally, Phillip Securities Research, or persons associated with or connected to Phillip Securities Research, including but not limited to its officers, directors, employees or persons involved in the issuance of this report, may have provided advice or investment services to such companies and investments or related investments, as may be mentioned in this report.
Phillip Securities Research or persons associated with or connected to Phillip Securities Research, including but not limited to its officers, directors, employees or persons involved in the issuance of this report may, from time to time maintain a long or short position in securities referred to herein, or in related futures or options, purchase or sell, make a market in, or engage in any other transaction involving such securities, and earn brokerage or other compensation in respect of the foregoing. Investments will be denominated in various currencies including US dollars and Euro and thus will be subject to any fluctuation in exchange rates between US dollars and Euro or foreign currencies and the currency of your own jurisdiction. Such fluctuations may have an adverse effect on the value, price or income return of the investment.
To the extent permitted by law, Phillip Securities Research, or persons associated with or connected to Phillip Securities Research, including but not limited to its officers, directors, employees or persons involved in the issuance of this report, may at any time engage in any of the above activities as set out above or otherwise hold an interest, whether material or not, in respect of companies and investments or related investments, which may be mentioned in this report. Accordingly, information may be available to Phillip Securities Research, or persons associated with or connected to Phillip Securities Research, including but not limited to its officers, directors, employees or persons involved in the issuance of this report, which is not reflected in this report, and Phillip Securities Research, or persons associated with or connected to Phillip Securities Research, including but not limited to its officers, directors, employees or persons involved in the issuance of this report, may, to the extent permitted by law, have acted upon or used the information prior to or immediately following its publication. Phillip Securities Research, or persons associated with or connected to Phillip Securities Research, including but not limited its officers, directors, employees or persons involved in the issuance of this report, may have issued other material that is inconsistent with, or reach different conclusions from, the contents of this report.
The information, tools and material presented herein are not directed, intended for distribution to or use by, any person or entity in any jurisdiction or country where such distribution, publication, availability or use would be contrary to the applicable law or regulation or which would subject Phillip Securities Research to any registration or licensing or other requirement, or penalty for contravention of such requirements within such jurisdiction.
This report is intended for general circulation only and does not take into account the specific investment objectives, financial situation or particular needs of any particular person. The products mentioned in this report may not be suitable for all investors and a person receiving or reading this report should seek advice from a professional and financial adviser regarding the legal, business, financial, tax and other aspects including the suitability of such products, taking into account the specific investment objectives, financial situation or particular needs of that person, before making a commitment to invest in any of such products.
This report is not intended for distribution, publication to or use by any person in any jurisdiction outside of Singapore or any other jurisdiction as Phillip Securities Research may determine in its absolute discretion.
IMPORTANT DISCLOSURES FOR INCLUDED RESEARCH ANALYSES OR REPORTS OF FOREIGN RESEARCH HOUSE
Where the report contains research analyses or reports from a foreign research house, please note:
- recipients of the analyses or reports are to contact Phillip Securities Research (and not the relevant foreign research house) in Singapore at 250 North Bridge Road, #06-00 Raffles City Tower, Singapore 179101, telephone number +65 6533 6001, in respect of any matters arising from, or in connection with, the analyses or reports; and
- to the extent that the analyses or reports are delivered to and intended to be received by any person in Singapore who is not an accredited investor, expert investor or institutional investor, Phillip Securities Research accepts legal responsibility for the contents of the analyses or reports.


About the author
Glenn Thum
Research Analyst
PSR
Glenn covers the Banking and Finance sector. He has had 3 years of experience as a Credit Analyst in a Bank, where he prepared credit proposals by conducting consistent critical analysis on the business, market, country and financial information. Glenn graduated with a Bachelor of Business Management from the University of Queensland with a double major in International Business and Human Resources.
 Magnificent 7 Monthly: Jun 26
 JPMorgan Chase & Co – Equity markets power a record quarter
 Q & M Dental Group Ltd - One huge step in scale and growth