Popular US Stocks traded in September 2022 October 18, 2022
Start trading on POEMS! Open a free account here!
At a glance:
- Third 75 basis point hike this year
- Fed is still hawkish
- Fed projection of 4.6% terminal rate in 2023
- New 52-week low for Dow Jones and S&P500 on 30 Sep
- FedEx falls short considerably on earning consensus
After starting the month on a bullish note on the hope of a Fed pivot, the three US major indices – Dow Jones, S&P 500 and Nasdaq Composite — were mostly bearish for the month of September. The bearish movement was further amplified after a hotter-than-expected inflation report which prompted Fed officials to signal the intention to take the federal fund rate up to 4.6% in 2023 and commit to taming inflation1.
| NASDAQ | DOW JONES | S&P 500 | |
| Month Open | 11,707.44 | 31,454.58 | 3,929.90 | Month Close | 10,575.62 | 28,725.51 | 3,585.62 | Monthly return | -9.67% | -8.68% | -8.76% |
At September’s FOMC meeting, the committee announced another 75 basis point rate hike, bringing the short-term rate up by 300 basis points. The Fed anticipates that more increases will be required to tame inflation. Based on the transcript of Fed chief Jerome Powell’s press conference, the committee members are strongly committed to bringing inflation back down to 2% by moving their policy stance purposefully to a level that will be sufficiently restrictive.
As inflation is still well above the 2% goal, the Committee is taking forceful and rapid steps to moderate demand so that it will better align with supply. They anticipate that ongoing increases in the federal fund rate will be appropriate and the pace of increase will depend on the incoming data and evolving outlook for the economy. The median projection for the appropriate level of the Fed funds rate is 4.4% by the end of this year. The projection is expected to rise to 4.6% by the end of 2023, and then decline to 2.9% by the end of 20252.
Here are some of the more popular US stocks, not ranked in any order, that traded by POEMS customers in September 2022.
Nio Inc – ADR (NYSE: NIO)
NIO reported mixed earnings this quarter. NIO opened September at USD19.28 and dropped 18.21% to close at USD15.77. The report showed that the firm’s profit margin fell from 14.6% for the last quarter to 13% for this quarter3. The loss per share was worse than expected at USD0.20 higher than estimates of USD0.17, while revenue was reported at USD1.54 billion beating estimates of USD1.4 billion4. Despite the higher revenue, NIO is still in the red as more was spent on its recharging and service networks. The company said that the second half of 2022 is crucial to it as it starts increasing production to full capacity. NIO is expecting 31,000-33,000 vehicles to be delivered in the third quarter which is around 20% more than the second quarter of 25,059.
Technical analysis
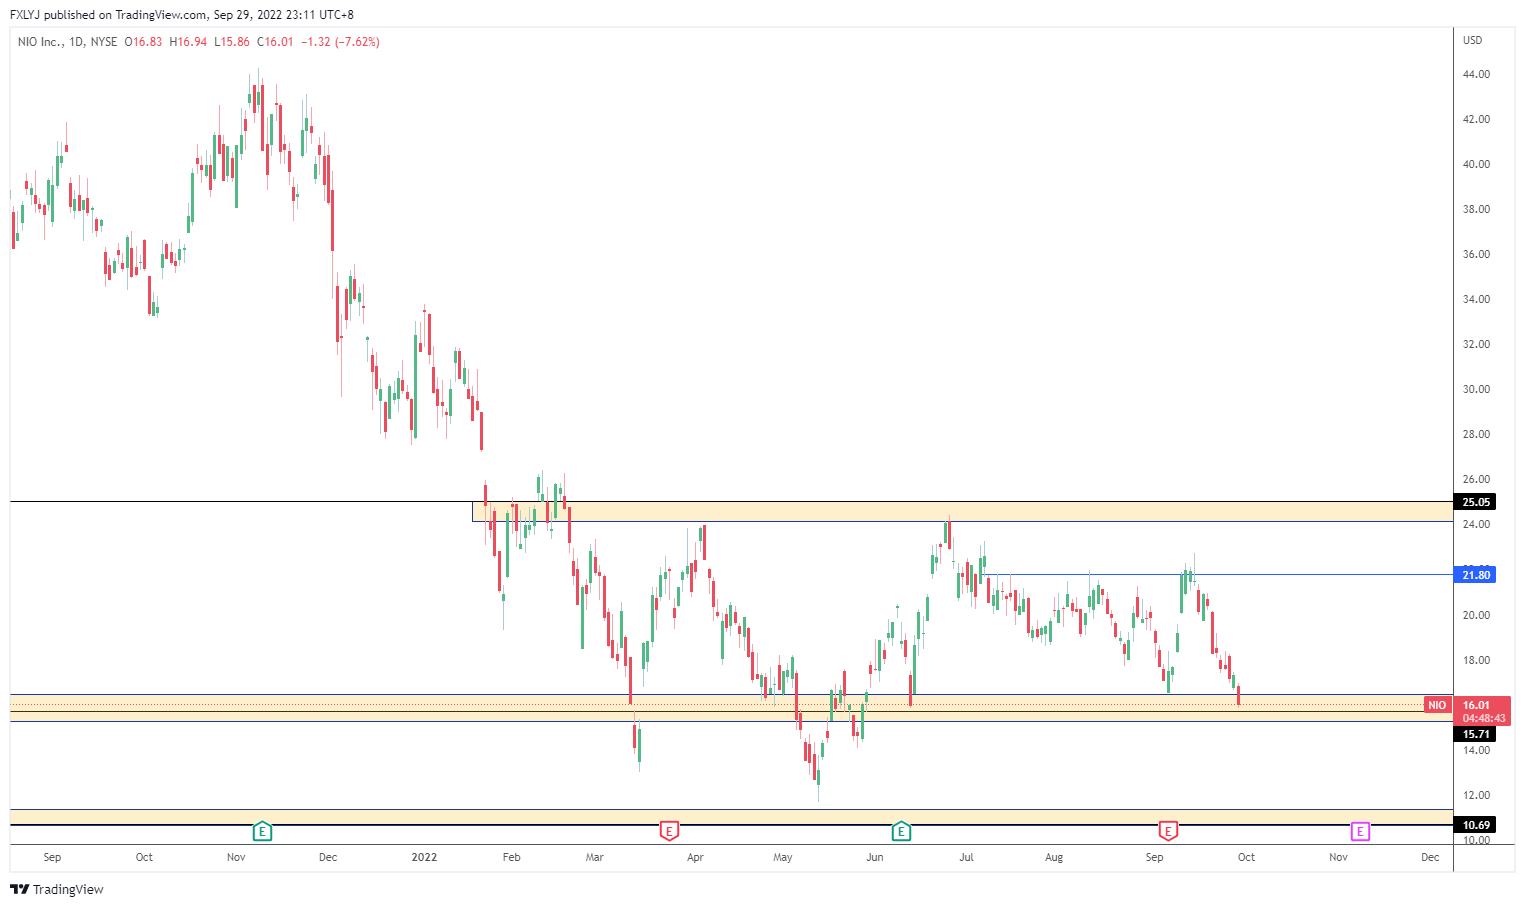
Status: Neutral
Support: USD15.30 – USD16.40
Resistance: USD21.80
Range-bound
Baidu Inc (NASDAQ: BIDU)
BIDU reported great earnings for the second quarter of 20225. BIDU opened September at USD144.15 and dropped 18.49% to close at USD117.49. Despite revenue falling 5% from a year ago, the current quarter reported revenue of USD4.43 billion, higher than the expected USD4.2 billion. Earnings per share (EPS) of USD 2.36 crashed estimates of USD0.82. Despite the uncertainties over COVID-19, the management of BIDU remains committed to its long-term goals, strategies and capabilities for shareholder value creation. The company is going to continue focusing on its mature business to maintain its profits and margins to enable BIDU to generate a strong cash flow to support AI initiatives.
Technical analysis
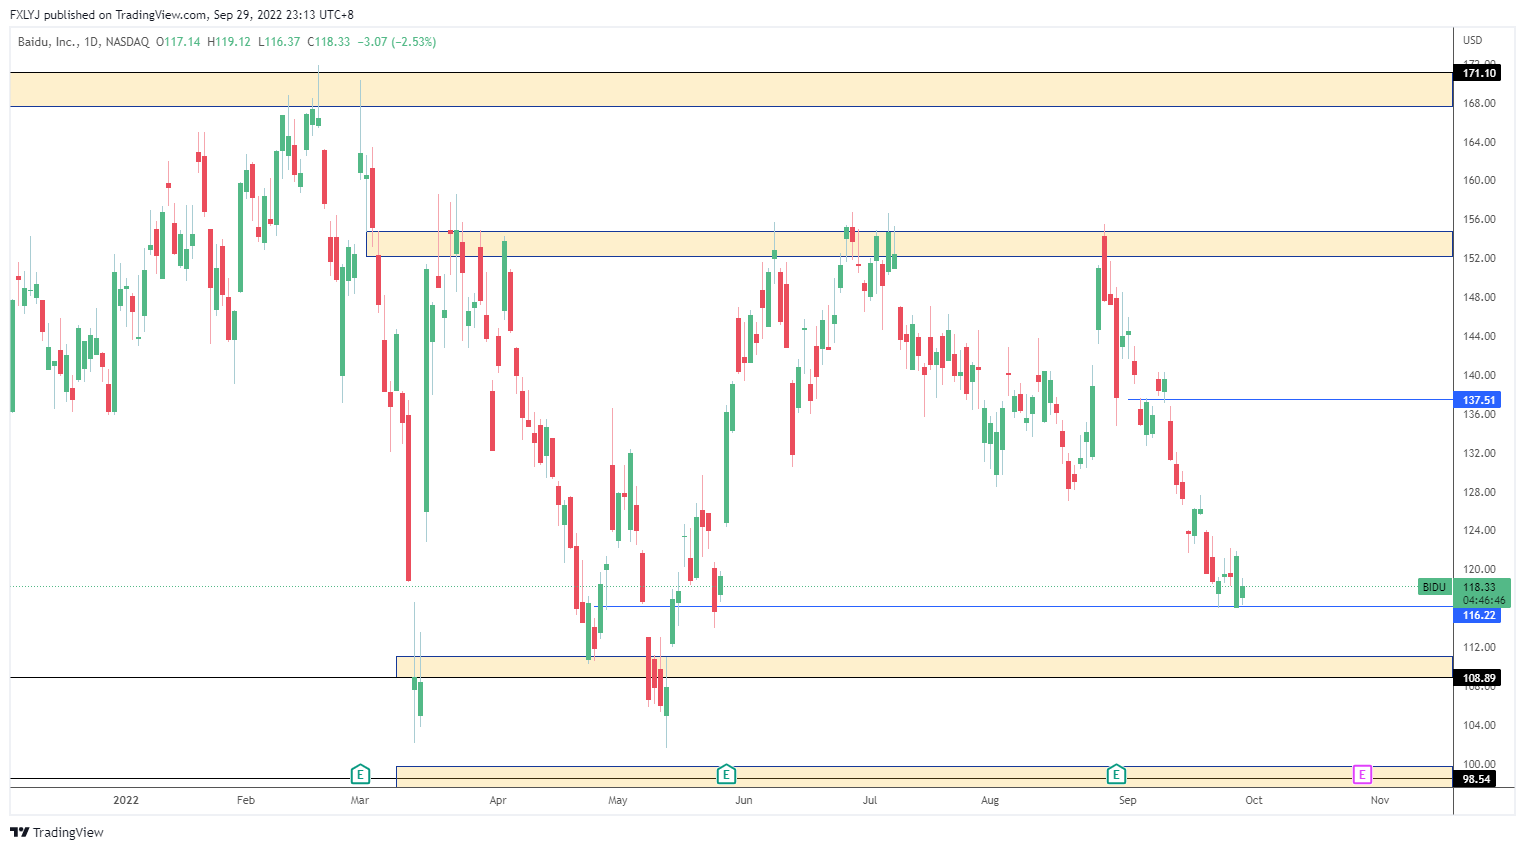
Status: Neutral
Support: USD109
Resistance: USD137.50
Range-bound
Adobe Inc (NASDAQ: ADBE)
Despite ADBE delivering earnings that were above analysts’ expectations, the ADBE share price dropped due to an acquisition6. ADBE EPS was reported at USD3.40 against the estimate of USD3.33. Reported revenue matched the consensus estimate of USD4.43 billion. The firm provided mixed guidance for the coming quarter. The company is expecting revenue of USD4.52 billion and EPS of USD3.5 for the coming quarter. As for the acquisition, ADBE acquired design platform Figma for $20 billion. Investors were not happy with the purchase as ADBE is paying around 50 times the revenue of Figma. ADBE opened September at USD371.00 and lost 25.82% to close at USD275.20.
According to a Phillip Research report dated 21 September 2022, the target price is USD420.00 with a Buy recommendation due to the explosion in digital content creation and continued shift to the cloud. Regarding the acquisition, Adobe agreed to it to take out an emerging competitor.
Technical analysis
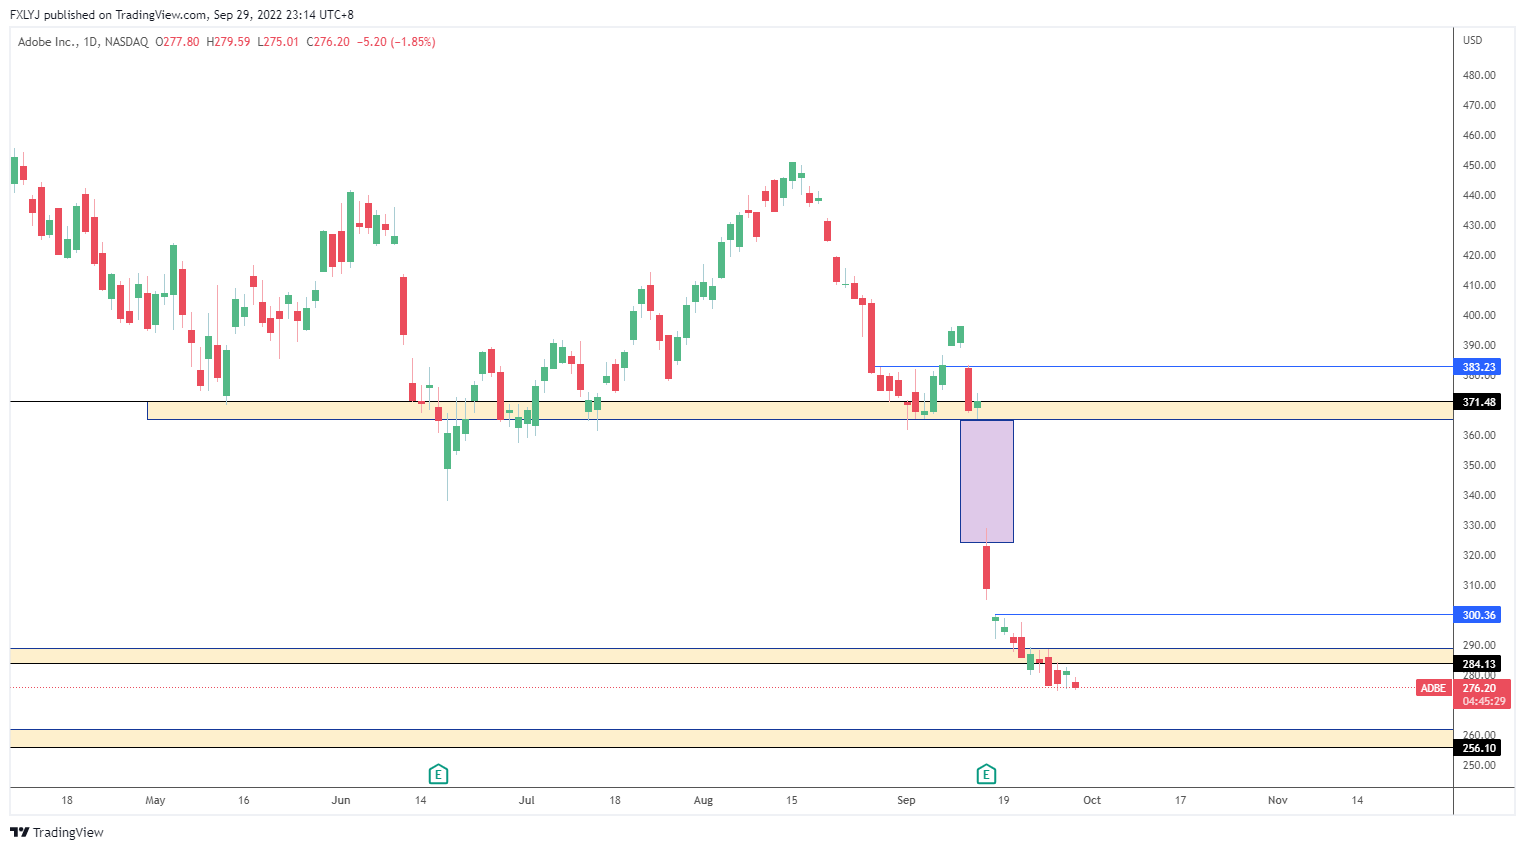
Status: Bearish
Support: USD256.10 – USD262.15
Resistance: USD290
There is strong bearish momentum since the earnings release, and investors will have to wait for a minor range to be formed before seeing any confirmation towards the upside.
Bilibili Inc (NASDAQ: BILI)
BILI reported disappointing earnings for the second quarter of 20227. The Loss per share of USD4.98 was worse than estimates of USD4.45 while revenue of USD4.91 billion beat estimates of USD4.9 billion. The firm believes that the largest impact of the pandemic is over, growth momentum is improving and margins will improve in the second half of 2022. BILI opened September at USD24.34 and dropped 37.06% to close at USD 15.32.
Technical analysis
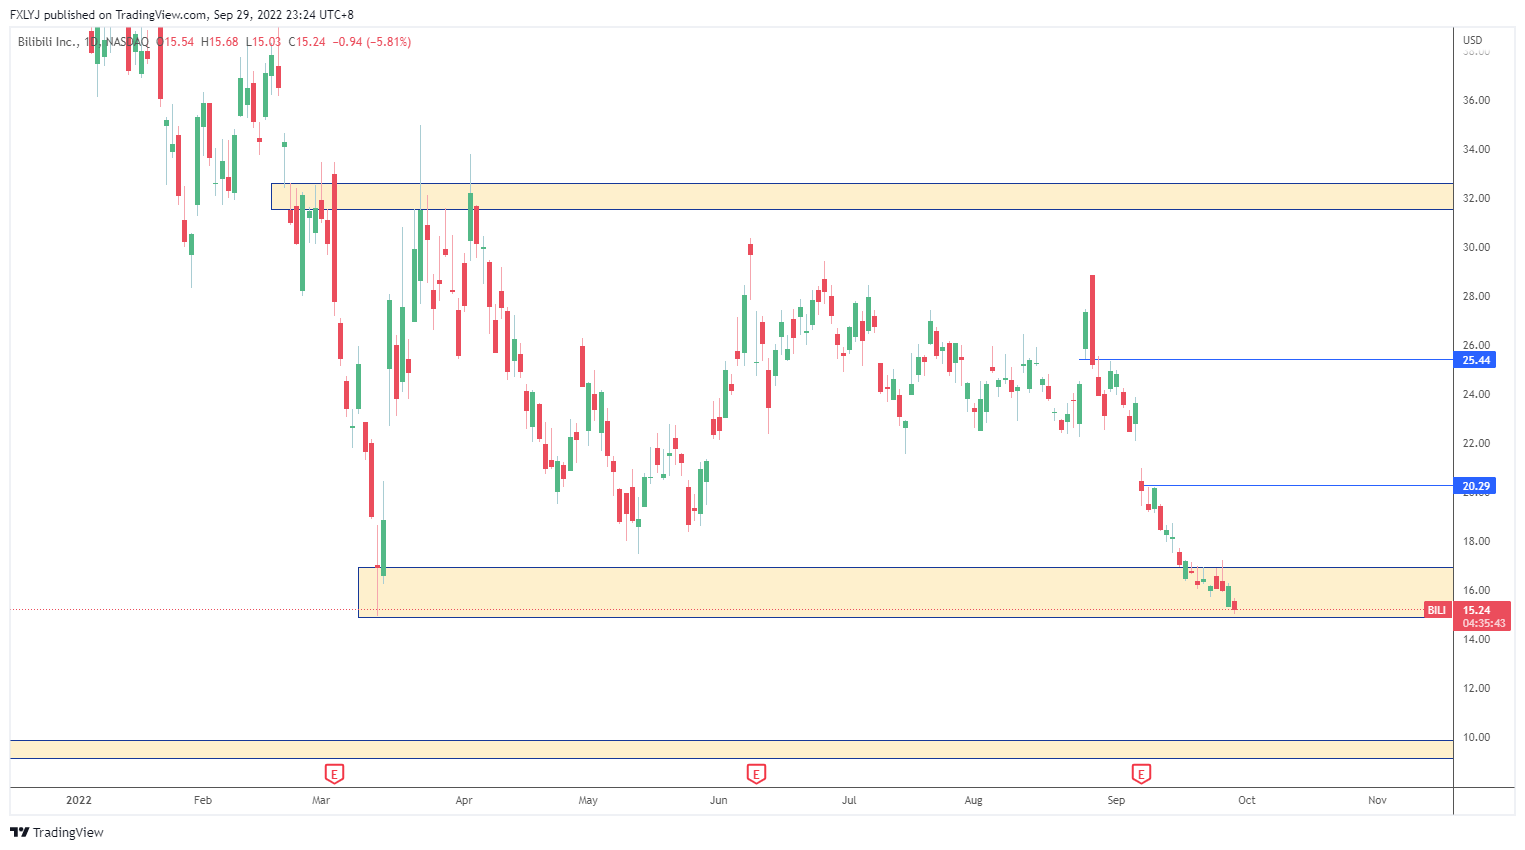
Status: Neutral
Support: USD14.90 – USD16.90
Resistance: USD20.30
Range-bound
Autodesk Inc (NASDAQ: ADSK)
ADSK delivered earnings that beat expectations this quarter. ADSK EPS was reported at USD1.65, higher than the estimate of USD1.57. Reported revenue was USD1.24 billion, beating expectations of USD1.22 billion. The company is continuing to target double-digit revenue growth and is planning to integrate end-to-end cloud-based solutions that drive efficiency and sustainability into industries that they are in8. In addition, this quarter’s result shows that ADSK growth is not as cyclical as it was previously. ADSK opened September at USD200.31 and closed 6.74% lower at USD186.80.
Technical analysis
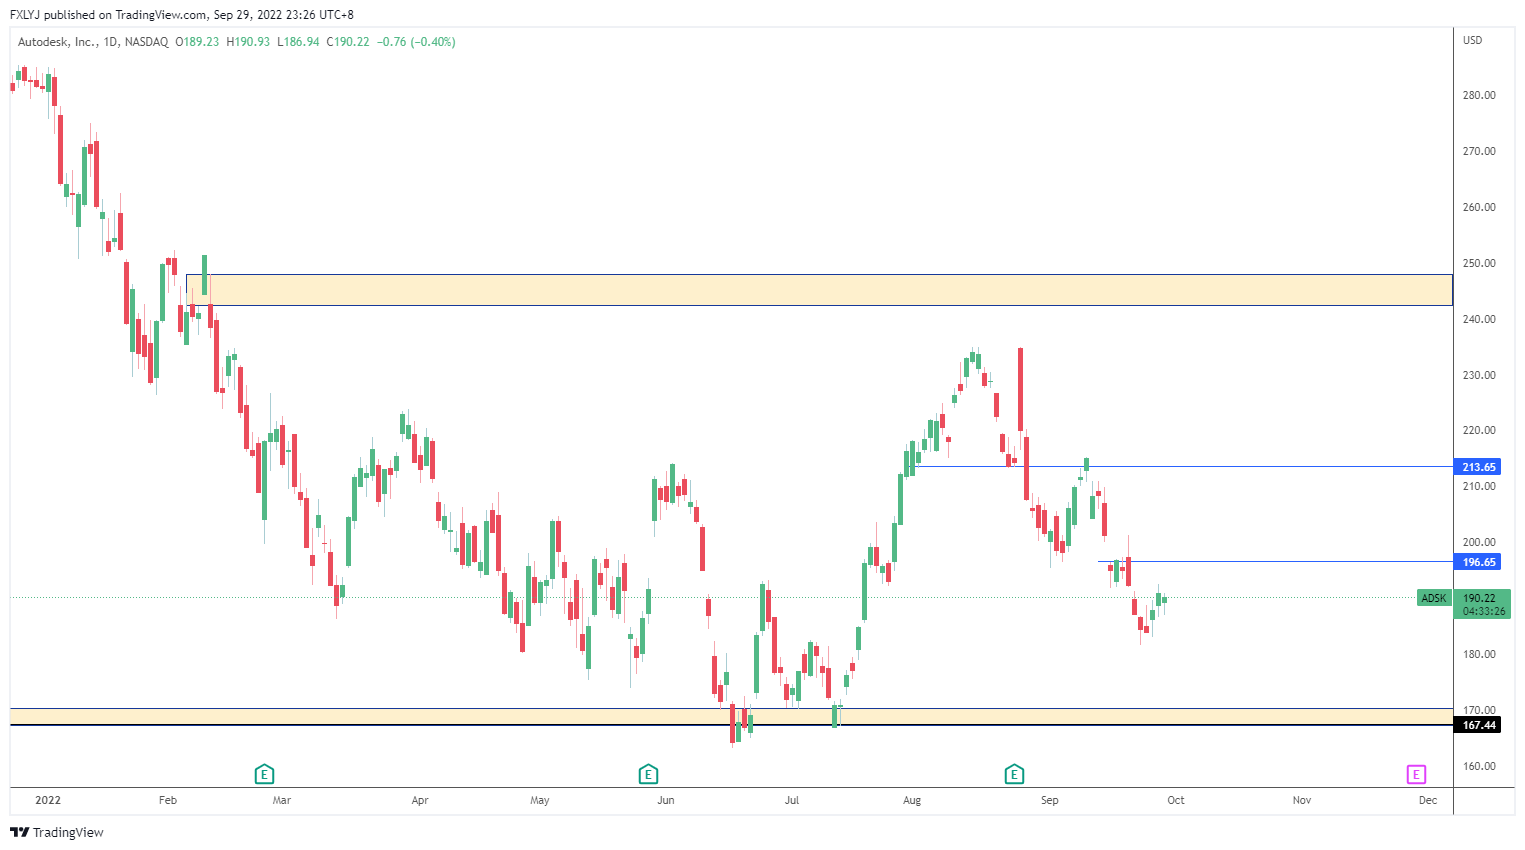
Status: Neutral
Support: USD167.30 – USD170
Resistance: USD196.70
Range-bound
Fedex Corporation (NYSE: FDX)
FDX reported disappointing earnings in September9. This announcement caused the FDX share price to fall 21% on the day of the earnings release, which was the biggest drop of the share price in a single day. Reported EPS and revenues of USD3.44 and USD 23.2billion were both lower than the estimates of USD5.14 and USD23.59 billion respectively. The shipping giant also gave a weaker-than-expected guidance for Q2. The company expects EPS of USD2.75 vs Wall Street analysts’ USD5.48. As a global shipment leader, a big miss of EPS may signify a major slowdown across the global economy. FDX opened September at USD209.45 and lost 29.11% to close at USD148.47
Technical analysis
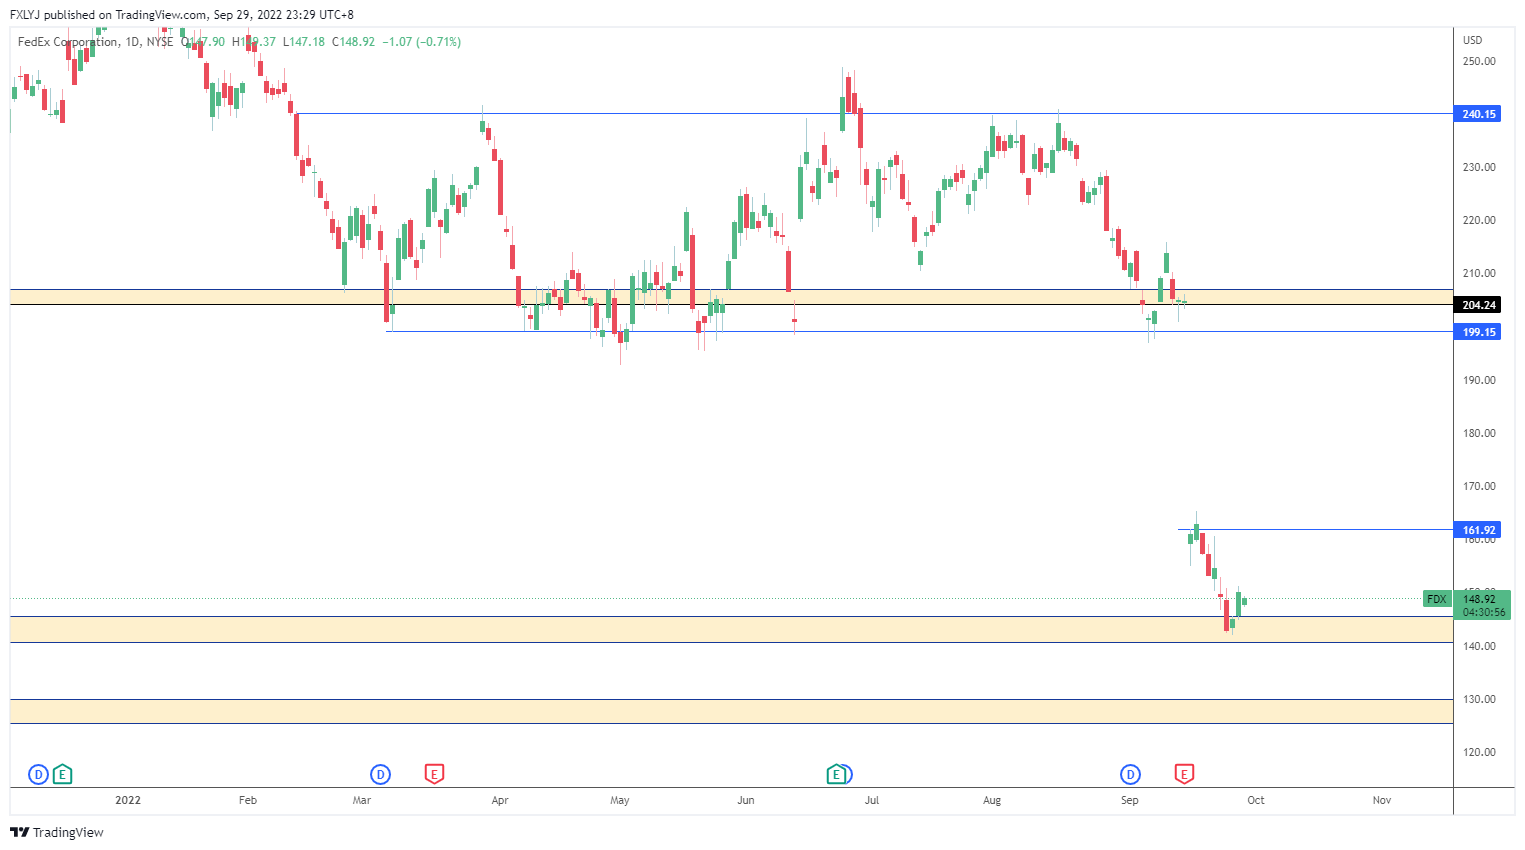
Status: Neutral
Support: USD140 – $145
Resistance: USD162
The share has been bearish since its earnings release, but the price seems to be finding support at the previous demand level. The share requires a lot more bullish momentum for the price to cover the gap-down area.
As on 30 June 2022, there are 2,952 Exchange-traded funds (ETF) listed in the US10. With many ETFs with different purposes in the market, ETFs are excellent tools for investors under the current investment climate.. Here are two ETFs that investors can find opportunities from.
SPDR S&P Bank ETF (NYSE-ARCA: KBE)
KBE is an ETF that tracks an equal-weighted index of US banking securities. The index represents bank sectors in the S&P 500 with First Interstate Bancsystem (NASDAQ: FIBK),Texas Capital Bancshares (NASDAQ: TCBI) and Truist Financial Corporation (NYSE: TFC) as its top 3 holdings. KBE commenced on 8 November 2005 with an expense ratio of 0.35%11. KBE’s year-to-date performance as of 29 September 2022 is -16.84%. KBE opened at USD47.48 and lost 6.72% to close at USD44.29.
Technical analysis
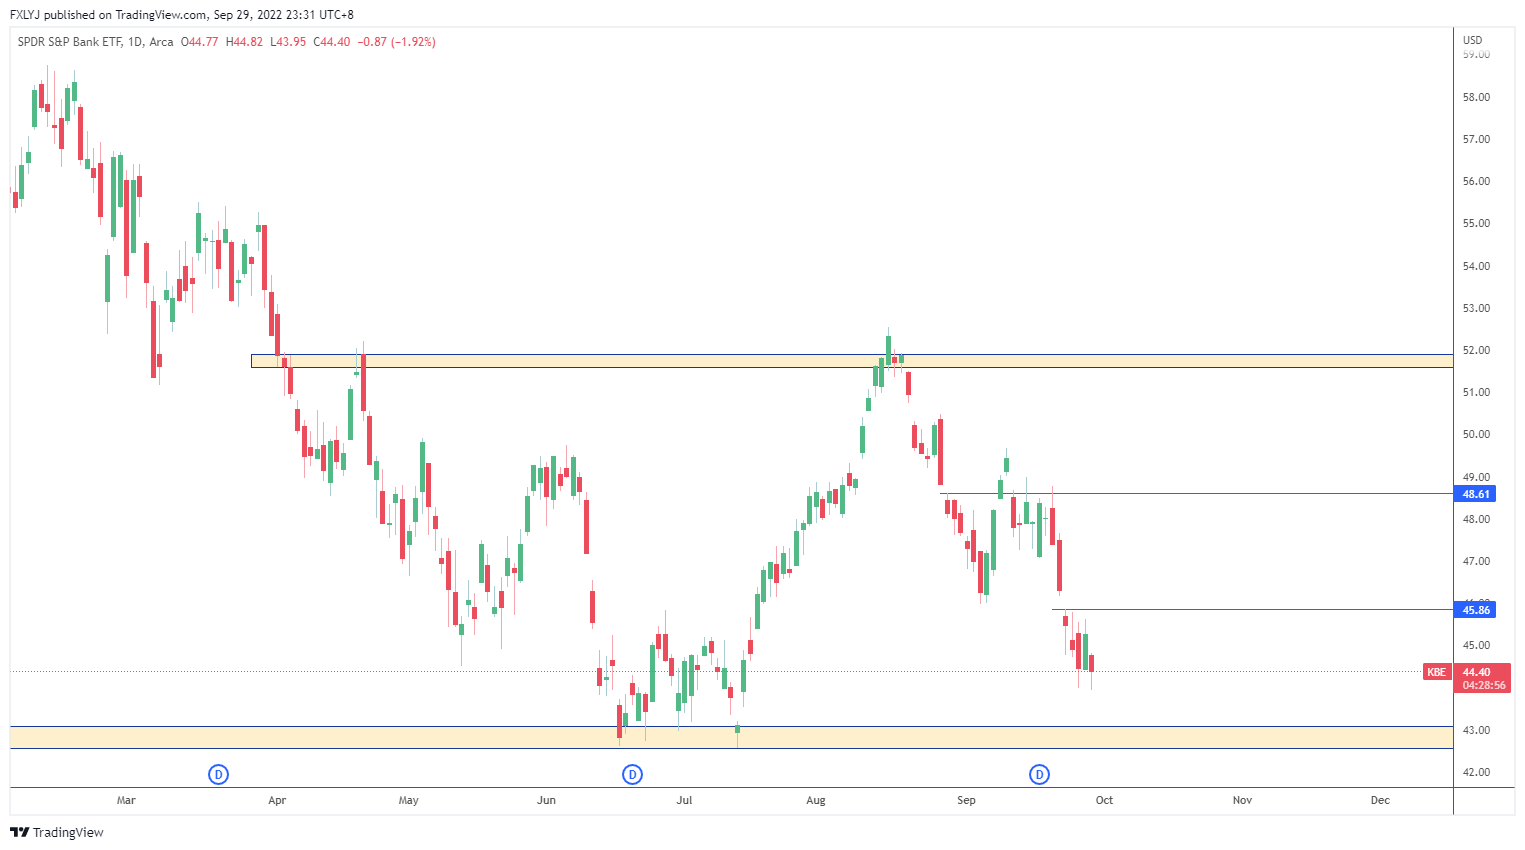
Status: Neutral
Support: USD42.60 – USD43.20
Resistance: USD45.90
Range-bound
SPDR S&P Oil & Gas Explore & Product (NYSE-ARCA: XOP)
XOP offers an equal-weighted approach to oil and gas exploration and production. Based on the GICS classification, the fund provides exposure for the oil and gas sector in the S&P 50012. The top 3 holdings in XOP are Continental Resources (NYSE: CLR), Occidental Petroleum (NYSE: OXY) and Exxon Mobil Corporation (NYSE: XOM). XOP commenced on 19 June 2006 with an expense ratio of 0.35%. KBE’s year-to-date performance as of 29 September 2022 is 32.45%. XOP opened September at USD141.98 and dropped 12.16% to close at USD124.72.
Technical analysis
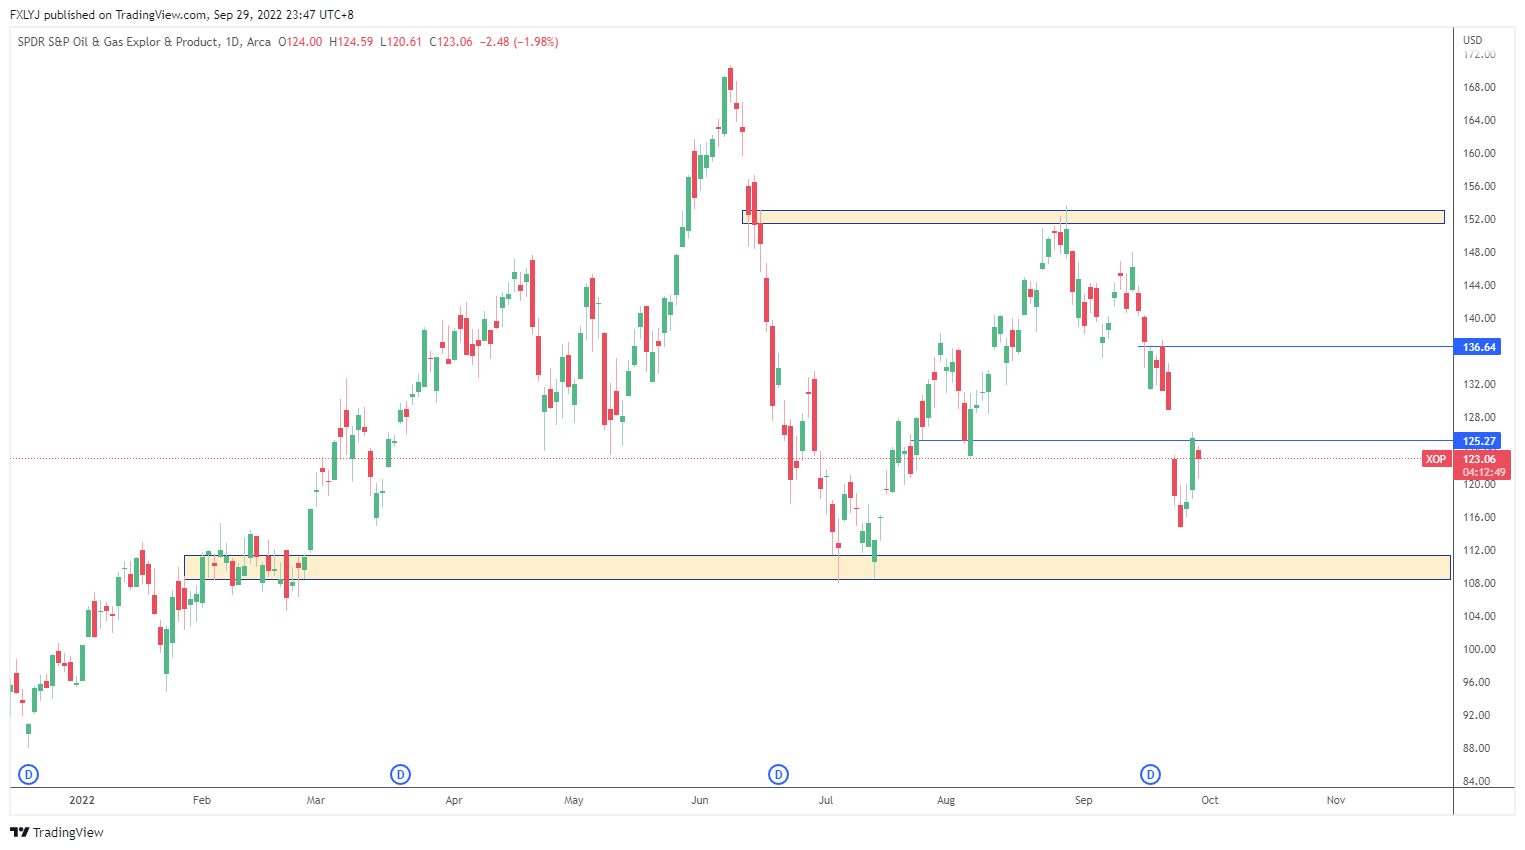
Status: Neutral
Support: USD108.60 – USD111.40
Resistance: USD125.30
Range-bound
Bloomberg analysts’ recommendations
The table below shows the consensus ratings and average ratings of all analysts updated on Bloomberg in the last 12 months. Consensus ratings have been computed by standardising analysts’ ratings from a scale of 1 (Strong Sell) to 5 (Strong Buy). The table also shows a number of analysts’ recommendations to buy, hold or sell the stocks, as well as their average target prices.
| Security | Consensus Rating | BUY | HOLD | SELL | 12 Mth Target Price (US$) |
| Nio Inc – ADR (NYSE: NIO) | 4.80 | 32 (91.4%) | 3 (8.6%) | 0 | 30.76 |
| Baidu Inc (NASDAQ: BIDU) | 4.68 | 41 (87.2%) | 5 (10.6%) | 1 (2.1%) | 198.14 |
| Bilibili Inc (NASDAQ: BILI) | 4.57 | 38 (30.9%) | 9 (19.1%) | 0 | 30.50 |
| Adobe Inc (NASDAQ: ADBE) | 4.53 | 26 (76.5%) | 8 (23.5%) | 0 | 466.45 |
| Autodesk Inc (NASDAQ: ADSK) | 4.24 | 14 (66.7%) | 6 (28.6%) | 1 (4.8%) | 260.68 |
| Fedex Corporation (NYSE: FDX) | 4.06 | 17 (53.1%) | 15 (46.9%) | 0 | 197.32 |
To round up
With the drop in inflation in the report released in August, the market was expecting the Fed to pivot on its rate hike decision. However, the inflation report released in September showed widespread inflation even amidst the sharp fall in energy prices. The hotter-than-expected inflation report killed any chance of a Fed pivot in the September FOMC meeting, prompting the committee to signal taking the rate into restrictive territory for a sustained period of time till there is clear evidence of a significant slowdown in inflation. During the FOMC press conference, Powell’s speech was hawkish, with all the Fed members supporting future rate hikes. This has caused the market to form a bearish sentiment, see a broad market sell-off with the Dow Jones and S&P500 forming new 52-week low and the Nasdaq Composite revisiting its June level.
Interested to learn more?Join our free webinar here!

With our newly launched POEMS Mobile 3 Trading App
Explore a myriad of useful features including TradingView chartings to conduct technical analysis with over 100 technical indicators available!
Take this opportunity to expand your trading portfolio with our wide range of products including Stocks, CFDs, ETFs, Unit Trusts and more across 15 global exchanges available for you anytime and anywhere to elevate you as a better trader using our POEMS Mobile 3 App!
Reference:
- [1] “Fed rate hike September 2022: Rates raised by three-quarters of a ….” 21 Sept. 2022
- [2] “Transcript of Chair Powell’s Press Conference September 21, 2022.” 21 Sept. 2022
- [3] “Quarterly Results – Investor Relations | NIO Inc..”
- [4] “NIO Inc. (NIO) Analyst Ratings, Estimates & Forecasts – Yahoo Finance.”
- [5] “Baidu (NASDAQ:BIDU) Smashes Q2 Earnings Forecast – TipRanks.” 29 Aug. 2022
- [6] “Adobe to acquire design platform Figma for $20 billion – CNBC.” 15 Sept. 2022
- [7] “Bilibili Inc. Announces Second Quarter 2022 Financial Results.” 9 Sept. 2022
- [8] “Autodesk (ADSK) Q2 2023 Earnings Call Transcript | The Motley Fool.” 24 Aug. 2022
- [9] “FedEx shares sink after company cites weakening global demand.” 16 Sept. 2022
- [10] “NYSE Arca Q2 2022 Quarterly ETF Report.”
- [11] “(KBE) SPDR S&P Bank ETF Stock Price, Quote & News.”
- [12] “(XOP) SPDR S&P Oil & Gas Exploration & Production ETF.”
Disclaimer
These commentaries are intended for general circulation. It does not have regard to the specific investment objectives, financial situation and particular needs of any person who may receive this document. Accordingly, no warranty whatsoever is given and no liability whatsoever is accepted for any loss arising whether directly or indirectly as a result of any person acting based on this information. Opinions expressed in these commentaries are subject to change without notice. Investments are subject to investment risks including the possible loss of the principal amount invested. The value of the units and the income from them may fall as well as rise. Past performance figures as well as any projection or forecast used in these commentaries are not necessarily indicative of future or likely performance. Phillip Securities Pte Ltd (PSPL), its directors, connected persons or employees may from time to time have an interest in the financial instruments mentioned in these commentaries. Investors may wish to seek advice from a financial adviser before investing. In the event that investors choose not to seek advice from a financial adviser, they should consider whether the investment is suitable for them.
The information contained in these commentaries has been obtained from public sources which PSPL has no reason to believe are unreliable and any analysis, forecasts, projections, expectations and opinions (collectively the “Research”) contained in these commentaries are based on such information and are expressions of belief only. PSPL has not verified this information and no representation or warranty, express or implied, is made that such information or Research is accurate, complete or verified or should be relied upon as such. Any such information or Research contained in these commentaries are subject to change, and PSPL shall not have any responsibility to maintain the information or Research made available or to supply any corrections, updates or releases in connection therewith. In no event will PSPL be liable for any special, indirect, incidental or consequential damages which may be incurred from the use of the information or Research made available, even if it has been advised of the possibility of such damages. The companies and their employees mentioned in these commentaries cannot be held liable for any errors, inaccuracies and/or omissions howsoever caused. Any opinion or advice herein is made on a general basis and is subject to change without notice. The information provided in these commentaries may contain optimistic statements regarding future events or future financial performance of countries, markets or companies. You must make your own financial assessment of the relevance, accuracy and adequacy of the information provided in these commentaries.
Views and any strategies described in these commentaries may not be suitable for all investors. Opinions expressed herein may differ from the opinions expressed by other units of PSPL or its connected persons and associates. Any reference to or discussion of investment products or commodities in these commentaries is purely for illustrative purposes only and must not be construed as a recommendation, an offer or solicitation for the subscription, purchase or sale of the investment products or commodities mentioned.
About the author
Global Markets Desk US Dealing Team
The Global Markets Desk US Dealing team specialise in handling the US Markets in the Global Markets Desk.
Their responsibilities and capabilities extend from managing and taking orders from clients trading in the US market, to content generation, Technical Analysis and providing educational content to POEMS clients.

 Back in Business: The Return of IPOs & Top Traded Counters in March 2024
  From $50 to $100: Unveiling the Impact of Inflation
  How to soar higher with Positive Carry!
  Why 2024 Offers A Small Window of Opportunity and How to Position Yourself to Capture It


