Popular US Stocks traded on POEMS in April 2022 May 12, 2022
Here are some of the more popular US stocks – not ranked in any order – traded by POEMS customers in the month of April.
Start trading on POEMS! Open a free account here!
News headlines in March 2022
- FOMC raises the federal funds rate target range by 0.25%
- 3 indices dropped
- Inflation hit a 4-decade high of 8.5% in March
- Federal Reserve signalled a Half-Point Rate Rise in May
- US annual GDP declines at 1.4% annual rate
The three US major indices – Dow Jones, S&P 500 and Nasdaq Composite were down in April. The major sell off stemmed from the technology sector.
| NASDAQ | DOW JONES | S&P 500 | |
| Month Open | 14,269.53 | 34,740.89 | 4,540.32 | Month Close | 12,315.74 | 32,977.22 | 4,131.92 | Monthly return | -13.69% | -5.08% | -9.00% |
There were two factors that triggered the selloff in April.
First, it was the surge of inflation in March. March’s inflation of 8.5% was a new 4 decade high1. The inflation was mainly driven by strong consumer demand, food costs and supply constraints. Rising costs were due to Russia’s invasion of Ukraine, which drove gasoline prices up by 18.3% in March, compared to a month earlier2. Electricity and natural gas prices went up by 11% in the month and 32% in the year.
The second concern that investors had was the Federal Reserve’s plans for rate hikes. After March’s inflation report was released, Fed Chairman Jerome Powell said that they may need to be more aggressive in the tightening of the monetary policy3. He hinted that a further 0.5% rise in interest rate was a possibility in the coming meeting. The Fed being more hawkish pushed investors to reduce their risk-taking.
US gross domestic product (GDP) shrank in the first quarter4. The GDP decreased by 1.4% annually which was mainly caused by a widening trade deficit and lower government stimulus.
ASML Holdings (NYSE:ASML)
ASML dropped 16.5% in April. It opened at USD675.29 and closed at USD563.77. ASML posted stronger than expected results this quarter5. Earnings per share (EPS) was reported at USD3.59 beating estimates of USD1.89 by 89.95%. Moving forward, ASML is planning to increase its capacity to meet the strong demand for semiconductors. The company is also forecasting gross margins to be around 49% to 50% for the next quarter and expects full-year revenue to grow by 20% from the previous year.
Technical analysis
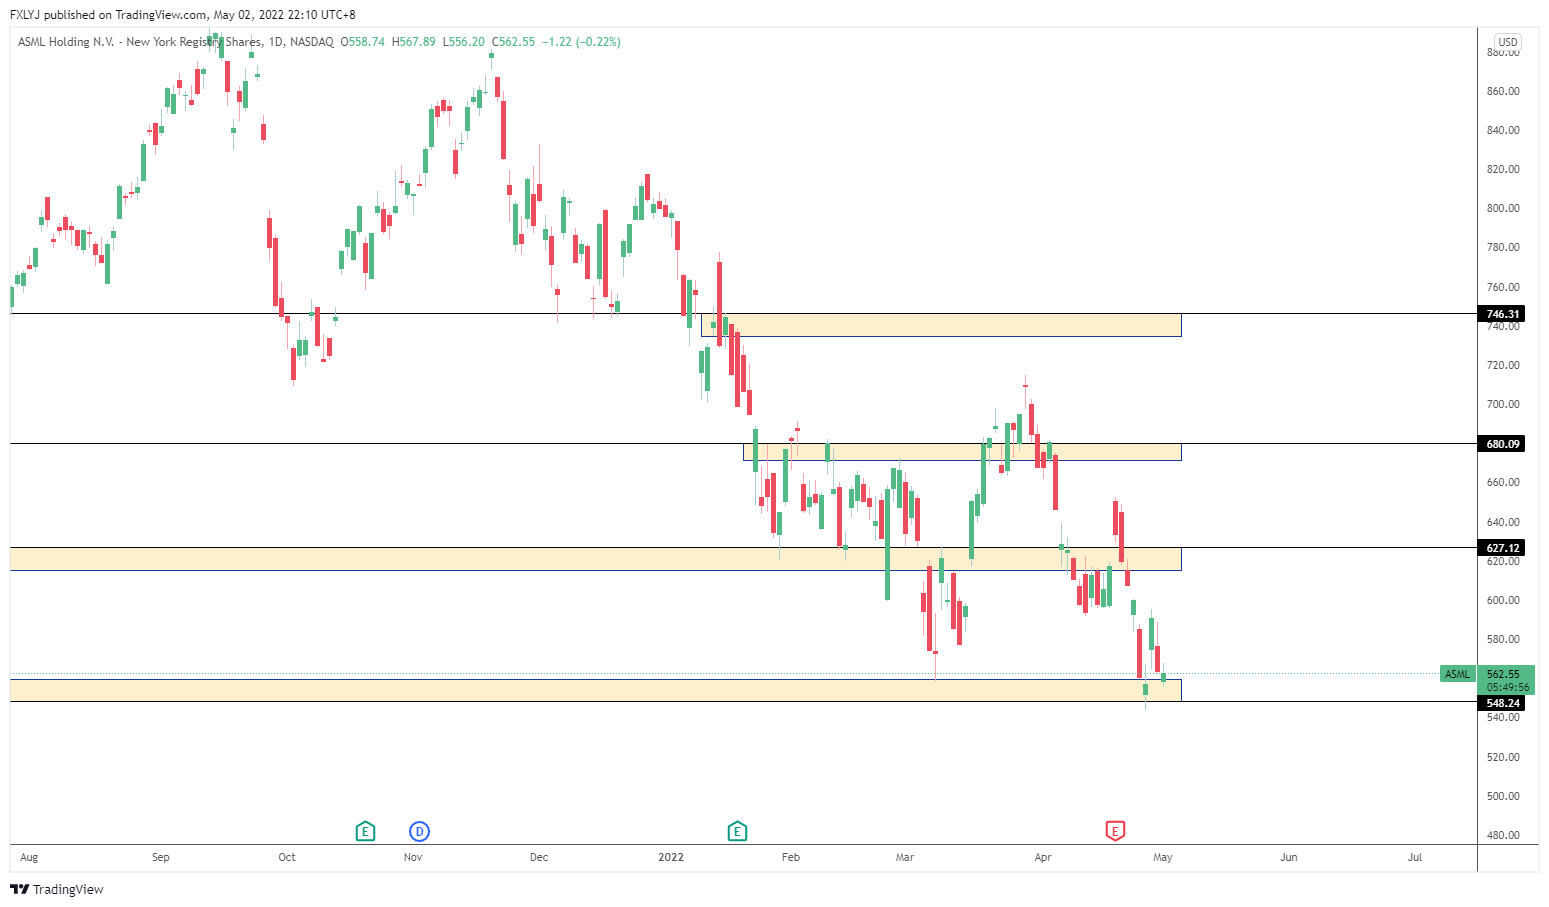
Status: Bearish market structure
Support: USD548.24
Resistance: USD627.12
Immediate support has to hold, otherwise there will be a strong bearish momentum towards more downside.
Bank of America (NYSE:BAC)
BAC’s earnings beat estimates for this quarter but were down for April due to inflation concerns. BAC opened April at USD41.69 and dropped 14.4% to close at USD35.68. The EPS of USD0.80 and revenue of USD23.33 billion both beat estimates of USD0.75 and USD23.2 billion respectively6. BAC’s better than expected credit quality of its borrowers drove BAC’s first quarter profit. The CFO of BAC also pointed out that the quality of its assets remains strong.
Technical analysis
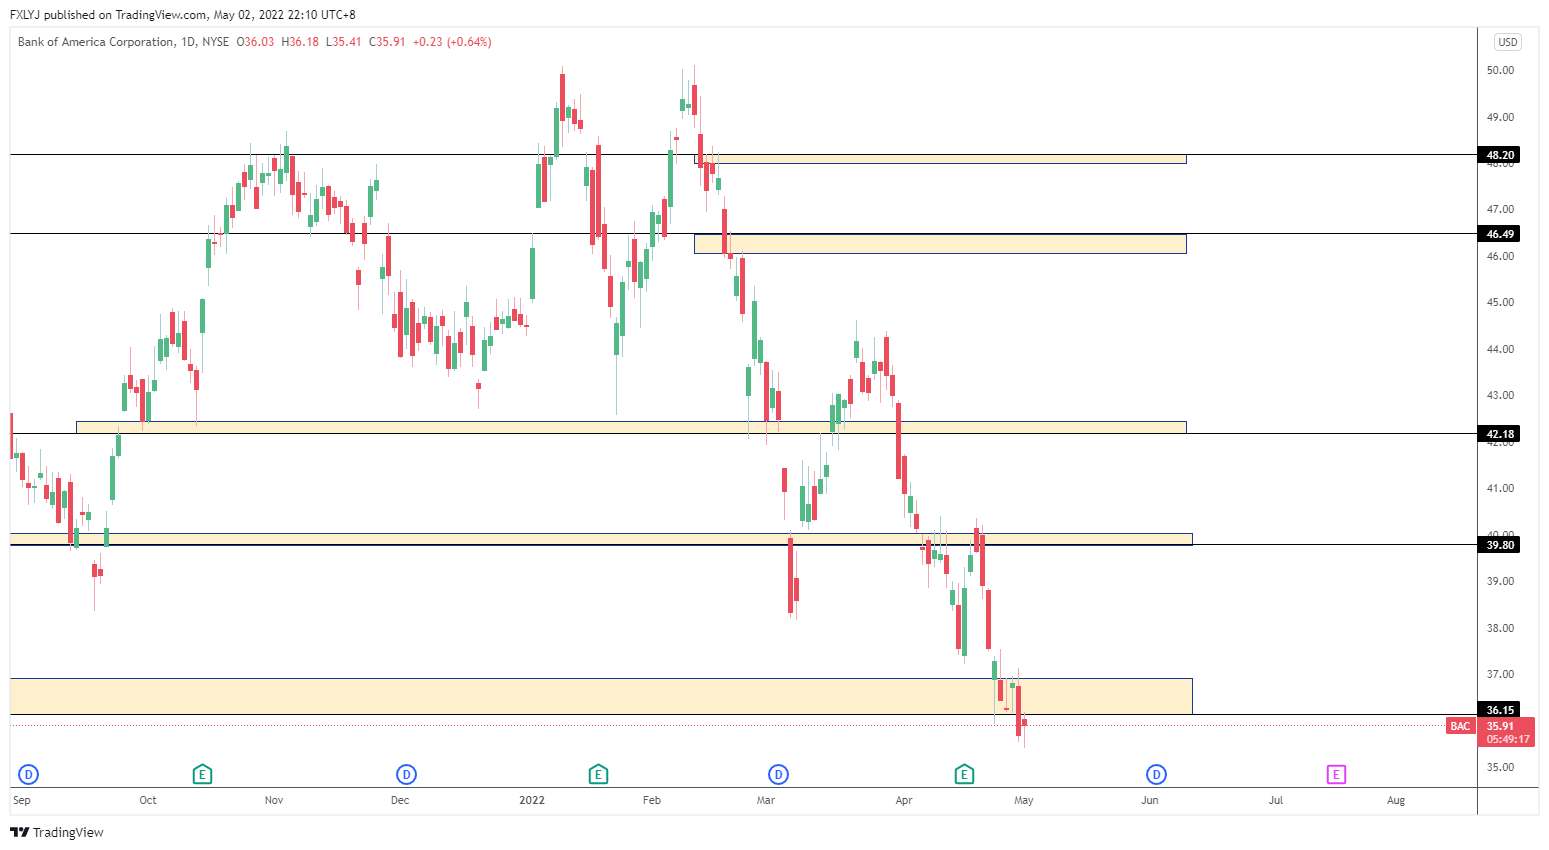
Status: Bearish market structure
Support: USD36.15
Resistance: USD39.80
Immediate support has to hold, otherwise there will be a strong bearish momentum towards more downside.
Freeport-McMoRan (NYSE: FCX)
FCX’s earnings beat estimates for this quarter but the stock price fell as management offered guidance for higher costs and slightly lower-than-expected output. FCX opened April at US$49.88 and dropped 18.7% to close at USD40.55. The EPS of USD1.07 beat estimates of USD0.94 with revenue reported at USD6.6 billion, 36% higher compared to the revenue of 1 year-ago of USD4.85 billion. The company’ new guidance for copper sales was down 1%. It hoped to sell 4.25 million pounds in 2022 compared to the January guidance of 4.3 million pounds. For 2023, the company now sees sales of 4.45 million pounds, trimmed from 4.5 million pounds7.
Technical analysis
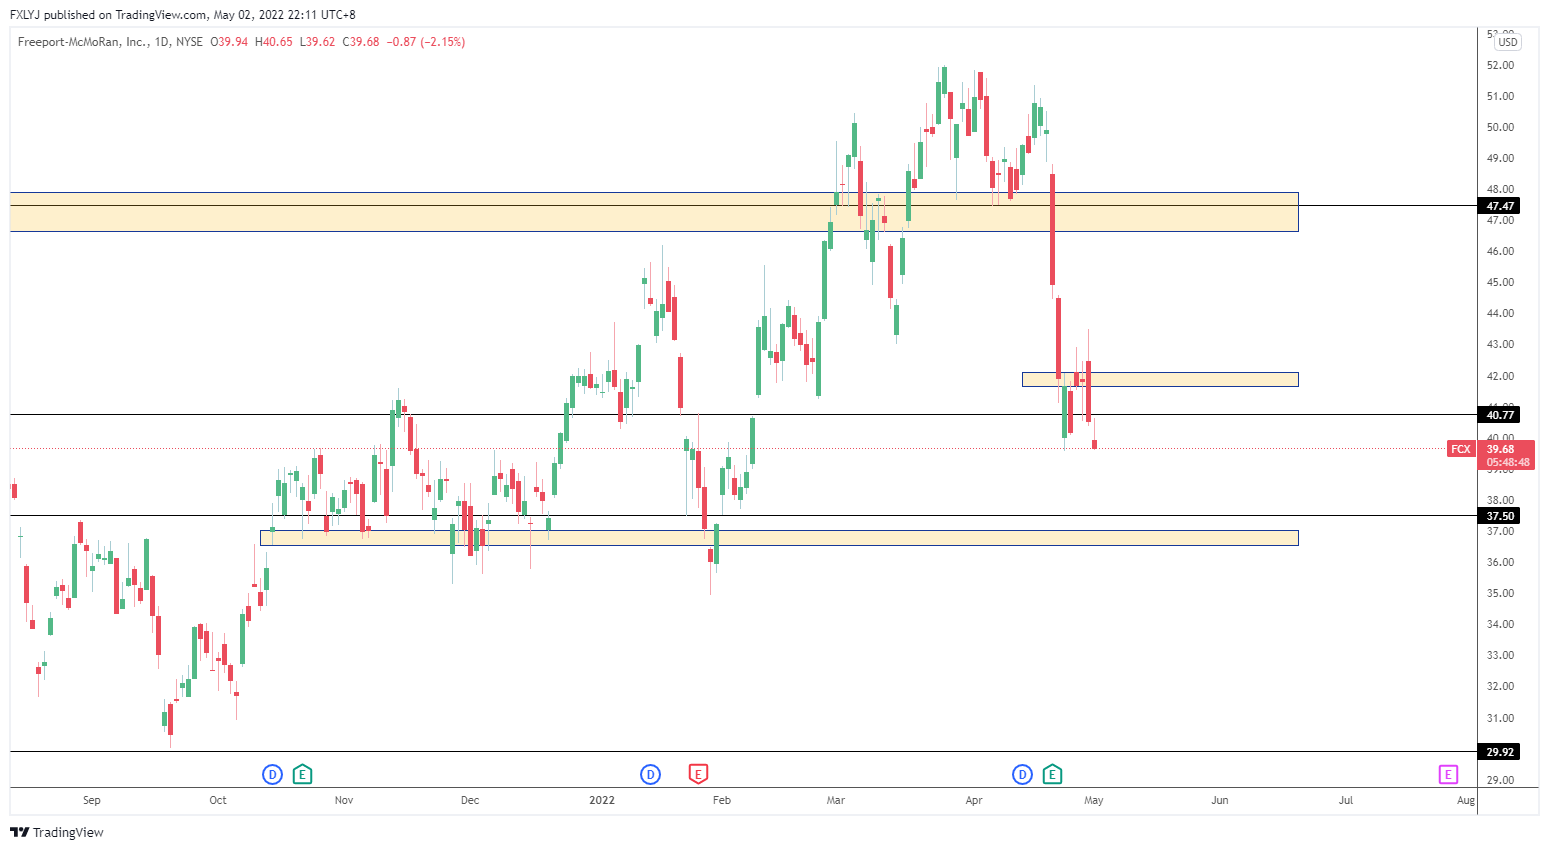
Status: Bearish market structure
Support: USD37.50
Resistance: USD42.00
Immediate support has to hold, otherwise there will be a strong bearish momentum towards more downside.
Procter & Gamble (NYSE: PG)
PG delivered earnings results that beat estimates this quarter. PG EPS was reported at USD1.66 against the estimate of USD1.65. Reported revenue was higher at USD20.95 billion against the expected USD20.34 billion. PG raised its outlook for sales growth from a range of 2-4% to a range of 3-4%. For fiscal 2022, PG expects commodity and freight costs to weigh even more heavily on its fiscal 2022 results8. PG opened April at USD153.52.43 and gained 4.6% to close at USD160.55.
Technical analysis
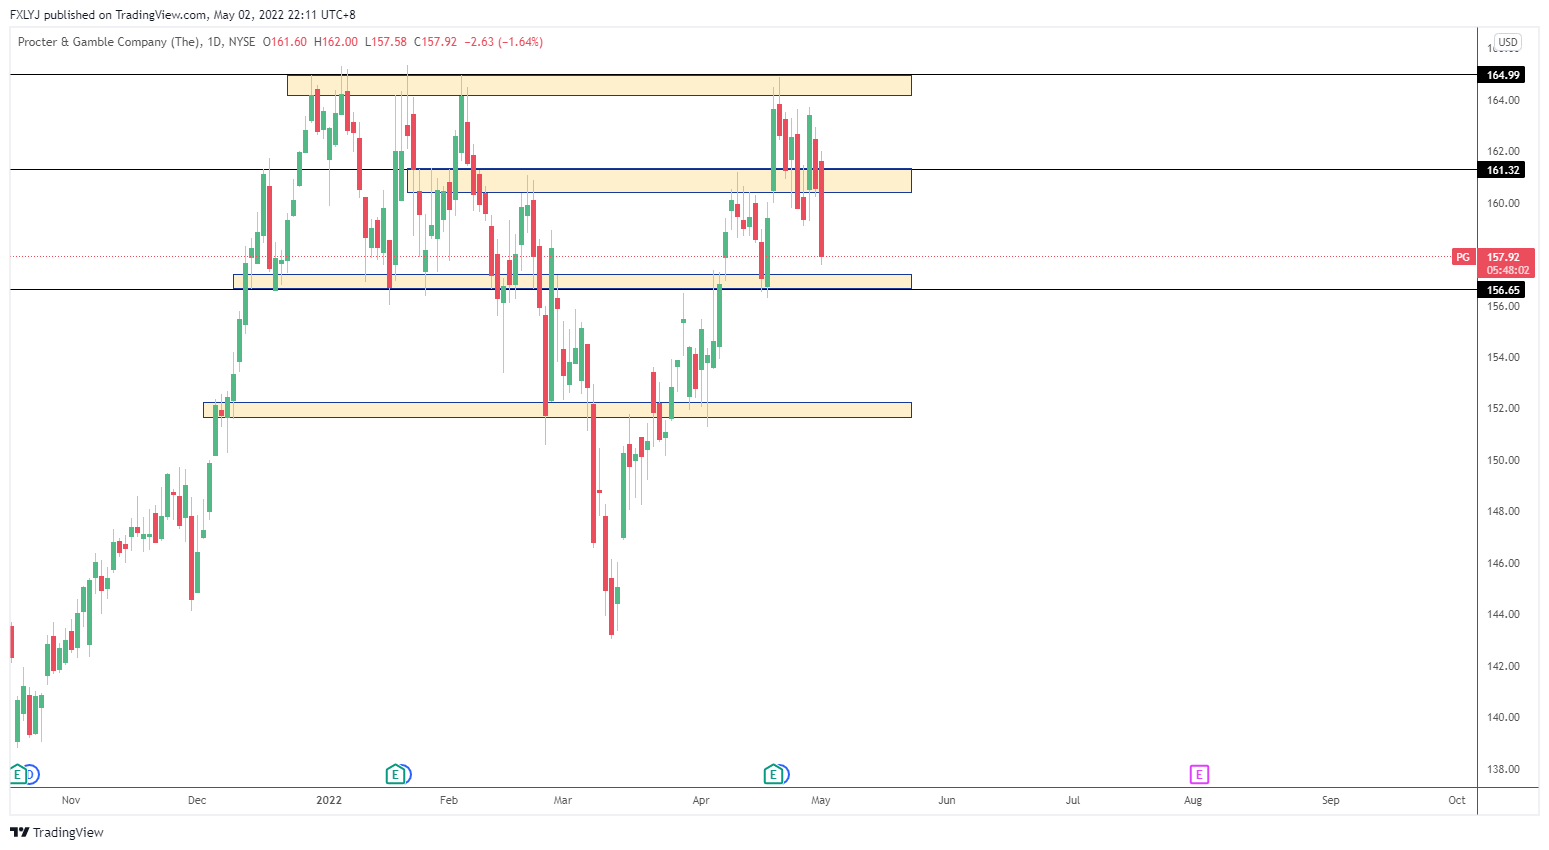
Status: Neutral
Support: USD156.65
Resistance: USD161.32
Range-bound
Johnson & Johnson (NYSE:JNJ)
JNJ has mixed earnings for this quarter. JNJ’s EPS of USD2.67 was higher than the estimates of USD2.58 and revenue of USD23.4 billion missed estimates of USD23.6 billion9. JNJ lowered its forecast revenue by US1 billion for the coming year to between USD94.8 billion and USD95.8 billion. Moving forward, JNJ will not be giving COVID vaccine sales guidance as its vaccine is not for profit. JNJ opened April at USD177.05 and gained 1.9% to close at USD180.4610.
Technical analysis
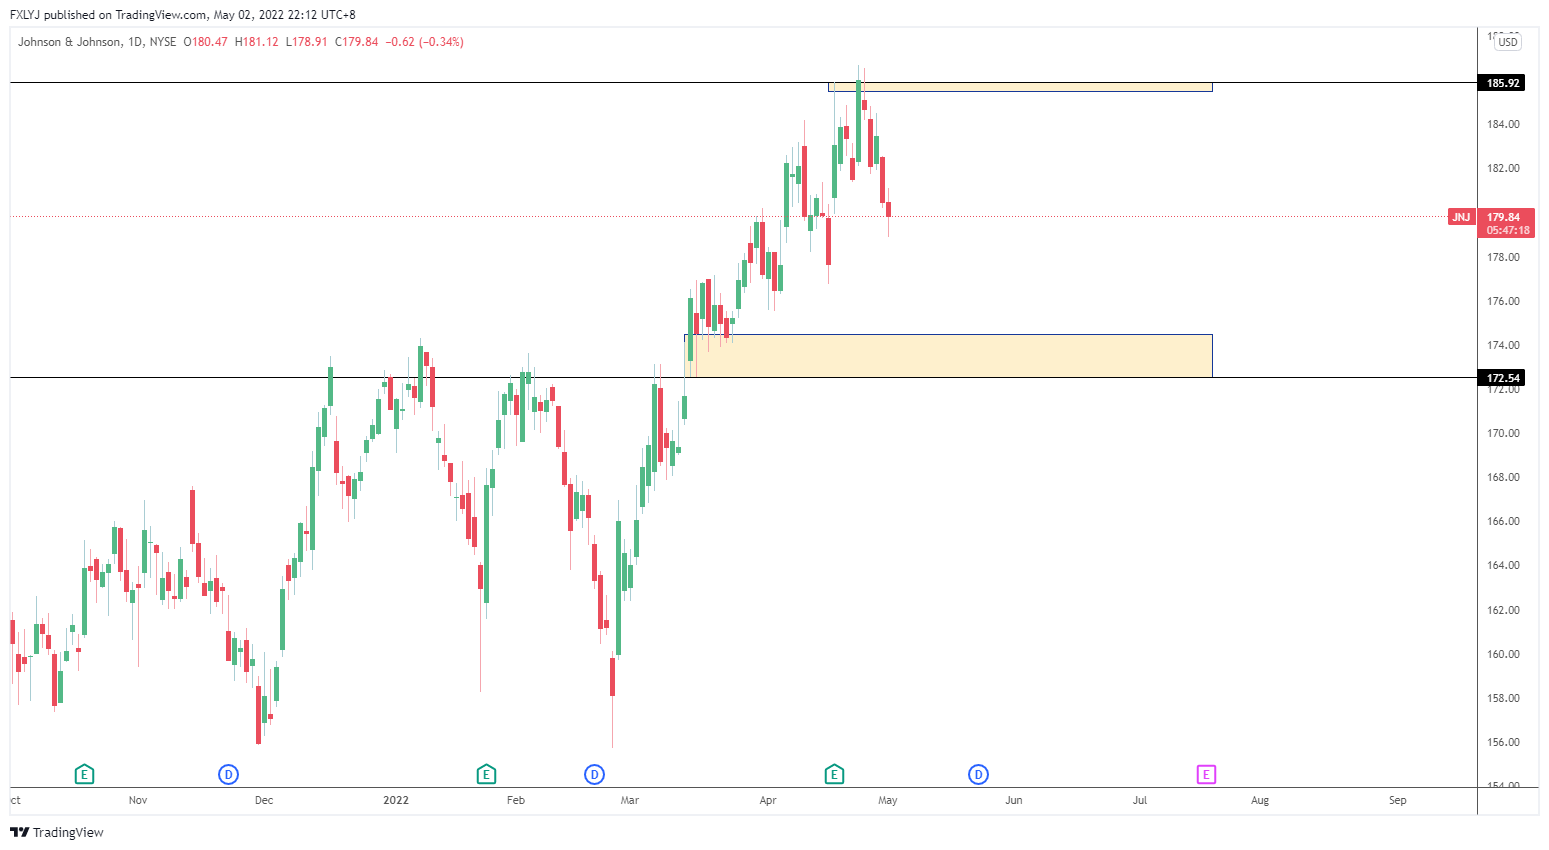
Status: Bullish market structure
Support: USD172.54
Resistance: USD185.92
Price has to form higher high after breaking immediate resistance for potential upside.
Tesla (NASDAQ: TSLA)
TSLA reported first-quarter earnings for 2022 and beat estimates for April. With an EPS of USD3.22 and revenue of USD18.76 billion both beating estimates of USD2.26 and USD17.80 billion respectively. The company did not give detailed forward guidance but expects 50% annual growth on a multi-year basis. However, the company has lost about a month of “build volume” in Shanghai due to COVID-related shutdowns and warned that limitations on the supply chain will likely persist through 2022. TSLA opened April at USD1081.15 and dropped 19.5% to close at USD870.7611.
Technical analysis
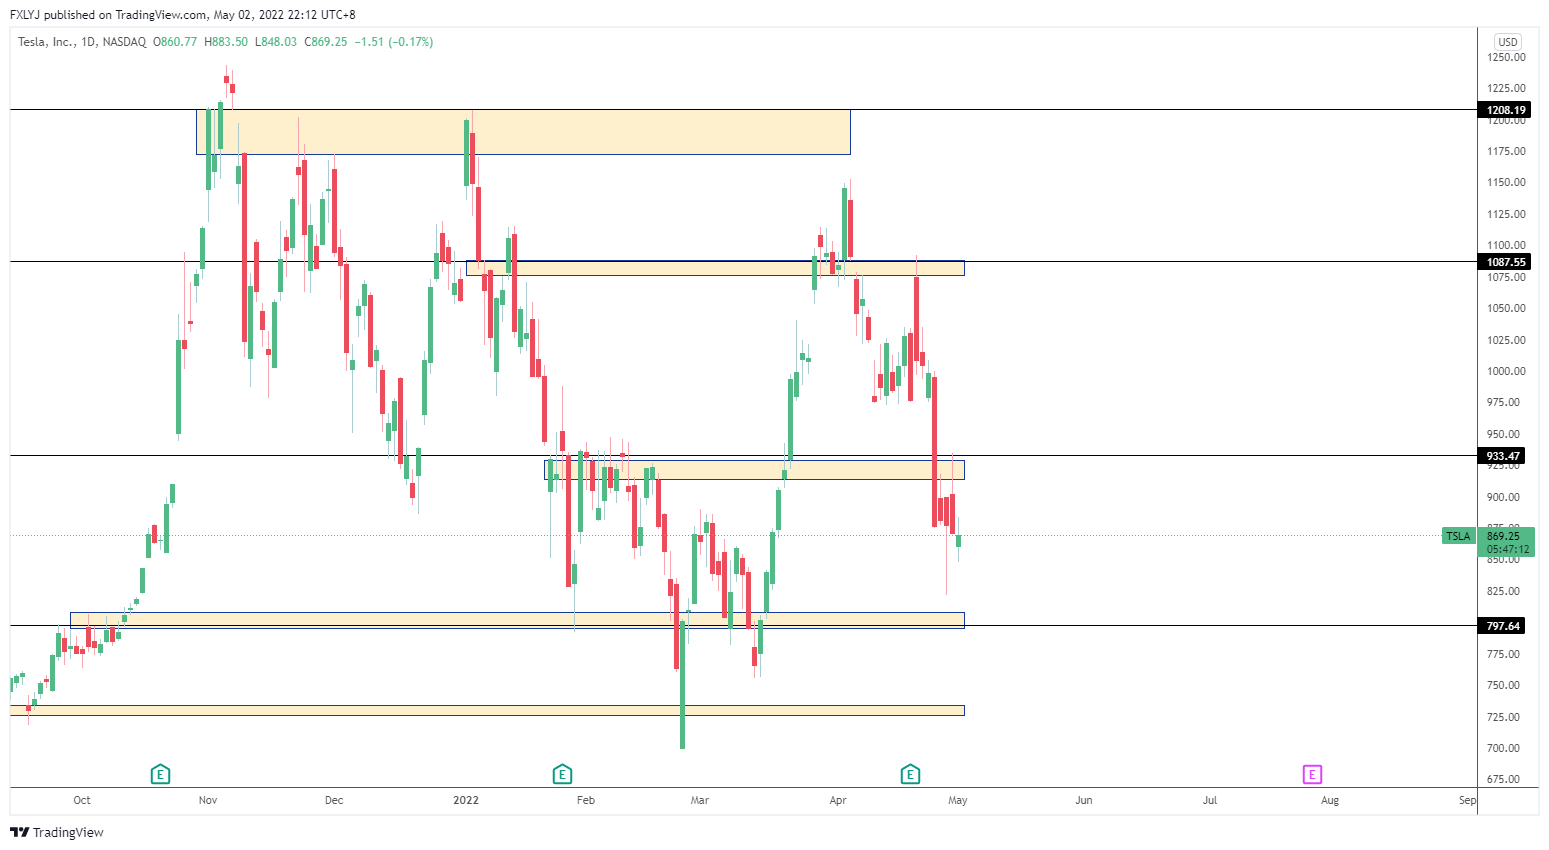
Status: Neutral
Support: USD797.64
Resistance: USD933.47
Range-bound
Netflix (NASDAQ:NFLX)
NFLX delivered its worst earnings results this quarter. NFLX EPS was reported at USD3.53 against the estimate of USD2.8912. Reported revenue was lower at USD7.87 billion against the expected USD7.93 billion. What caused NFLX to dive was the loss of subscribers for the first time in more than 10 years and it is estimating a loss of 2 million subscribers for the coming quarter. NFLX cited growing competition and password sharing for the loss in subscribers. NFLX opened April at USD376.80 and lost 49.5% to close at USD190.36.
Based on Phillip Securities Research (PSR), NFLX is a BUY with a target price of US$ 427.00.
Technical analysis
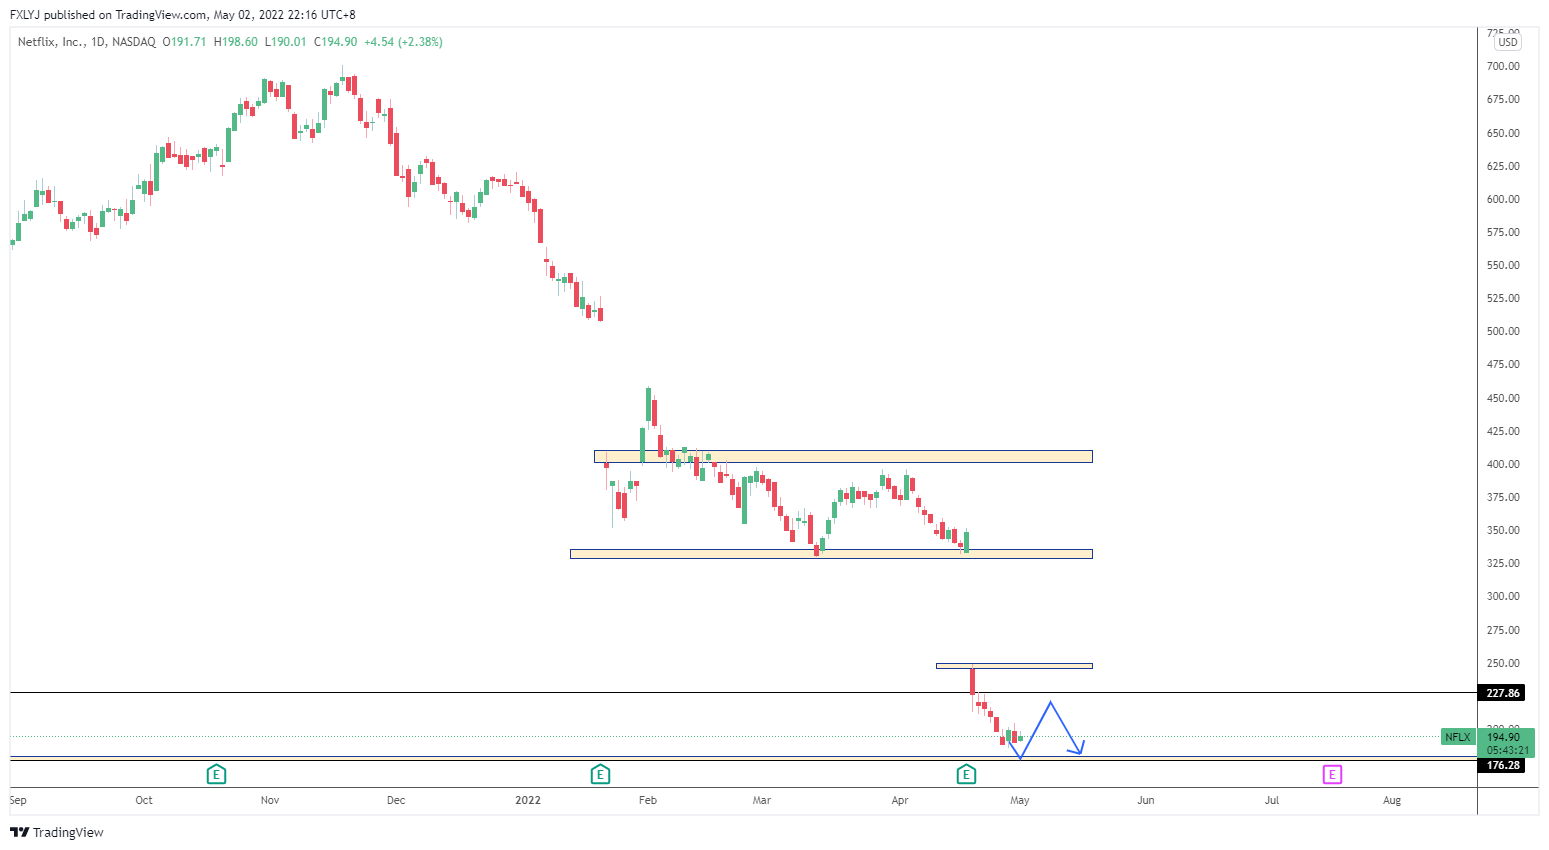
Status: Neutral
Support: USD176.28
Resistance: USD227.86
Range-bound
American Airlines (NASDAQ: AAL)
AAL reported mixed earnings for this quarter. EPS missed estimates but there was a beat on revenue. EPS was reported at USD2.32 missing estimates of USD2.40. Reported revenue was higher at USD8.9 billion against the expected USD3.009 billion. For the next quarter, with soaring travel demand due to easing of COVID-19, AAL forecast next quarter sales to be 8% higher than the same period three years ago and business travel revenue to recover by 90% to 2019 2nd quarter levels13. AAL opened April at USD18.30 and rose by 2.57% to close at USD18.77.
Technical analysis
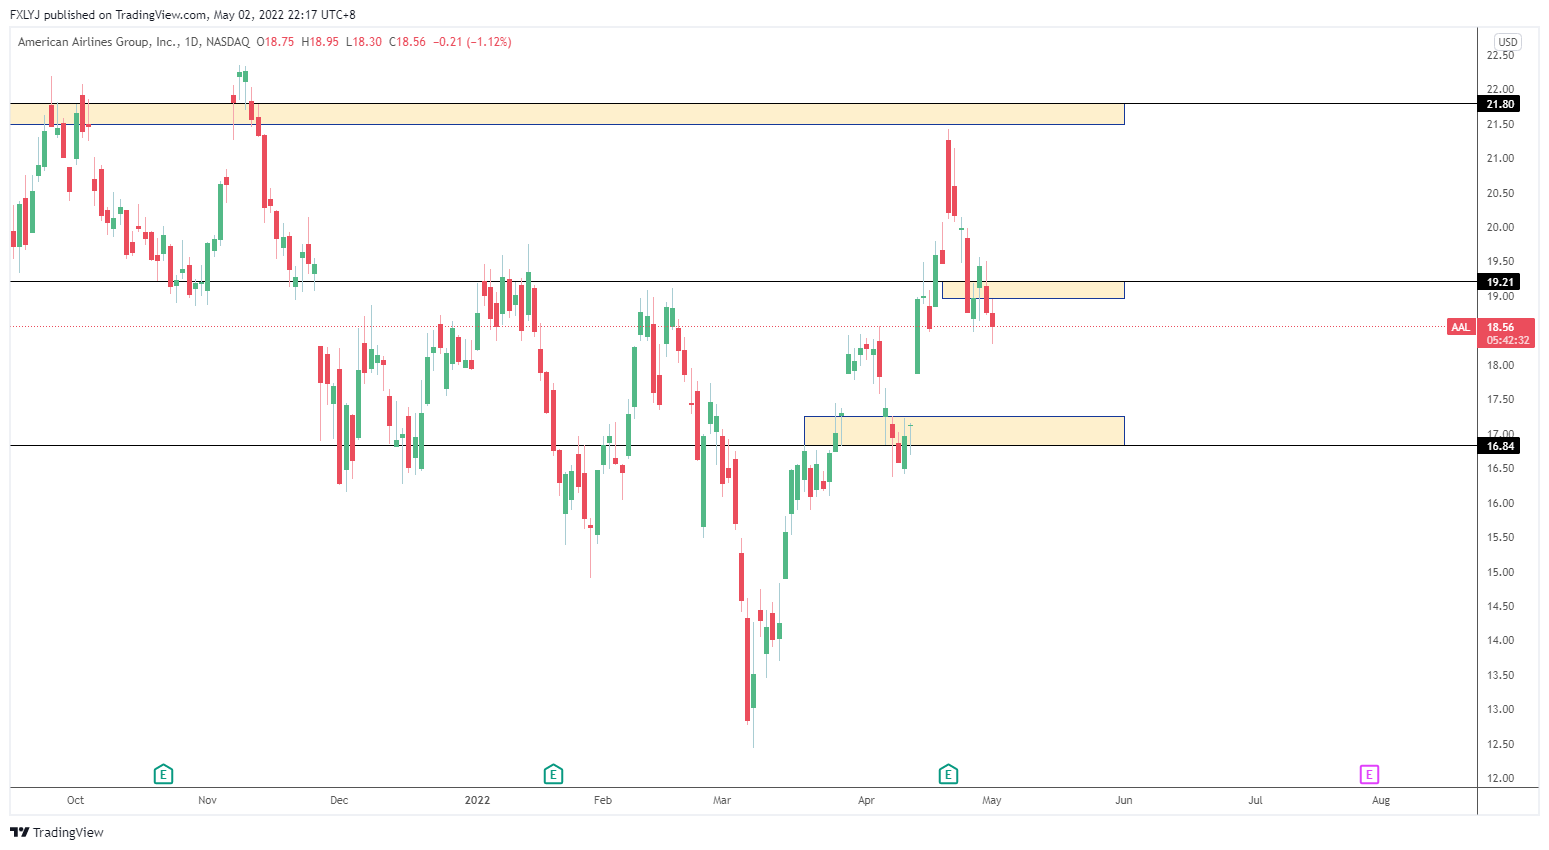
Status: Neutral
Support: USD16.84
Resistance: USD19.21
Price has to hold above immediate support with a bullish closing for more upside.
United States Oil Fund (NYSE: USO)
USO is an exchange-traded fund that attempts to track the price of West Texas Intermediate Light Sweet Crude Oil. Its performance is determined by the price of oil futures contracts that it invests in, and trades on regulated futures exchanges14. Oil price movements are mixed as concern remains about supply due to a potential European Union ban on Russian oil imports that would further restrict worldwide oil trade15. At the same time there are worries about demand from China, the world’s largest importer. Demand fell around 1.2 million barrels a day in April due to prolonged Covid-19 lockdowns16. USO opened at USD73.37 and gained 5.17% to close at USD77.16.
Technical analysis
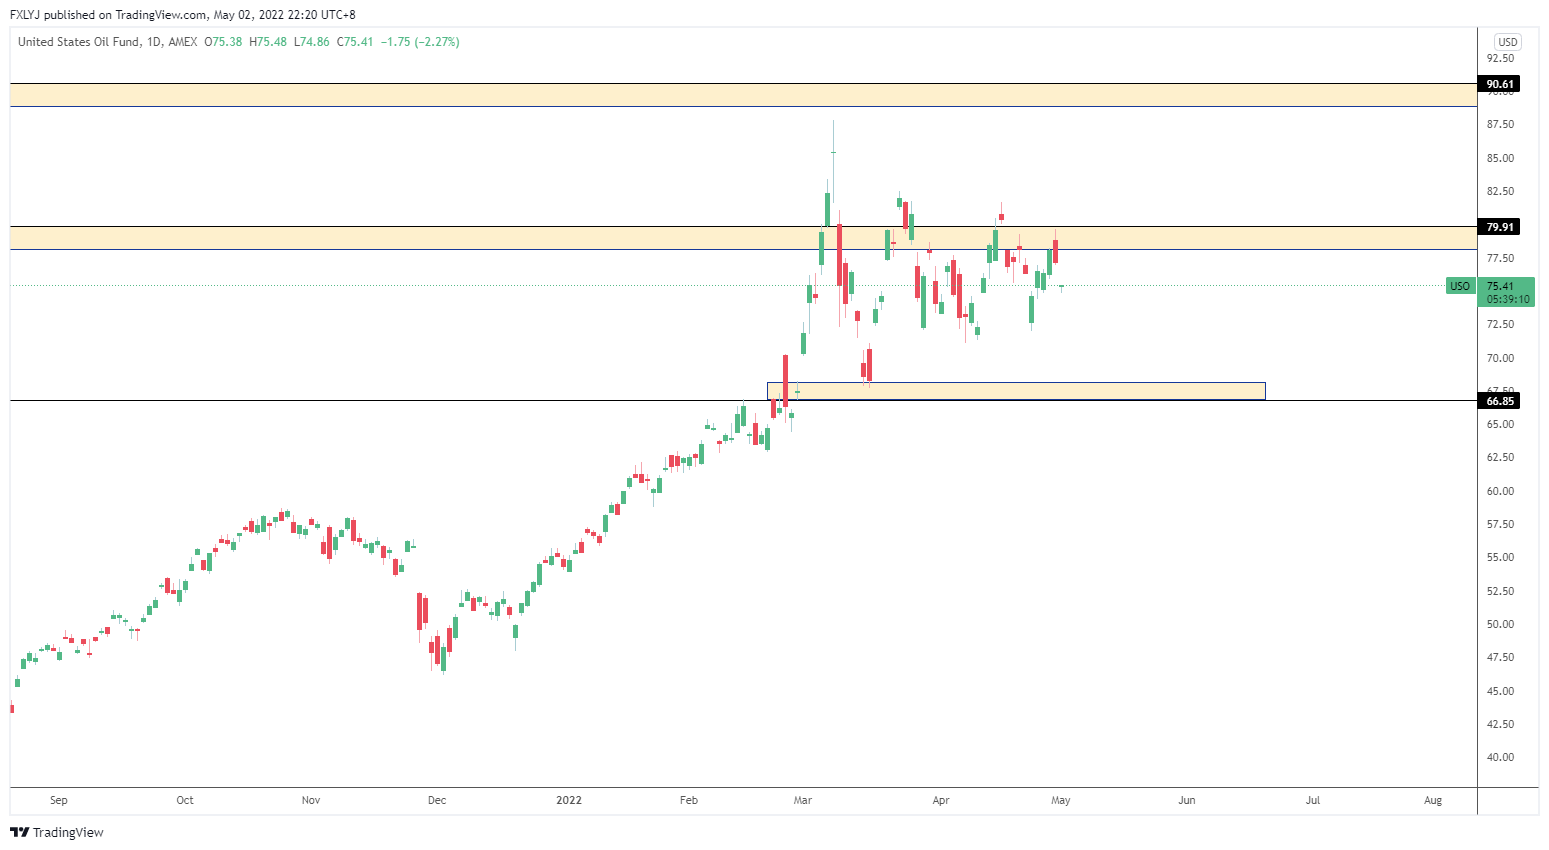
Status: Neutral
Support: USD66.85
Resistance: USD79.91
Price has to hold above immediate resistance with a bullish closing for more upside.
SPDR S&P 500 ETF TRUST (NYSE: SPY)
SPY is a float-weight index exchange-traded fund that seeks to correspond generally to the price and yield performance of the S&P 500 index17. SPY’s expense ratio is 0.0945% with a weighted average market capital of USD578 billion. As of 31 March 2022, the last 10 year and 5 year annual performances are at 14.49% and 15.83% respectively. The top 3 holdings of the funds are Apple Inc, Microsoft Corporation and Amazon.com Inc. SPY opened at USD453.31 and lost 9.11% to close at USD412.00.
Technical analysis
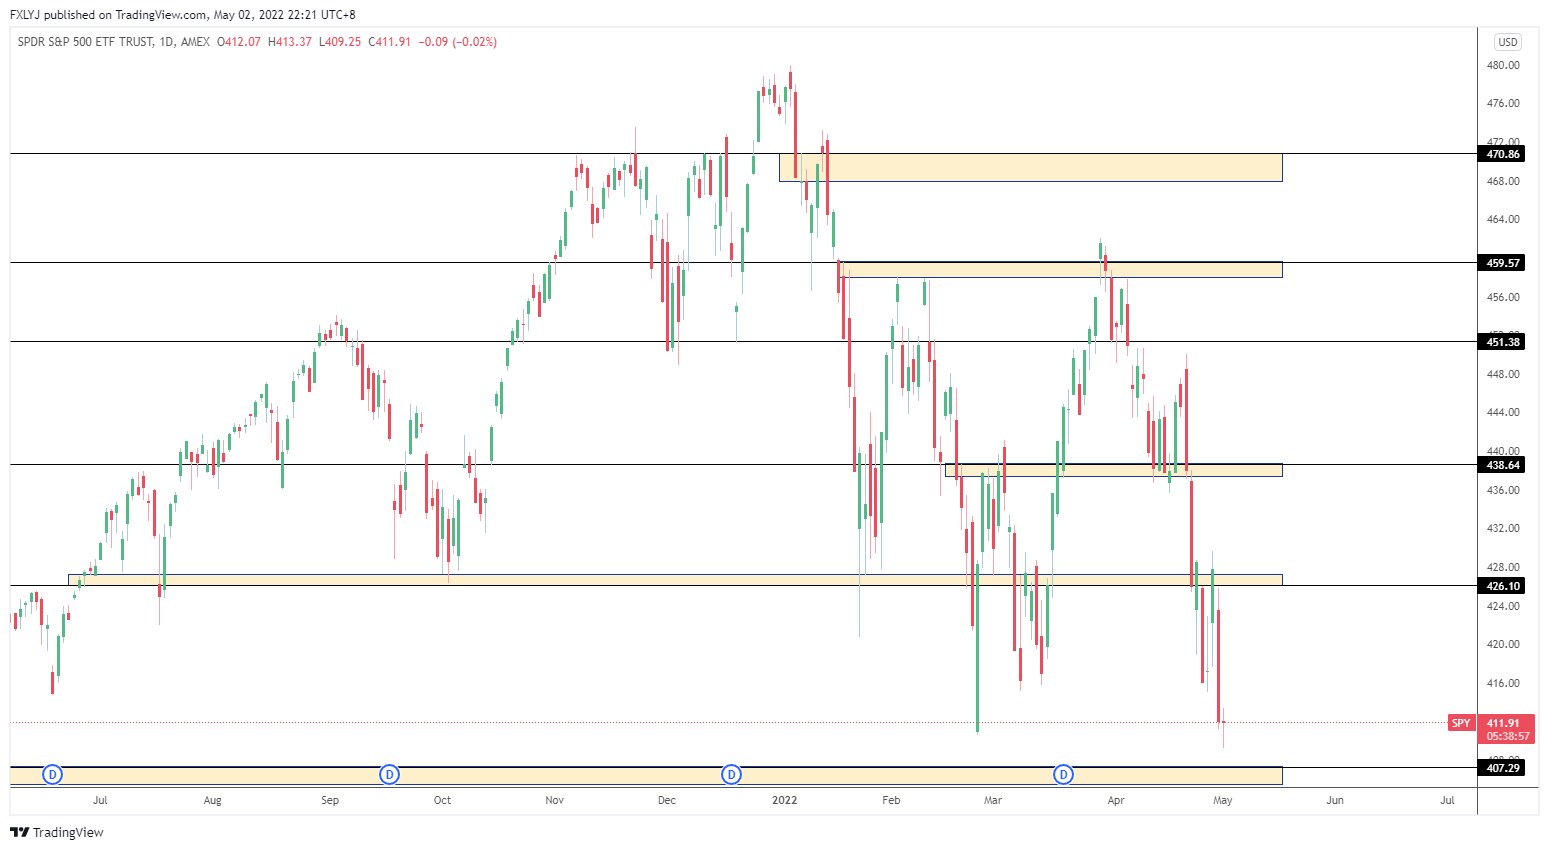
Status: Neutral
Support: USD407.29
Resistance: USD426.10
Range bound.
Bloomberg analysts’ recommendations
The table below shows the consensus ratings and average ratings of all analysts updated on Bloomberg in the last 12 months. Consensus ratings have been computed by standardising analysts’ ratings from a scale of 1 (Strong Sell) to 5 (Strong Buy). The table also shows a number of analysts’ recommendations to buy, hold or sell the stocks, as well as their average target prices.
| Security | Consensus Rating | BUY | HOLD | SELL | 12 Mth Target Price (US$) |
| ASML Holdings (NYSE:ASML) | 4.56 | 7(77.8%) | 2(22.2%) | 0 | 719.8 |
| Bank of America (NYSE:BAC) | 4.24 | 18(62.1%) | 11(37.9%) | 0 | 49.21 |
| Freeport-McMoRan (NYSE: FCX) | 4.17 | 16(66.7%) | 6(25%) | 2(8.3%) | 50.64 |
| Procter & Gamble (NYSE: PG) | 3.88 | 13(52%) | 10(40%) | 2(8%) | 165.43 |
| Johnson & Johnson (NYSE:JNJ) | 3.87 | 11(47.8%) | 11(47.8%) | 1(4.3%) | 191.42 |
| Tesla (NASDAQ: TSLA) | 3.43 | 23(50%) | 10(21.7%) | 13(28.3%) | 999.91 |
| Netflix (NASDAQ:NFLX) | 3.38 | 15(28.8%) | 32(61.5%) | 5(9.6%) | 317.83 |
| American Airlines (NASDAQ: AAL) | 3 | 4(18.2%) | 14(63.6%) | 4(18.2%) | 19.52 |
Want to get daily updates on market events? You can join our Telegram Channel here.
To round up
The future is very uncertain with high inflation and geopolitical tension. As can be seen from the top 10 counters, investors are more reluctant to hold on to stocks in the cyclical industry and are rotating to defensive industries.

Explore a myriad of useful features including TradingView chartings to conduct technical analysis with over 100 technical indicators available!
Take this opportunity to expand your trading portfolio with our wide range of products including Stocks, CFDs, ETFs, Unit Trusts and more across 15 global exchanges available for you anytime and anywhere to elevate you as a better trader using our POEMS Mobile 3 App!
Reference:
- [1] “US Inflation Accelerated to 8.5% in March, Hitting Four-Decade High.” 12 Apr. 2022
- [2] “Where Inflation Rose, Cooled the Most in March – WSJ.” 12 Apr. 2022
- [3] “Fed’s Powell Seals Expectations of Half-Point Rate Rise in May – WSJ.” 21 Apr. 2022
- [4] “US GDP Falls 1.4% as Economy Shrinks for First Time Since Early in ….” 28 Apr. 2022
- [5] “ASML Earnings Date – Nasdaq.”
- [6] “Bank of America shares jump after lender tops analysts’ estimates ….” 18 Apr. 2022
- [7] “Freeport-McMoRan Earnings: Top Copper Stock Slides On Outlook.” 22 Apr. 2022
- [8] “Procter & Gamble (PG) Q2 2022 earnings beat estimates – CNBC.” 19 Jan. 2022
- [9] “Covid and JNJ earnings Q1 2022 – CNBC.”
- [10] “Target (TGT) Q4 2021 earnings – CNBC.” 1 Mar. 2022
- [11] “Tesla reports $18.76 billion in revenue and record margins in Q1.” 21 Apr. 2022
- [12] “Netflix (NFLX) earnings Q1 2022 – CNBC.” 19 Apr. 2022
- [13] “American Airlines (AAL) 1Q 22 earnings – CNBC.”
- [14] “United States Oil Fund – Wikipedia.”
- [15] “Oil edges higher on concerns over Russia, Libya supply disruption.” 22 Apr. 2022
- [16] “Crude Oil Lower; Slowing Chinese Demand Weighs By Investing.com.” 22 Apr. 2022
- [17] “SPY: SPDR® S&P 500® ETF Trust – SSGA.”
Disclaimer
These commentaries are intended for general circulation. It does not have regard to the specific investment objectives, financial situation and particular needs of any person who may receive this document. Accordingly, no warranty whatsoever is given and no liability whatsoever is accepted for any loss arising whether directly or indirectly as a result of any person acting based on this information. Opinions expressed in these commentaries are subject to change without notice. Investments are subject to investment risks including the possible loss of the principal amount invested. The value of the units and the income from them may fall as well as rise. Past performance figures as well as any projection or forecast used in these commentaries are not necessarily indicative of future or likely performance. Phillip Securities Pte Ltd (PSPL), its directors, connected persons or employees may from time to time have an interest in the financial instruments mentioned in these commentaries. Investors may wish to seek advice from a financial adviser before investing. In the event that investors choose not to seek advice from a financial adviser, they should consider whether the investment is suitable for them.
The information contained in these commentaries has been obtained from public sources which PSPL has no reason to believe are unreliable and any analysis, forecasts, projections, expectations and opinions (collectively the “Research”) contained in these commentaries are based on such information and are expressions of belief only. PSPL has not verified this information and no representation or warranty, express or implied, is made that such information or Research is accurate, complete or verified or should be relied upon as such. Any such information or Research contained in these commentaries are subject to change, and PSPL shall not have any responsibility to maintain the information or Research made available or to supply any corrections, updates or releases in connection therewith. In no event will PSPL be liable for any special, indirect, incidental or consequential damages which may be incurred from the use of the information or Research made available, even if it has been advised of the possibility of such damages. The companies and their employees mentioned in these commentaries cannot be held liable for any errors, inaccuracies and/or omissions howsoever caused. Any opinion or advice herein is made on a general basis and is subject to change without notice. The information provided in these commentaries may contain optimistic statements regarding future events or future financial performance of countries, markets or companies. You must make your own financial assessment of the relevance, accuracy and adequacy of the information provided in these commentaries.
Views and any strategies described in these commentaries may not be suitable for all investors. Opinions expressed herein may differ from the opinions expressed by other units of PSPL or its connected persons and associates. Any reference to or discussion of investment products or commodities in these commentaries is purely for illustrative purposes only and must not be construed as a recommendation, an offer or solicitation for the subscription, purchase or sale of the investment products or commodities mentioned.
About the author
Jonah Sim Hong Chee (Dealer) & Lee Ying Jie (Dealer) & Chan Zi Quan (Dealer)
Jonah Sim is a US Equity Dealer in the Global Markets Team and specializing in US and Canadian markets. He graduated from University of Essex with a bachelor’s degree in Banking and Finance.
Ying Jie is a US Equity Dealer in the Global Markets Team and specializing in US and Canadian markets. He is proficient in trading using Technical Analysis, placing emphasis on supply and demand, and price action.
Zi Quan is a US Equity Dealer in the Global Markets Team and specializes in the US and Canadian markets. He is an avid crypto fan and is adept in macro analysis.

 Back in Business: The Return of IPOs & Top Traded Counters in March 2024
  From $50 to $100: Unveiling the Impact of Inflation
  How to soar higher with Positive Carry!
  Why 2024 Offers A Small Window of Opportunity and How to Position Yourself to Capture It


